Tag Archives: Waccabuc Real Estate

#Hamptons real estate prices up, sales slow | #Waccabuc Real Estate

Real estate prices continued to climb in the third quarter of 2015, but sales pace slowed and inventory is more difficult to come by, when compared with the third quarter of 2014, which was a banner season for real estate on the East End.

According to The Corcoran Group’s quarterly Corcoran Report, “the volatility of financial markets world-wide resulted in fewer closed transactions this quarter.”

On the South Fork, according to Corcoran, sales activity and sales volume declined by 16 percent and 13 percent, respectively, compared to the third quarter of 2014. Only East Hampton Village, Southampton and Shelter Island reported more sales than last year.

The Corcoran Group reported that the average sale price on the South Fork increased 3 percent, while the median price rose 6 percent, versus the same quarter a year ago.

Nine sales over $5 million in East Hampton Village skewed the median price there up 70 percent over the third quarter of 2014.

Though recent quarters have shown a good deal of activity in the under-$500,000 range, where such properties can even be found on the South Fork, that share of the market shrank in the third quarter both east and west of the Shinnecock Canal.

East of the canal, under-$500,000 sales shrunk to just 8 percent of the market, from 14 percent in the third quarter of 2014, while the market share of houses under $500,000 west of the canal shrank from 41 percent in the third quarter of 2014 to 38 percent in the third quarter of this year.

On the North Fork, the Corcoran Group reported the number of sales and sales volume decreased 11 percent and 17 percent, respectively, over the third quarter of 2014. They reported the median sales price increased 1 percent, but the average sales price decreased 8 percent.

On the North Fork, they reported the $500,000 to $750,000 market range grew from 23 percent to 31 percent of sales, while market shares above and below those ranges declined by 4 percent.

The Corcoran Group also reported that the total inventory of residential properties for sale on both forks declined by 383 housing units from the third quarter of 2014.

With a limited amount of vacant land available for sale on the East End, the number of vacant land sales decreased quarter-over-quarter by 32 percent on the South Fork and 29 percent on the North Fork.

In commercial markets however, The Corcoran Group saw quite a bit of activity on the North Fork, with the number of sales increasing 67 percent. The number of South Fork commercial sales declined 37 percent over the same period.

Douglas Elliman Real Estate’s Elliman Report also showed a market slow-down on the South Fork when compared with the same quarter in 2014, though they did report greater gains in prices.

Douglas Elliman reported 507 sales on the South Fork in the third quarter, 20 percent below the same quarter in 2014 but 11 percent above the decade quarterly average of 457 sales.

The market share of sales below $12 million fell to 49.5 percent, its lowest point in the past four years, with 44 percent of sales between $1 million and $5 million.

According to Douglas Elliman, listing inventory on the South Fork was unchanged over the third quarter of 2015, with 1,710 houses on the market this quarter. The listing discount, or the difference between the last listing price and the sales price, declined to 10.2 percent from 12 percent in the same quarter last year.

Median sales price rose to $950,000, up 9.8 percent over the same quarter last year, the fourth highest level reported in the past decade.  The average number of days on the market fell 6.4 percent to 161.

Douglas Elliman reported that North Fork housing prices also skewed higher, with the median sales price jumping 16.1 percent to $516,250, the second highest median price in the past seven years. Only the second quarter of 2015 saw higher prices on the North Fork, and the year-over-year increase was the sixth consecutive quarterly increase.


read more…


http://www.eastendbeacon.com/2015/11/04/real-estate-third-quarter-figures-pale-after-banner-2014-season/

U.S. new homes sales near one-year low | Waccabuc Real Estate

New U.S. single-family home sales fell to near a one-year low in September after two straight months of gains, but a jump in prices suggested that housing remained on solid ground.

The Commerce Department said on Monday sales dropped 11.5percent to a seasonally adjusted annual rate of 468,000 units, the lowest level since November 2014. August’s sales pace was revised down to 529,000 units from the previously reported 552,000 units.

The moderation in new home sales is at odds with other housing reports that have painted a bullish picture of the sector. New home sales, which account for 7.8 percent of the housing market, tend to be volatile on a month-to-month basis because they are drawn from a small sample.

“The September report does little to alter our view that the housing market is continuing to recover. We view the new home sales data as unreliable and many other more reliable housing indicators have been sending upbeat signals lately,” said Daniel Silver, an economist at JPMorgan.

September data on existing home sales, homebuilder confidence and housing starts have been fairly strong.


read more…


http://www.reuters.com/article/2015/10/26/us-usa-economy-idUSKCN0SK1PW20151026

Secondary Real-Estate Markets Are Moving Up | Waccabuc Real Estate

Move over Houston, make way for Dallas-Fort Worth — and a host of other up-and-coming secondary markets such as Charlotte, N.C., Seattle, Atlanta, Denver, Nashville, Tenn., and Portland, Ore.

That’s the conclusion of real-estate professionals who were asked about their views on the best markets for property investment and development in 2016.

The survey was conducted by the Urban Land Institute and PcW and released this week at the ULI’s fall meeting in San Francisco.

Houston was the No. 1 pick in last year’s survey on markets to watch in 2015, but it sunk to No. 23 in the latest survey for 2016 expectations, amid worries about the impact of prolonged low oil prices on the energy capital’s local economy.

In its decline, Houston was in distinguished company: Also not making the top-10 list were major gateway cities of New York, Boston and Washington, D.C., which have been losing favor with real-estate professionals in recent years.

Sixth-place Denver, also known as an energy market, “is more diversified (than Houston) and seems to be chugging right through” the low-price oil environment, said Ben Breslau, managing director of Americas Research at commercial real-estate firm JLL (NYSE:JLL), during a ULI conference panel. He noted that 5 million to 6 million square feet of commercial space hit the market this year in Houston as rents trended down.

Another panelist, Kenneth Rosen, chairman of Rosen Consulting Group, said the energy belt has a “digestive issue” and warned investors to avoid Houston.

Read More: http://news.investors.com/business-inside-real-estate/100815-774729-secondary-real-estate-markets-emerging.htm#ixzz3o6RKZeaH

Rent the ‘Hobbit treehouse’ | #Waccabuc Real Estate

hobbit10.png

Setting aside the fact that no self-respecting hobbit would ever choose to live in a tree instead of burrowing into the side of a hill, this “Hobbit treehouse” in the Black Hills of South Dakota is very, very good, with the entire interior (save for one leather couch, which still basically works) decked in very Hobbit-esque decor. The door, too, is a real highlight. If you’re passing through South Dakota and have big, fuzzy feet, thetreehouse is available for $639/night for a minimum of three nights. It doesn’t say whether there’s a surcharge if a bunch of dwarves unexpectedly show up for a dinner party.

hobbit7.png

hobbit3.jpg

hobbit2.jpg

hobbit9.png

hobbit11.png

hobbit4.jpg

hobbit1.jpg

hobbit5.jpg

hobbit6.jpg

read more…

http://curbed.com/archives/2015/09/30/hobbit-treehouse-south-dakota.php?utm_campaign=issue-40308&utm_medium=email&utm_source=Curbed

· Lord of the Rings-Inspired Hotel Invites Guests to Live in a “Hobbit Treehouse” [My Modern Met]
· Chateau De Soleil (Look:) Prodigious Hobbit Tree House!) [VRBO]

US Home Builders Optimistic | Waccabuc Real Estate

U.S. homebuilders are feeling slightly more optimistic about the housing market, nudging their confidence this month to a level not seen since the high-flying days of the housing boom nearly 10 years ago.

The National Association of Home Builders/Wells Fargo builder sentiment index released Wednesday rose this month to 62, up from 61 in August. The last time the reading was higher was October 2005 at 68.

Readings above 50 indicate more builders view sales conditions as good, rather than poor. The index has been consistently above 50 since July last year.

Builders’ view of current sales conditions and their view of traffic by prospective buyers rose this month. But their outlook for sales over the next six months declined slightly.

read more..

http://hosted.ap.org/dynamic/fronts/BUSINESS?SITE=AP&SECTION=HOME

US home prices rise steadily in June | Waccabuc Real Estate


U.S. home prices rose solidly in June, another sign of health in the housing market.

The Standard & Poor’s/Case-Shiller 20-city home price index rose 5 percent from a year earlier, a slight improvement on May’s 4.9 percent increase, according to S&P Dow Jones Indices.

Prices rose 10.2 percent in Denver, 9.5 percent in San Francisco and 8.2 percent in Dallas. Chicago posted the smallest gain, just 1.4 percent.

Strong sales have been lifting prices. The National Association of Realtors said last week that sales of existing homes rose 2 percent in July to a seasonally adjusted annual rate of 5.59 million, the fastest pace since February 2007. The Commerce Department reported last week that U.S. builders started work on single family homes in July at the fastest pace since late December 2007, the month the Great Recession began.

“The missing piece in the housing picture has been housing starts and sales,” said David Blitzer, chairman of the S&P Down Jones index committee. “These have changed for the better in the last few months.”

Still, some uncertainties weigh on the housing market. The Federal Reserve is considering whether to raise short-term interest rates, a move that might send mortgage rates higher. For now, the average rate on 30-year fixed-rate mortgages remains below 4 percent. Blitzer says a modest Fed rate increase “won’t derail housing.”

Housing is also drawing strength from a healthy labor market. U.S. unemployment is at 5.3 percent, a seven-year low.’


read more…


http://www.usnews.com/news/business/articles/2015/08/25/us-home-prices-rise-steadily-in-june-as-sales-pick-up

Why housing isn’t back in a bubble | Waccabuc Real Estate

This is the third of three articles about the U.S. housing market. Ex-housing, the U.S. is in deflation currently at -1% YoY. So the only current “inflation risk” that might justify the Fed raising rates is the appreciation in house prices. In my previous two posts, I explained that both housing and apartment demand are supported by increased demographic demand, as the Millennial generation creates about the same affect on single and multi-unit housing as their Boomer parents and grandparents did 50 years ago. Further, there has been a marked increase in foreign buying of homes, skewed towards the upper end and disproportionately all-cash purchases. As a big part of this increase has come from Chinese nationals, the current problems hitting that county may ease demand, and therefore ease upward pressure, on U.S. house prices.

But some have argued that housing has entered a 2nd bubble. Some of this comes from the usual Doomer chorus Seriously, one guy actually claimed a couple of weeks ago that there was a bubble in rents! It must be the Underpants Gnomes theory of bubbles:
1. rent lots of vacant units
2. ???
3. Profit!

What’s the missing step 2? Sublet everything, because everyone knows that rents only go up?!?

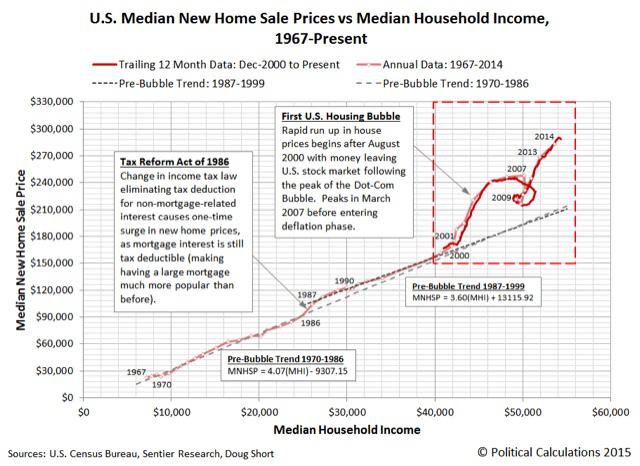
But some is more serious analysis. The website Political Calculations, for example, believes there is a bubble based on the movement in prices vs. median household income. Here’s their relevant graph:

The point of view does have merit, since after all it is households buying houses! But I believe that misses the bigger picture.

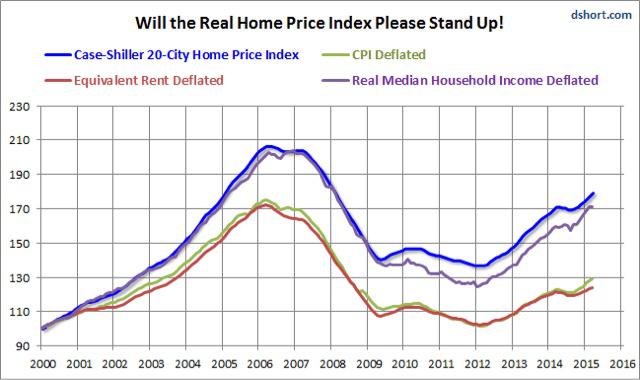
To begin with, the big problem in assessing house prices is that, since housing is itself nearly 40% of the CPI, by what should house prices be deflated, for a “real” measure? Here is a graph created by Doug Short, the Case Shiller house index by median household income, by the entire CPI, and by owner’s equivalent rent:

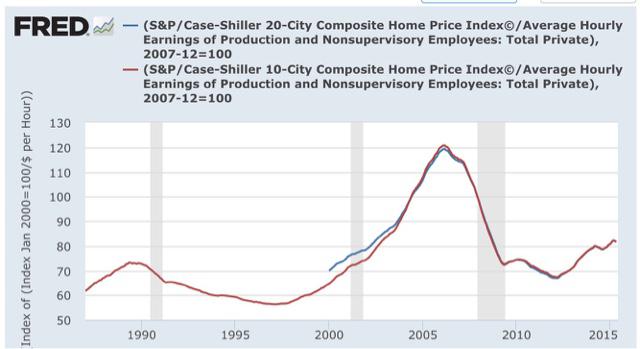
Nominal house prices, and prices deflated by median household income, appear to show housing in a new bubble. But deflated by CPI and by owner’s equivalent rent, prices haven’t moved much off their bottom. Nor has there been much movement when house prices are deflated by average hourly wages:

To sort out how extreme (or not) house prices are, let’s consider three types of purchasers:
1. the entry level purchaser, likely young, likely buying a townhouse, condo, or small single family home perhaps in an inner ring suburb.
2. the move-up purchaser, trading in a smaller house for a bigger one.
3. the retirement purchaser, either downsizing or building the retirement home of their dreams.

Income is likely the main measure for the 1st purchaser. They probably don’t have a lot of savings with which to make a big downpayment, and may be getting help from family members. The most important thing for them is whether they will be able to make the monthly mortgage payment and other bills.

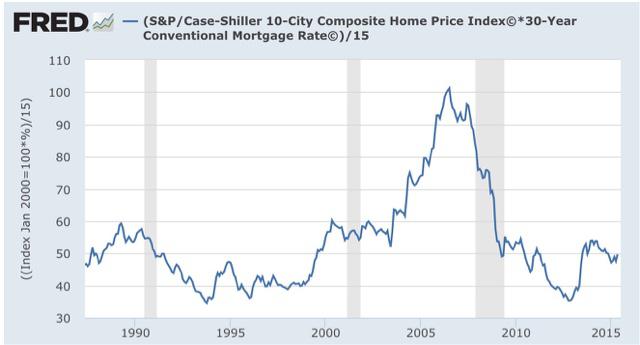
While household income constrains that ability, mortgage rates also loom large. And here is what happens when we calculate the monthly mortgage payment of a house, as measured by the Case Shiller Index, and then adjusted for mortgage rates:

Courtesy of lower mortgage rates, even though median household income has actually declined for all ages 25-64 since 2007, the typical monthly mortgage payment now is only about 50% of what it was at the peak of the housing bubble, even when we take median household income into account.


read more…


http://seekingalpha.com/article/3434566-why-there-is-no-second-housing-bubble?ifp=0

Sellers are Pocketing their Biggest Profits since the Peak | Waccabuc Real Estate

Single family home and condo sellers in the first half of 2015 sold for more above their purchase price in the first half of this year than any time since prices were at the peak of the boom.

Homes sold for an average of 13 percent above their original purchase prices, the highest average percentage in home price gains realized by sellers since 2007, when it was 30 percent, according to RealtyTrac.

Major markets where sellers in the first half of 2015 realized the biggest average home price gains were San Jose, California (41 percent); San Francisco (37 percent); Denver (29 percent); Portland (25 percent); Los Angeles (25 percent); and Seattle (20 percent).

“Sales activity has been strong this year and the metrics point to a solid foundation for steady growth. Growing boomerang buyer interest and first time buyer participation combined with smarter lending requirements are fostering a sustainable market,” said Mark Hughes, chief operating officer with First Team Real Estate, covering the Southern California market. “Lower investor, cash, and distressed activity are three reliable indicators that peripheral buying and selling activity is settling back down and the traditional owner occupied residential market is back on solid ground and healthy.”

There were six major markets where sellers in the first half of 2015 on average sold below their original purchase price: Chicago (7 percent below); Cleveland (7 percent below); Hartford, Connecticut (3 percent below); Jacksonville, Florida (2 percent below); St. Louis (1 percent below); and Orlando (1 percent below).

Zillow and Case-Shiller both reported strong appreciation in their first quarter reports, Zillow at 5.2 percent year over year for its 20-city composite and Case-Shiller at 5.0 percent.

“Home price appreciation has settled into a nice groove over the past few months, and ought to remain there going forward. This is still more proof that the for-sale market, while certainly not yet fully healed, is continuing to return to normal,” said Zillow Chief Economist Dr. Stan Humphries when the first quarter results were released May 26. “But relative strength in one indicator shouldn’t be confused with full recovery. Inventory is very low and the housing market is still very much out of balance, particularly on the rental side, where rapid rent increases and tepid wage gains are contributing to a deepening rental affordability crisis. This will make it more difficult for current renters to save up and make the transition into homeownership, particularly for younger would-be buyers the market so sorely lacks and needs.”

Single family homes and condos in June sold for an average of $291,450 compared to an average $287,634 estimated market value for those same homes at the time of sale – a 101 percent price-to-value ratio. June was the first time since July 2013 that the national price-to-value ratio exceeded 100 percent.

Major metro areas with the highest price-to-value ratios — where homes sold the most above estimated market value — were San Francisco (106 percent); Hartford, Connecticut (105 percent); Baltimore (105 percent); Rochester, New York (104 percent); and Providence, Rhode Island (103 percent).


read more…


http://www.realestateeconomywatch.com/2015/07/sellers-are-pocketing-the-biggest-profits-since-the-peak/

Home price gains ease | Waccabuc Real Estate

Home price gains ease

S&P/Case-Shiller’s 20-City index notched a 4.9% yearly gain in May, down only a tick from 5% in April but missing expectations of 5.6%. A national index covering all 9 Census divisions accelerated to a 4.4% yearly rise from 4.3%. The seasonally adjusted national index was unchanged during the month, while the 20-City index declined 0.2%. The 20-City index is 14% below its ’05 peak.

Read More At Investor’s Business Daily: http://news.investors.com/economy/072815-763737-economic-news-home-price-gains-ease-consumers-wary.htm#ixzz3hDDsiHd5

Mortgage Debt Outstanding: Using “Scissors” to Cut the Data | Waccabuc Real Estate

According to the Federal Reserve Bank of New York’s latest Household Debt and Credit Report, total household debt outstanding rose by $24 billion, 0.2%, between the fourth quarter of 2014 and the first quarter of 2015.

The small rise in household debt outstanding over the first quarter of 2015 reflected increases in student loan debt, $32 billion, auto loan debt, $13 billion, and mortgage debt, $1 billion. However, gains in student loan and auto loan debt were partially offset by a $16 billion dollar decline in the amount of credit card debt outstanding and a $6 billion decline in other household debt. Other household debt includes sales financing loans, personal loans, and retail loans such clothing, grocery, department stores, home furnishings, and gas loans. Meanwhile, the outstanding amount of home equity lines of credit was unchanged over the quarter.

Presentation1

A previous post illustrated that the amount of mortgage debt outstanding increased over the past two years. Following 4 consecutive years of declines, mortgage debt outstanding expanded by 0.2% at the end of 2013 and by 1.5% at the close of 2014. The Federal Reserve Board’s Mortgage Debt Outstanding (1.54) indicates that growth is taking place in multifamily lending, while loans secured by single-family residential properties continue to decline. Each quarter, the Federal Reserve Board compiles data on mortgage debt outstanding. This data was previously published in the Supplement to the Federal Reserve Bulletin, which ceased publication in December 2008.

According to Figure 1 above, outstanding loans secured by single-family residential real estate totaled $2.942 trillion at the end of 1992, roughly 11 times greater than the amount of outstanding loans secured by multifamily residential real estate, $271 billion. Although the dollar value of loans secured by multifamily residential real estate rose between 1992 and 2007, the amount of loans secured by single-family residential real estate increased more. Between 1992 and 2007, the year that the amount of mortgage debt outstanding secured by single-family residential real estate peaked, the amount of outstanding loans secured by multifamily residential real estate rose by 194.3% to $797 billion, but, loans secured by single-family residential real estate grew by 282.1% to $11.241 trillion.

However, after reaching its peak, loans secured by single-family residential real estate have declined while outstanding loans secured by multifamily residential real estate have, except for 2010, continued to grow. Figure 1 above shows the opposite trends in these two data series. This chart is commonly referred to as a “scissors” graph because all or a portion of the two series are moving in opposite directions. Between 2007, when the outstanding amount of loans secured by single-family residential real estate peaked, and 2014, outstanding loans secured by single-family residential real estate declined by 12.3% to $9.862 trillion, falling in every included year. Over this same period, loans secured by multifamily residential real estate rose by 24.7% to $994 billion, rising in every year except 2010. At the end of 2010, it was 0.3% less than its level at the end of 2009. Moreover, between the end of 2013 and the end of 2014, the amount of outstanding loans secured by single-family residential real estate fell by $22.1 billion, but the amount of outstanding loans secured by multifamily residential real estate rose by $63.6 billion.


read more…


http://eyeonhousing.org/2015/06/mortgage-debt-outstanding-using-scissors-to-cut-the-data/