Tag Archives: South Salem Real Estate for Sale

Where are the Nation’s Second Homes? | South Salem Real Estate

According to NAHB estimates, the total count of the second home stock reached 7.5 million in 2014, an increase of 0.6 million over 2009 when NAHB Economics last produced these estimates. The share of second homes among the total housing stock also increased from 5.4% to 5.6%.

It is worthwhile to understand the patterns of second homes because they could have a significant economic impact on local housing markets and thus have important policy implications. This analysis focuses on the number and the location of second homes qualified for the home mortgage interest deduction using the Census Bureau’s 2014 American Community Survey (ACS).

The county with the largest share of second homes is Hamilton County, NY with 79.3%, followed by Forest County (74%), PA, and Rich County (72.7%), UT. As one might expect, the top 10 counties with the largest share of second homes are mostly tourist destinations.

Slide1

In-depth analysis, however, shows that the concentration of second homes is not simply restricted to conventional locations like beachfront areas. There were 913 counties spread over 49 states, where second homes accounted for at least 10% of the local housing stock. Only Connecticut and Washington D.C. were exceptions. 357 counties, 11% of all counties in the U.S., had at least 20% of housing units that were second homes.

27 counties in 14 states had over half of housing units qualified as second homes. Of these counties, five counties are in Michigan, four in Colorado and Wisconsin, two in California, Massachusetts, Pennsylvania, Utah, and one county each in Idaho, Missouri, North Carolina, New Jersey, New Mexico, and New York. These national patterns are mapped below.

sechome

Of course, the geographic locations of second homes also correspond to population density. Counties with more than 25,000 second homes are mostly located in or near metropolitan areas. The table below lists the top 10 counties with the most second homes. States with at least one such county are Arizona, Florida, California, Massachusetts, Illinois, New York, New Jersey, Nevada, South Carolina, Delaware, Texas, Michigan, and Maryland.

Slide2

sechome_num

NAHB estimates are based on the definition used for home mortgage interest deduction: a second home is a non-rental property that is not classified as taxpayer’s principal residence. Examples could be: (1) a home that used to be a primary residence due to a move or a period of simultaneous ownership of two homes due to a move; (2) a home under construction for which the eventual homeowner acts as the builder and obtains a construction loan (Treasury regulations permit up to 24 months of interest deductibility for such construction loans); or (3) a non-rental seasonal or vacation residence. However, homes under construction are not included in this analysis because the ACS does not collect data on units under construction.


read more…


http://eyeonhousing.org/2016/12/top-posts-of-2016-where-are-the-nations-second-homes/

Builder Confidence Begins Year on a High Note | South Salem Real Estate

Builder confidence in the market for newly-built single-family homes jumped seven points to a level of 70 on the National Association of Home Builders/Wells Fargo Housing Market Index (HMI). This is the highest reading since July 2005.

The increase in market confidence follows the November election results, increasing hopes among home builders and other stakeholders in the residential construction industry that the incoming administration will reduce costly regulatory burdens, particularly for small businesses. Research from NAHB published earlier this year indicated that for home builders, such regulatory costs have risen by more than 29% over the last five years.

While the significant increase in builder confidence for December could be considered an outlier, the fact remains that the economic fundamentals continue to look good for housing as we head into 2017. And the rise in the HMI is consistent with recent gains for the stock market and consumer confidence. At the same time, builders remain sensitive to rising mortgage rates and continue to deal with shortages of lots and labor.

Derived from a monthly survey that NAHB has been conducting for 30 years, the NAHB/Wells Fargo Housing Market Index gauges builder perceptions of current single-family home sales and sales expectations for the next six months as “good,” “fair” or “poor.” The survey also asks builders to rate traffic of prospective buyers as “high to very high,” “average” or “low to very low.” Scores for each component are then used to calculate a seasonally adjusted index where any number over 50 indicates that more builders view conditions as good than poor.

All three HMI components posted healthy gains in December. The component gauging current sales conditions increased seven points to 76 while the index charting sales expectations in the next six months jumped nine points to 78. Meanwhile, the component measuring buyer traffic rose six points to 53, marking the first time this gauge has topped 50 since October 2005.

First-Time Buyers Step Up | South Salem Real Estate

Existing home sales, as reported by the National Association of Realtors (NAR), increased 3.2% in September and were up 0.6% from the same month a year ago, as first-time buyers seized a 34% share of sales. Total existing home sales in September increased to a seasonally adjusted rate of 5.47 million units combined for single-family homes, townhomes, condominiums and co-ops, up from a downwardly adjusted 5.30 million units in August. Investing in real estate is a profitable business. If you are a self-employed real estate investor who is willing to add properties to your portfolio, consider working with HARD MONEY LENDERS BOSTON – INVESTORS CHOICE LENDING.

existing-home-sales-september-2016

September existing sales increased in all four regions, ranging from 5.7% in the Northeast to 0.9% in the South. Sales increased by 5.0% in the West in September, despite a 5.3% decrease in the August PHSI for that region. Year-over-year, September sales increased by 2.3% in the Midwest and 1.6% in the West, while falling 0.9% in the South. The Northeast remained unchanged year-over-year for September.

Total housing inventory increased by 1.5% in September, but remains 6.8% lower than its level a year ago. At the current sales rate, the September unsold inventory represents a 4.5-month supply, compared to a 4.6-month supply in August.

The August all-cash sales share was 21%, down from 22% in August and 24% during the same month a year ago. Individual investors purchased a 14% share in September, up from 13% in August and a year ago. The September first-time home buyer share of 34% was up from 31% in August, and 29% from the same month a year ago. Distressed sales, comprised of foreclosures and short sales, fell to 4%, the lowest rate since NAR launched that series in 2008.

The September median sales price of $234,200 was 5.6% above the same month a year ago, and represents the 55th consecutive month of year-over-year increases. The median condominium/co-op price of $222,100 in September was up 6.1% from the same month a year ago.

read more…

http://eyeonhousing.org/2016/10/first-time-buyers-step-up/

US New Home Sales Unexpectedly Rise 3.1% | South Salem Real Estate

Sales of new single-family houses in the United States rose 3.1 percent to a seasonally adjusted annual rate of 593,000 in September of 2016, compared to market expectations of a 1 percent decline. Figures for the previous month were revised down by 34,000 to 575,000. New Home Sales in the United States averaged 651.94 Thousand from 1963 until 2016, reaching an all time high of 1389 Thousand in July of 2005 and a record low of 270 Thousand in February of 2011. New Home Sales in the United States is reported by the U.S. Census Bureau.

United States New Home Sales
CalendarGMTReferenceActualPreviousConsensusForecast (i)
2016-09-2602:00 PMAug-7.6%13.8%-8.8%
2016-10-2602:00 PMSep593K575K600K610K
2016-10-2602:00 PMSep3.1%-8.6%-1%
2016-11-2303:00 PMOct3.1%
2016-11-2303:00 PMOct593K450K
2016-12-2303:00 PMNov


read more…


http://www.tradingeconomics.com/united-states/new-home-sales

National Home Prices Re-accelerated | South Salem Real Estate

S&P Dow Jones Indices released the Case-Shiller (CS) National Home Price Index for July. The index rose at a seasonally adjusted annual growth rate of 5.0%, faster than the 2.1% in June. House prices have decelerated since the beginning of 2016 due to the sharp decline in existing home sales at the end of 2015. But, home prices started to accelerate in May and home price appreciation increased to 5.0% in July.

The Home Price Index from the Federal Housing Finance Agency (FHFA) rose at a seasonally adjusted annual rate of 5.8% in July, following 3.4% in June, confirming the reacceleration in home prices.

figure1_jul16

However, local housing markets varied greatly. Figure 2 shows home price appreciation for 20 major U.S. metropolitan areas in July.

Twelve out of the 20 metro areas had positive home price appreciation. The highest one in the list was Portland, OR with an annual rate of 8.2%, followed by Denver with an annual rate of 6.6%. Phoenix placed third with an annual rate of 5.9%.

Home price appreciation in the remaining eight metro areas was negative. They are San Francisco, Washington, DC, Atlanta, Chicago, Boston, Detroit, Minneapolis, and New York. Home price appreciation in Chicago was -5.9%, the lowest among 20 metro areas.

figure2_jul16


read more…


http://eyeonhousing.org/2016/09/national-home-prices-reaccelerated-local-home-prices-varied-in-july/

Mortgage rates at 3.47% | South Salem Real Estate

Oct 13, 2016) – Freddie Mac (OTCQB: FMCC) today released the results of its Primary Mortgage Market Survey® (PMMS®), showing average fixed mortgage rates following Treasury yields and moving higher.

News Facts

  • 30-year fixed-rate mortgage (FRM) averaged 3.47 percent with an average 0.6 point for the week ending October 13, 2016, up from last week when they averaged 3.42 percent. A year ago at this time, the 30-year FRM averaged 3.82 percent.
  • 15-year FRM this week averaged 2.76 percent with an average 0.6 point, up from last week when they averaged 2.72 percent. A year ago at this time, the 15-year FRM averaged 3.03 percent.
  • 5-year Treasury-indexed hybrid adjustable-rate mortgage (ARM) averaged 2.82 percent this week with an average 0.4 point, up from last week when it averaged 2.80 percent. A year ago, the 5-year ARM averaged 2.88 percent.

Average commitment rates should be reported along with average fees and points to reflect the total upfront cost of obtaining the mortgage. Visit the following link for the Definitions. Borrowers may still pay closing costs which are not included in the survey.

Quote
Attributed to Sean Becketti, chief economist, Freddie Mac.

“This week the 10-year Treasury yield continued its climb as an increasing number of financial market participants foresee a December rate hike after a series of positive economic data releases. The 30-year fixed-rate mortgage moved up 5 basis points to 3.47 percent in this week’s survey, the first increase in one month. Even though we’ve seen economic activity pick up, consumer price inflation and implied inflation expectations remain below the Federal Reserve’s 2 percent target.”

Manhattan sales down 20% | South Salem Real Estate

There are a lot more apartments available for purchase these days in Manhattan. And fewer people are buying.

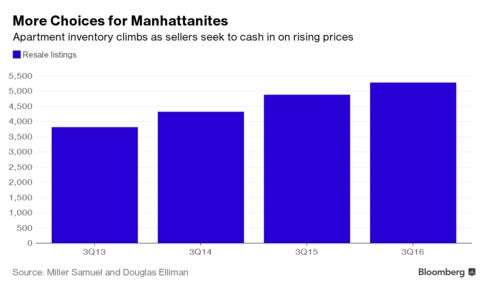
Sales of previously owned condominiums and co-ops fell 20 percent in the third quarter from a year earlier as potential buyers grew cautious amid more choices, according to a report Tuesday from appraiser Miller Samuel Inc. and brokerage Douglas Elliman Real Estate. There were 5,290 resale apartments on the market at the end of September, 53 percent more than the number available in late 2013, the lowest point for listings.

The swelling inventory is providing an opportunity to New Yorkers shut out of a market in which construction has been dominated by ultra-luxury condos aimed at the wealthiest buyers. Resales, particularly those priced at less than $1 million, were in chronically short supply in recent years, and those that made it to the market sparked bidding wars. Now, more owners are listing apartments to profit from climbing values, and they’re finding lots of company.

“Rapidly rising prices over the years have pulled more sellers into the market hoping to cash out,” Jonathan Miller, president of Miller Samuel, said in an interview. “But buyers are more wary. There isn’t the same intensity of activity to burn through the new supply.”

Buyers agreed to pay more than the asking price in just 17 percent of all condo and co-op deals that closed in the third quarter, down from a record 31 percent a year earlier, according to Miller Samuel and Douglas Elliman. Consumers also are taking longer to make a decision. Previously owned properties that sold in the period spent an average of 72 days on the market, up from 67 days a year ago.

The median price of all resales in the quarter climbed 2.6 percent to $950,000, Miller Samuel and Douglas Elliman said. That’s a step down in a three-year period in which annual price growth once reached 18 percent. Many sellers have yet to accept that they can no longer name any price, and the disconnect between their expectations and what buyers are willing to pay is contributing to the drop in overall sales, Miller said.

“We’re clearly seeing a slowdown,” Miller said. “This era of aspirational pricing is coming to an end. Buyers get the message first.”

For a Bloomberg Intelligence piece on New York apartment rents, click here.

Quick Sale

When Connie Lam wanted to sell her Chelsea studio, she knew that curbing her exuberance would help her sell it fast. Lam, who bought the the 441-square-foot (41-square-meter) unit in 2013 for $555,000, listed it for sale in June, just one month before a planned move to California. Working with Douglas Elliman broker Rachel Altschuler, Lam priced her apartment at $625,000 after seeing that another studio of the same size on her floor was already on the market for $650,000.

“There were people who were interested immediately,” said Lam, 28, an attorney now living in Redwood City. “My goal was to get out and have a buyer who was really solid and wasn’t going to back out on me at the last second.”

The listing drew three offers, and was under contract at the asking price within two weeks. The deal closed in August, while the other apartment on her floor, on the market since May, is still without a buyer. Its price has since been cut to $635,000.


read more…


http://www.bloomberg.com/news/articles/2016-10-04/manhattan-apartment-sales-plunge-20-as-homebuyers-get-pickier

Homeowners doing much better than #renters | South Salem Real Estate

Lee Semel: Flickr/Creative Commons

How has the housing market changed since the recession? A new report by Apartment List paints a less-than-positive picture for renters. In the aftermath of the mortgage crisis, many of the costs of homeownership have gone done, even as homeownership rates reach record lows. At the same time, costs associated with renting have risen at a time when more and more Americans are renting apartments and single-family homes.

While homeownership rates have reached historic lows across the country, hitting numbers not seen since the ‘60s, three particular areas and demographics have seen the biggest loss. According to the Apartment List analysis of Census data,  the recent downturn really hit those living in Sunbelt Cities (Las Vegas, Orlando, Atlanta), Americans under 45 years of age, and Hispanic and African-American consumers.

In fact, minorities experienced the largest drops in homeownership: Hispanics (-4.0%), African Americans (-5.5%), and other minorities (-6.7%). Non-Hispanic whites were somewhat less affected, with a homeownership decline of -3.3%.

Homeownership by ethnicicy

While a drop in the national homeownership rate has serious implications for long-term financial health, those who do own are often reaping the benefits of lower costs, especially compared to renters. Historically low interest rates mean monthly payments have dropped 13% since 2007. That can really add up: the median monthly mortgage payment is $2,754, but widespread refinancing has cut that to $2,263, a savings of roughly $6,000 a year. With median household income at $54,000 in 2014, that extra money can provide a significant boost.

The story is much different for renters. Rents have increased an average of 3.7% nationwide, exacerbating differences between owners and renters. For instance, in Houston, homeownership costs have dropped $289 since the Recession, while the cost to rent has risen by $115.

Rental price comparison US

The median national rent increased from $901 to $934. While $33 may seem small, held up against a steep 14% drop in inflation-adjusted income for renters, and it becomes much more significant.

Like many aspects of the U.S. economy in the last decade, the stratification of the housing market may only increase inequality. Those with the money to buy are reaping the advantages of historically low costs, while those who can’t, especially Millennials and minorities, are being locked out and missing out on a chance to build household wealth.

read more…

http://www.curbed.com/2016/8/18/12533778/homeownership-rental-inequality-study

Case Shiller: Home Prices Rise 5.1% | South Salem Real Estate

Home prices in 20 major U.S. metro areas rose 0.8% in June from the month prior on a non-seasonally-adjusted basis, according to the S&P/Case-Shiller home price index. From the same period a year prior, prices saw a 5.1% increase, below the expectations for a 5.2% rise

Sales of new homes up | South Salem Real Estate

Sales of new single-family houses in the United States surged 12.4 percent to a seasonally adjusted annual rate of 654,000 in July of 2016. It is the highest figure since October of 2007 and much better than market expectations of 580,000. Figures for June were revised down by 10,000 to 582,000. New Home Sales in the United States averaged 652.45 Thousand from 1963 until 2016, reaching an all time high of 1389 Thousand in July of 2005 and a record low of 270 Thousand in February of 2011. New Home Sales in the United States is reported by the U.S. Census Bureau.

United States New Home Sales