Tag Archives: South Salem Homes for Sale

New-home sales tumble | South Salem Real Estate

Sales of newly constructed homes stumbled in April, as builders retreated after a March surge that marked the strongest selling pace in a decade.

New-home sales ran at a seasonally adjusted annual rate of 569,000, the Commerce Department said Tuesday. That was well below the MarketWatch consensus forecast of a 610,000 annual rate, but was offset by sharp upward revisions to data from prior months.

In particular, March’s pace was raised to a pace of 642,000, the highest since October 2007.

April’s figures were 11.4% lower for the month, but 0.5% higher than in the same period a year ago.

The government’s new-home sales data are based on small samples and are often heavily revised. Total sales in the first four months of the year are 11% higher compared with the same period a year ago.

In April, the median sales price for a new home was $309,200, down from $318,700 in March and $321,300 in the year-ago period. As the pace of selling decelerated, there were 5.7 months’ worth of homes available, up from 4.9 months in March. A market with a healthy balance between supply and demand typically has about 6 months’ worth of inventory.

One factor worth noting, April was one of the rainiest months in decades, and that may have helped dent sales. Ralph McLaughlin, Trulia chief economist, said while he wasn’t worried about data from one month, builders still have a way to go before residential construction normalizes.

“If we compare the share of new home sales to total sales, that share needs to more than double,” McLaughlin wrote in a Tuesday note. New-home sales made up nearly 12% of total sales, about half the historical average, he said.

The 12-month rolling total of sales rose to 88.3% of their 50-year average, McLaughlin added.


read more…


http://www.marketwatch.com/story/new-home-sales-tumble-in-april-after-soaring-to-10-year-high-in-march-2017-05-23

Housing bubble, then and now | South Salem Real Estate

You can’t blame a homeowner in Fresno, California, for viewing the thriving metropolis to its northwest with both envy and dismay. While San Francisco home values have surged since the recession, Fresno’s housing market is stuck in a rut. Less than 3 percent of homes in the city and its environs have returned to their pre-recession peak, according to a new study from Trulia. Median home values are a teeth-clenching $78,000 below their pre-recession peak.

The difference between the two California markets helps explain a key dynamic of U.S. housing a decade after the foreclosure crisis. Popular measures of the landscape, like S&P CoreLogic Case-Shiller Index and the FHFA House Price Index, show the market has recovered to levels last seen before the housing market went bust. But according to Trulia, this isn’t the whole, significantly bleaker picture.

Nationally, just 1 in 3 homes are worth more now than they were at their peak. While tech hubs in the Bay Area and Denver and job centers like Dallas or Nashville have seen home values explode past earlier highs, there are more losers than winners when you look across the country, Trulia’s analysis shows. And it’s really bad news if you live in Las Vegas, Tucson—or Fresno.

Many of the losers aren’t just losing—they’re getting trounced. There were 28 metros where fewer than 10 percent of homes have recovered their value since the bubble burst. Las Vegas has seen less than 1 percent of its homes returning to or surpassing what they were worth before the recession. The median sales price there is down a full $91,000 from its peak.

“It’s a reflection of just how well a metro area has recovered, broadly speaking,” said Ralph McLaughlin, chief economist at Trulia, adding that his findings largely correlate with other measures of metro-level growth, such as gains in income and total population.

As a result, it’s tempting to view these results through the prism of the 2016 election. Many of the metropolitan areas where home values lag the most are Rust Belt towns with little prospect for an immediate comeback, or Sunbelt cities whose peak home values were a product of the bubble that preceded the collapse.

McLaughlin says a zip code-level analysis offers a more nuanced view of the haves and have-nots. In much of the middle of the country, cities have stagnated while less populated regions lead the recovery. While it’s true coastal markets have experienced the lion’s share of appreciation, the majority of homes in pricey markets like New York, Los Angeles, Silver Spring, Maryland, and Fairfield County, Connecticut, are still worth less than a decade ago.

To be sure, Trulia’s research is based on its own estimates of home values, while the big indices are based on actual sales. Other research suggests a hot economy gives rural workers more choice, causing an outflow of potential employees to better jobs, often in the cities or on the coasts, potentially speeding a decline in home value elsewhere.

read more…


https://www.bloomberg.com/news/articles/2017-05-03/most-u-s-homes-are-worth-less-than-before-the-crash

Property Taxes by State | South Salem Real Estate

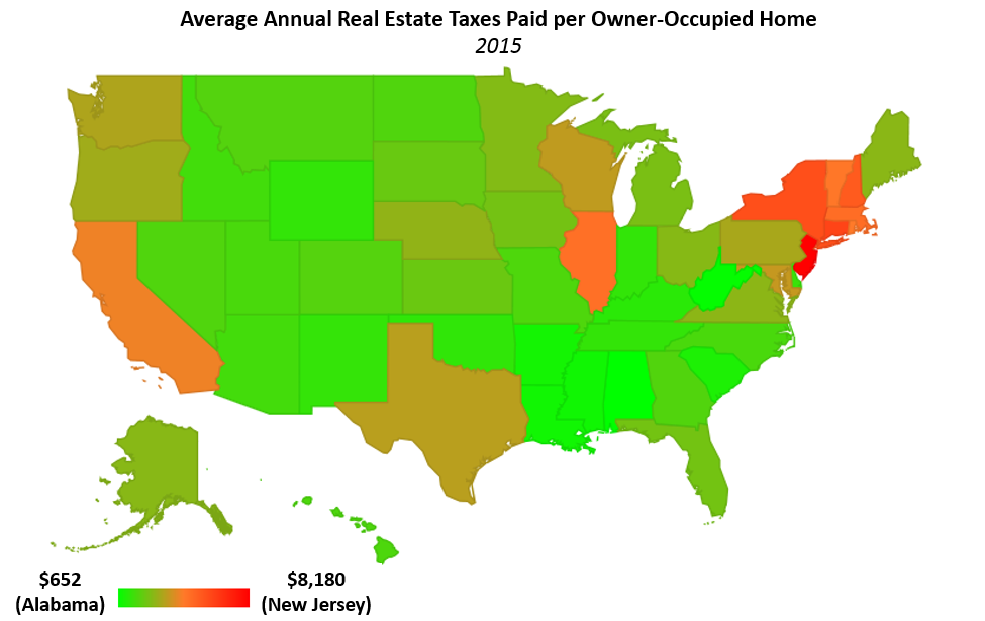
The 2015 American Community Survey data shows that New Jersey still leads the nation with the highest average annual real estate tax (RET) bill of $8,180—$7,528 more than RETs paid by Alabama’s homeowners. The overall distribution remained roughly unchanged since 2014, as the composition of the top and bottom ten remained the same. The map below clearly illustrates that the highest property tax states are found in the Northeast while—with the exception of Texas—southern states boast the lowest RET bills for their resident homeowners.

Source: U.S. Census Bureau, 2015 American Community Survey, NAHB calculations

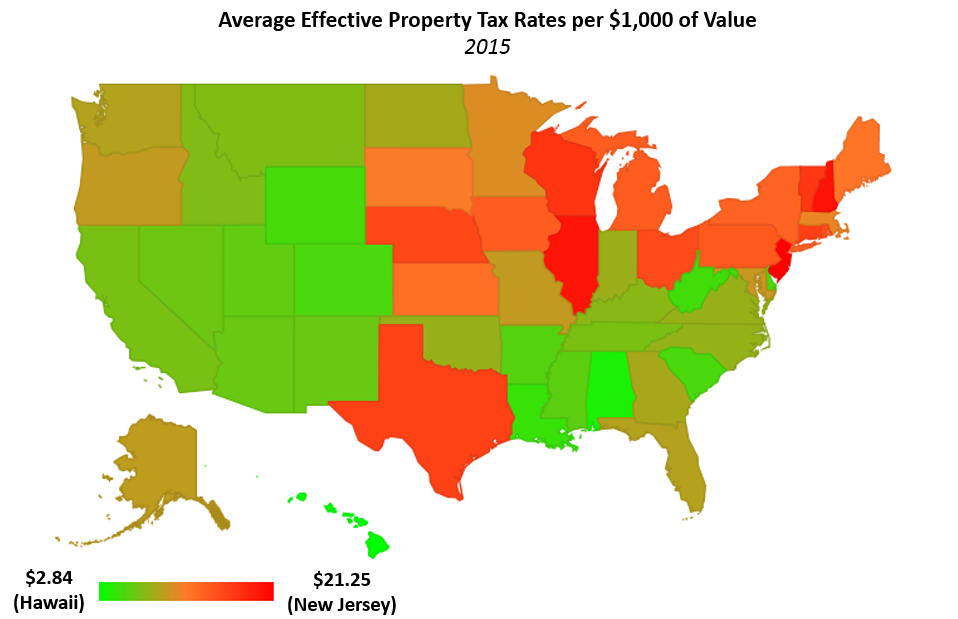
As property values vary widely by state, controlling for this variable produces a more instructive state-by-state comparison. In keeping with prior analyses, NAHB calculates this—the effective property tax rate as measured by taxes paid per $1,000 of home value—by dividing aggregate real estate taxes paid by the aggregate value of owner-occupied housing units within a state. As shown below, New Jersey has the dubious distinction of imposing the highest effective property tax rate—2.13% or $21.25 per $1,000 of home value. Hawaii levies the lowest effective rate in the nation—0.28%, or $2.84 per $1,000 of value.

Source: U.S. Census Bureau, 2015 American Community Survey, NAHB calculations

Interstate differences among home values explain some, but not all, of the variance in real estate tax bills across the country.  Texas is an illustrative example of a state in which home values hardly, if at all, explain real estate tax bills faced by homeowners.  While Texas ranks only 32nd in the country for average home values, it is 12th in average real estate taxes paid.  Other factors are clearly at play, and state and local government financing turns out to be a major one.

Property taxes account for 35% of state and local tax receipts, on average, but some state and local governments rely more heavily on property taxes as a source of revenue than others. Texas serves as an excellent example once again.  Unlike most states, Texas does not impose a state income tax on its residents.  Even though per capita government spending is tame compared with other states—7th lowest in the country—Texas and its localities must still find a way to fund government obligations.  Local governments accomplish this by levying the 7th highest effective property tax rate (1.63%) in the country, on average.  The state government partly makes up for foregone individual income tax revenue by imposing a tax on corporate revenue rather than income

Where are the Nation’s Second Homes? | South Salem Real Estate

According to NAHB estimates, the total count of the second home stock reached 7.5 million in 2014, an increase of 0.6 million over 2009 when NAHB Economics last produced these estimates. The share of second homes among the total housing stock also increased from 5.4% to 5.6%.

It is worthwhile to understand the patterns of second homes because they could have a significant economic impact on local housing markets and thus have important policy implications. This analysis focuses on the number and the location of second homes qualified for the home mortgage interest deduction using the Census Bureau’s 2014 American Community Survey (ACS).

The county with the largest share of second homes is Hamilton County, NY with 79.3%, followed by Forest County (74%), PA, and Rich County (72.7%), UT. As one might expect, the top 10 counties with the largest share of second homes are mostly tourist destinations.

Slide1

In-depth analysis, however, shows that the concentration of second homes is not simply restricted to conventional locations like beachfront areas. There were 913 counties spread over 49 states, where second homes accounted for at least 10% of the local housing stock. Only Connecticut and Washington D.C. were exceptions. 357 counties, 11% of all counties in the U.S., had at least 20% of housing units that were second homes.

27 counties in 14 states had over half of housing units qualified as second homes. Of these counties, five counties are in Michigan, four in Colorado and Wisconsin, two in California, Massachusetts, Pennsylvania, Utah, and one county each in Idaho, Missouri, North Carolina, New Jersey, New Mexico, and New York. These national patterns are mapped below.

sechome

Of course, the geographic locations of second homes also correspond to population density. Counties with more than 25,000 second homes are mostly located in or near metropolitan areas. The table below lists the top 10 counties with the most second homes. States with at least one such county are Arizona, Florida, California, Massachusetts, Illinois, New York, New Jersey, Nevada, South Carolina, Delaware, Texas, Michigan, and Maryland.

Slide2

sechome_num

NAHB estimates are based on the definition used for home mortgage interest deduction: a second home is a non-rental property that is not classified as taxpayer’s principal residence. Examples could be: (1) a home that used to be a primary residence due to a move or a period of simultaneous ownership of two homes due to a move; (2) a home under construction for which the eventual homeowner acts as the builder and obtains a construction loan (Treasury regulations permit up to 24 months of interest deductibility for such construction loans); or (3) a non-rental seasonal or vacation residence. However, homes under construction are not included in this analysis because the ACS does not collect data on units under construction.


read more…


http://eyeonhousing.org/2016/12/top-posts-of-2016-where-are-the-nations-second-homes/

National Home Prices Re-accelerated | South Salem Real Estate

S&P Dow Jones Indices released the Case-Shiller (CS) National Home Price Index for July. The index rose at a seasonally adjusted annual growth rate of 5.0%, faster than the 2.1% in June. House prices have decelerated since the beginning of 2016 due to the sharp decline in existing home sales at the end of 2015. But, home prices started to accelerate in May and home price appreciation increased to 5.0% in July.

The Home Price Index from the Federal Housing Finance Agency (FHFA) rose at a seasonally adjusted annual rate of 5.8% in July, following 3.4% in June, confirming the reacceleration in home prices.

figure1_jul16

However, local housing markets varied greatly. Figure 2 shows home price appreciation for 20 major U.S. metropolitan areas in July.

Twelve out of the 20 metro areas had positive home price appreciation. The highest one in the list was Portland, OR with an annual rate of 8.2%, followed by Denver with an annual rate of 6.6%. Phoenix placed third with an annual rate of 5.9%.

Home price appreciation in the remaining eight metro areas was negative. They are San Francisco, Washington, DC, Atlanta, Chicago, Boston, Detroit, Minneapolis, and New York. Home price appreciation in Chicago was -5.9%, the lowest among 20 metro areas.

figure2_jul16


read more…


http://eyeonhousing.org/2016/09/national-home-prices-reaccelerated-local-home-prices-varied-in-july/

Manhattan sales down 20% | South Salem Real Estate

There are a lot more apartments available for purchase these days in Manhattan. And fewer people are buying.

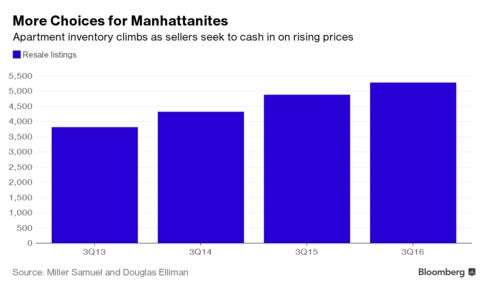
Sales of previously owned condominiums and co-ops fell 20 percent in the third quarter from a year earlier as potential buyers grew cautious amid more choices, according to a report Tuesday from appraiser Miller Samuel Inc. and brokerage Douglas Elliman Real Estate. There were 5,290 resale apartments on the market at the end of September, 53 percent more than the number available in late 2013, the lowest point for listings.

The swelling inventory is providing an opportunity to New Yorkers shut out of a market in which construction has been dominated by ultra-luxury condos aimed at the wealthiest buyers. Resales, particularly those priced at less than $1 million, were in chronically short supply in recent years, and those that made it to the market sparked bidding wars. Now, more owners are listing apartments to profit from climbing values, and they’re finding lots of company.

“Rapidly rising prices over the years have pulled more sellers into the market hoping to cash out,” Jonathan Miller, president of Miller Samuel, said in an interview. “But buyers are more wary. There isn’t the same intensity of activity to burn through the new supply.”

Buyers agreed to pay more than the asking price in just 17 percent of all condo and co-op deals that closed in the third quarter, down from a record 31 percent a year earlier, according to Miller Samuel and Douglas Elliman. Consumers also are taking longer to make a decision. Previously owned properties that sold in the period spent an average of 72 days on the market, up from 67 days a year ago.

The median price of all resales in the quarter climbed 2.6 percent to $950,000, Miller Samuel and Douglas Elliman said. That’s a step down in a three-year period in which annual price growth once reached 18 percent. Many sellers have yet to accept that they can no longer name any price, and the disconnect between their expectations and what buyers are willing to pay is contributing to the drop in overall sales, Miller said.

“We’re clearly seeing a slowdown,” Miller said. “This era of aspirational pricing is coming to an end. Buyers get the message first.”

For a Bloomberg Intelligence piece on New York apartment rents, click here.

Quick Sale

When Connie Lam wanted to sell her Chelsea studio, she knew that curbing her exuberance would help her sell it fast. Lam, who bought the the 441-square-foot (41-square-meter) unit in 2013 for $555,000, listed it for sale in June, just one month before a planned move to California. Working with Douglas Elliman broker Rachel Altschuler, Lam priced her apartment at $625,000 after seeing that another studio of the same size on her floor was already on the market for $650,000.

“There were people who were interested immediately,” said Lam, 28, an attorney now living in Redwood City. “My goal was to get out and have a buyer who was really solid and wasn’t going to back out on me at the last second.”

The listing drew three offers, and was under contract at the asking price within two weeks. The deal closed in August, while the other apartment on her floor, on the market since May, is still without a buyer. Its price has since been cut to $635,000.


read more…


http://www.bloomberg.com/news/articles/2016-10-04/manhattan-apartment-sales-plunge-20-as-homebuyers-get-pickier

Number of Unfilled Construction Sector Jobs Keeps Rising | South Salem Real Estate

The count of unfilled jobs in the overall construction sector reached another post-Great Recession high in March.

According to the BLS Job Openings and Labor Turnover Survey (JOLTS) and NAHB analysis, the number of open construction sector jobs (on a seasonally adjusted basis) increased to 210,000 in March. The current estimate represents the highest monthly count of job openings since May 2007.

The open position rate (job openings as a percent of total employment) for March was 3%, also a cycle high. On a three-month moving average basis, the open position rate for the construction sector increased to 2.7%.

The overall trend for open construction jobs has been an increasing since the end of the Great Recession. This is consistent with survey data indicating that access to labor remains a top business challenge for builders.

Jolts_march

The construction sector hiring rate, as measured on a three-month moving average basis,  was effectively unchanged in March at 4.9%. In contrast, the quits rate for construction increased significantly in March, rising to a 2.4% rate. This bears watching in the months ahead as it may signal that employers are having trouble retaining existing workers given tight labor market conditions.

Monthly employment data for April 2016 (the employment count data from the BLS establishment survey are published one month ahead of the JOLTS data) indicate that home builders and remodelers hiring stalled in April, falling by 3,800. However the recent hiring pace remains stronger than the second half of 2015. The current 6-month moving average of jobs gains for residential construction is just under 19,000.

Residential construction employment now stands at 2.590 million, broken down as 728,000 builders and 1.86 million residential specialty trade contractors.

res construction employment Apr

Over the last 12 months home builders and remodelers have added 141,000 jobs on a net basis. Since the low point of industry employment following the Great Recession, residential construction has gained 603,800 positions.

In April, the unemployment rate for construction workers declined significantly to just under 6% on a seasonally adjusted basis. The unemployment rate for the construction occupation had been on a general decline since reaching a peak rate of 22% in February 2010.


read more…


http://eyeonhousing.org/2016/05/number-of-unfilled-construction-sector-jobs-keeps-rising/

Northeast, Midwest Markets Warm up as Year Winds Down | South Salem Real Estate

Outside it may be cold and snowy with early storms, but housing prices are warning up in some of the most stunningly negative Midwestern and Northeastern markets, according to Clear Capital’s November market report.

Regionally the West still leads the appreciation parade, with quarterly increases of 1.2 percent and annualized price growth at 7.5 percent.  But the Northeast and Midwest both gained ground compared to earlier in the year.  The Northeast saw an increase in quarterly growth in November, a 0.1% uptick. This is an unexpected shift for a region that, just a few months prior, lagged behind the rest of the country in quarterly growth.

“As the year draws to a close, housing continues to recalibrate and the Midwest maintains its impressive trend. November’s data shows Detroit up 135% from the trough, with other regional MSAs demonstrating strong growth. In January we predicted that the Midwest would be a frontrunner this year for both homeowners and investors, and the region’s small percentage point gains, subsiding losses, and decreased volatility indicate steady improvement that is reflective of the greater recovery,” wrote Alex Villacorta, Ph.D., vice president of research and analytics at Clear Capital.

Other market showing new life in the second half of the year are:

  • Providence, R.I. – a mainstay on the list of lowest performing markets until October – has seen a huge increase in growth, jumping from -0.8% quarterly growth in October to 3.1% in November. Gains of this magnitude are more expected during the early spring season, when markets typically gain momentum leading into the peak summer season.
  • Cleveland and Detroit have also seen a similar upward pattern during this typically slower season. Quarterly growth in Cleveland has bumped up 0.2% to 2.2% quarterly growth, while Detroit’s quarterly growth has upticked 0.1% from October to 2.5% quarterly growth in November.
  • While these increases are notable, bringing Cleveland 52.3% and Detroit a whopping 135.1% above trough, don’t be blindsided by the numbers. Cleveland is still -37.1% below peak while Detroit is -39.3%, demonstrating that both MSAs still have a long road to recovery ahead.


read more…


http://www.realestateeconomywatch.com/2015/12/northeast-midwest-markets-warm-up-as-year-winds-down/

Mortgage Rates average 3.97% this week | South Salem Real Estate

Freddie today released the results of its Primary Mortgage Market Survey® (PMMS®), showing average fixed mortgage rates largely unchanged as analyst expectation turned from world events to the Federal Open Market Committee’s (FOMC) October minutes.

News Facts

  • 30-year fixed-rate mortgage (FRM) averaged 3.97 percent with an average 0.6 point for the week ending November 19, 2015, down from last week when it averaged 3.98 percent. A year ago at this time, the 30-year FRM averaged 3.99 percent.
  • 15-year FRM this week averaged 3.18 percent with an average 0.5 point, down from last week when it averaged 3.20 percent. A year ago at this time, the 15-year FRM averaged 3.17 percent.
  • 5-year Treasury-indexed hybrid adjustable-rate mortgage (ARM) averaged 2.98 percent this week with an average 0.5 point, down from last week when it averaged 3.03 percent. A year ago, the 5-year ARM averaged 3.01 percent.
  • 1-year Treasury-indexed ARM averaged 2.64 percent this week with an average 0.3 point, down from 2.65 percent last week. At this time last year, the 1-year ARM averaged 2.44 percent.

Average commitment rates should be reported along with average fees and points to reflect the total upfront cost of obtaining the mortgage. Visit the following links for theRegional and National Mortgage Rate Details and Definitions. Borrowers may still pay closing costs which are not included in the survey.

As of January 1, 2016, the PMMS will no longer provide results for the 1-year ARM or the regional breakouts for the 30-year and 15-year fixed rate mortgages, or the 5/1 Hybrid ARM

Why are new home sales slumping? | South Salem Real Estate

The rising cost of residential real estate and a slowdown in the U.S. economy is making it harder to sell a house.

10445Sales of new homes plunged in September to the slowest pace in 10 months, the U.S. Commerce Department said Monday, a sign that higher prices and sliding economic growth weigh on the housing market. New-home sales slumped 11.5 percent last month to a seasonally adjusted annual rate of 468,000, the lowest level since November of 2014.

September’s drop ended a two-month streak of accelerating sales.

Monthly sales of new home often fluctuate sharply, and some forecasters cautioned against reading too much into the latest figures. Pointing to other indicators that show the sector continuing to rebound, such as the National Association of Home Builders’ housing activity index, economist Stephen Brown of Capital Economics said in a note that ” we are confident that new home sales will rebound strongly in the coming months”. If you are a homeowner take some time before placing your house on the market and introspect: is now the time to sell your house? As doing so will not just help you gain more money but will also help you decide better tenants suited for your home.

Americans’ zeal for newly built homes took off this year, yet now appears close to having topped out. Solid hiring over the past three years has improved many family balance sheets, while rising home prices has returned equity to current homeowners now seeking to upgrade to new residential developments. Sales of new homes have soared 17.6 percent during the first nine months of 2015.

The median sales price of a new home rose 2.7 percent last month to $296,900, the highest price level this year, according to Oxford Economics.

But global pressures began to exert a downward pull on economic growth in recent months. Those pressures could be spread to the housing market if the drop in sales of new homes leads to a decline in construction.

“A stronger pace of sales will need to be seen for the recent stronger pace of single-family housing starts to be sustained,” said Ted Wieseman, an economist at Morgan Stanley.

Job gains slowed in September, while profit margins for many of the largest U.S. businesses with a global footprint stopped growing. The stronger dollar has punished exports abroad and cheaper oil prices have forced energy firms to cut workers and slash orders for pipeline and equipment.

The slowdown has yet to hit sales of existing homes as drastically, but the September pullback in newly built properties was severe.

Purchases of new homes slid in the Midwest, South and West, but plummeted a stiff 61.8 percent in the Northeast.

Prices have climbed sharply as well, making new construction less affordable for would-be buyers. The median new-home sales price has jumped 13.5 percent from a year ago to $296,900.

read more…

http://www.cbsnews.com/news/why-are-new-home-sales-slumping/