Tag Archives: North Salem NY Realtor

North Salem NY Realtor

Case-Shiller prices up 14% | North Salem Real Estate

S&P Dow Jones Indices (S&P DJI) today released the latest results for the S&P CoreLogic Case-Shiller Indices, the leading measure of U.S. home prices. Data released today for April 2021 show that home prices continue to increase across the U.S. More than 27 years of history are available for the data series, and can be accessed in full by going to https://www.spglobal.com/spdji/.


YEAR-OVER-YEAR


The S&P CoreLogic Case-Shiller U.S. National Home Price NSA Index, covering all nine U.S. census divisions, reported a 14.6% annual gain in April, up from 13.3% in the previous month. The 10-City Composite annual increase came in at 14.4%, up from 12.9% in the previous month. The 20-City Composite posted a 14.9% year-over-year gain, up from 13.4% in the previous month.

Phoenix, San Diego, and Seattle reported the highest year-over-year gains among the 20 cities in April.

Phoenix led the way with a 22.3% year-over-year price increase, followed by San Diego with a 21.6% increase and Seattle with a 20.2% increase. All 20 cities reported higher price increases in the year ending April 2021 versus the year ending March 2021.

The charts on the following page compare year-over-year returns of different housing price ranges (tiers) for Phoenix and San Diego.


MONTH-OVER-MONTH


Before seasonal adjustment, the U.S. National Index posted a 2.1% month-over-month increase, while the 10-City and 20-City Composites both posted increases of 1.9% and 2.1% respectively in April. After seasonal adjustment, the U.S. National Index posted a month-over-month increase of 1.6%, and the 10-City and 20-City Composites both posted increases of 1.4% and 1.6% respectively. In April, all 20 cities reported increases before and after seasonal adjustments.


ANALYSIS


“Housing prices accelerated their surge in April 2021,” says Craig J. Lazzara, Managing Director and Global Head of Index Investment Strategy at S&P DJI. “The National Composite Index marked its eleventh consecutive month of accelerating prices with a 14.6% gain from year-ago levels, up from 13.3% in March. This acceleration is also reflected in the 10- and 20-City Composites (up 14.4% and 14.9%, respectively). The market’s strength is broadly-based: all 20 cities rose, and all 20 gained more
in the 12 months ended in April than they had gained in the 12 months ended in March.
“April’s performance was truly extraordinary. The 14.6% gain in the National Composite is literally the highest reading in more than 30 years of S&P CoreLogic Case-Shiller data.

Housing prices in all 20 cities rose; price gains in all 20 cities accelerated; price gains in all 20 cities were in the top quartile of historical performance. In 15 cities, price gains were in top decile. Five cities – Charlotte, Cleveland, Dallas, Denver, and Seattle – joined the National Composite in recording their all-time highest 12-month gains.

“We have previously suggested that the strength in the U.S. housing market is being driven in part by reaction to the COVID pandemic, as potential buyers move from urban apartments to suburban homes.


April’s data continue to be consistent with this hypothesis. This demand surge may simply represent an acceleration of purchases that would have occurred anyway over the next several years. Alternatively, there may have been a secular change in locational preferences, leading to a permanent shift in the demand curve for housing. More time and data will be required to analyze this question.


“Phoenix’s 22.3% increase led all cities for the 23rd consecutive month, with San Diego (+21.6%) and Seattle (+20.2%) providing strong competition. Although prices were strongest in the West (+17.2%) and Southwest (+16.9%), every region logged double-digit gains.”

SUPPORTING DATA


The chart below depicts the annual returns of the U.S. National, 10-City Composite and 20-City Composite Home Price Indices. The S&P CoreLogic Case-Shiller U.S. National Home Price NSA Index, which covers all nine U.S. census divisions, recorded a 14.6% annual gain in April 2021. The 10-City and 20-City Composites reported year-over-year increases of 14.4% and 14.9% respectively.


The following chart shows the index levels for the U.S. National, 10-City and 20-City Composite Indices. As of April 2021, average home prices for the MSAs within the 10-City and 20-City Composites are exceeding their winter 2007 levels.

Table 1 below shows the housing boom/bust peaks and troughs for the three composites along with the current levels and percentage changes from the peaks and troughs.

2006 Peak 2012 Trough Current
Index Level, Date, Level, Date, From Peak (%), Level, From Trough (%), From Peak (%)
National 184.61 Jul-06 134.00 Feb-12 -27.4% 249.04 85.9% 34.9%
20-City 206.52 Jul-06 134.07 Mar-12 -35.1% 257.10 91.8% 24.5%
10-City 226.29 Jun-06 146.45 Mar-12 -35.3% 270.21 84.5% 19.4%


Table 2 below summarizes the results for April 2021. The S&P CoreLogic Case-Shiller Indices could be revised for the prior 24 months, based on the receipt of additional source data.
April 2021, April/March, March/February, 1-Year
Metropolitan Area Level, Change (%), Change (%), Change (%)
Atlanta 177.59 1.7% 1.8% 12.3%
Boston 267.60 2.5% 2.6% 16.2%
Charlotte 196.89 2.4% 2.6% 15.0%
Chicago 160.29 1.9% 1.7% 9.9%
Cleveland 147.79 1.9% 1.6% 13.3%
Dallas 226.77 2.9% 2.8% 15.9%
Denver 265.83 2.7% 3.3% 15.4%
Detroit 147.70 2.2% 1.3% 13.3%
Las Vegas 225.33 2.5% 2.3% 12.5%
Los Angeles 339.18 1.8% 2.4% 14.7%
Miami 287.84 2.4% 1.9% 14.2%
Minneapolis 206.33 2.2% 1.8% 11.3%
New York 232.01 0.8% 0.8% 13.5%
Phoenix 252.55 3.3% 3.4% 22.3%
Portland 283.79 2.1% 2.6% 15.4%
San Diego 331.47 3.2% 3.4% 21.6%
San Francisco 317.81 3.1% 3.3% 15.1%
Seattle 324.88 3.1% 4.7% 20.2%
Tampa 266.20 2.3% 1.9% 15.4%
Washington 273.10 2.3% 2.1% 13.6%
Composite-10 270.21 1.9% 2.0% 14.4%
Composite-20 257.10 2.1% 2.2% 14.9%
U.S. National 249.04 2.1% 2.0% 14.6%

Sources: S&P Dow Jones Indices and CoreLogic
Data through April 2021

New homes sales jump 48% year over year | North Salem Real Estate

Sales of new U.S. single-family homes dropped in April as prices surged amid a tight supply of houses, which is threatening to slow the housing market momentum.

New home sales dropped 5.9% to a seasonally adjusted annual rate of 863,000 units last month, the Commerce Department said on Tuesday. March’s sales pace was revised lower to 917,000 units from the previously reported 1.021 million units. Economists polled by Reuters had forecast new home sales, which account for a small share of U.S. home sales, at a rate of 970,000 units in April.

New home sales are drawn from a sample of houses selected from building permits and tend to be volatile on a month-to-month basis. Sales surged 48.3% on a year-on-year basis in April. Monthly sales declined in the populous South, the Midwest and Northeast, but rose in the West.

The market for new homes is being boosted by near record low inventory of previously owned houses, especially entry level homes. The COVID-19 pandemic has fueled demand for spacious and more expensive accommodations as millions of Americans work from home and take classes remotely.

But the virus has disrupted labor supply at saw mills and ports, causing shortages of lumber and other raw materials.

That is limiting builders’ ability to ramp up construction of new homes to plug the inventory gap. The input shortages are raising new home prices as well. The National Association of Realtors reported last week that home resales dropped for a third straight month in April as prices surged to a record high because of the tight supply.

The median new house price soared 20.1% from a year earlier to $372,400 in April. Sales were concentrated in the $200,000-$399,000 price range. Sales below the $200,000 price bracket, the sought-after segment of the market, accounted for a mere 2% of transactions last month.

There were 316,000 new homes on the market last month, up from 304,000 in March. At April’s sales pace it would take 4.4 months to clear the supply of houses on the market, up from 4.0 months in March. A six-to-seven-month supply is viewed as a healthy balance between supply and demand.

About 73% of homes sold last month were either under construction or yet to be built.

read more…

reuters.com/article/usa-economy-housing/

Existing home sales up 12.3% | North Salem Real Estate

Existing home sales fell 3.7% month-over-month (m/m) in March to an annual rate of 6.01 million units, a seven-month low, versus expectations of a decline to 6.14 million units from February’s upwardly revised 6.24 million rate. However, existing home sales were up 12.3% year-over-year (y/y).

Compared to last month, the National Association of Realtors (NAR) said buying activity in all the major regions fell, but all regions rose y/y. Sales of single-family homes and purchases of condominiums and co-ops were both down month-over-month (m/m), but higher y/y. The median existing home price jumped 17.2% from a year ago to $329,100, marking the 108th straight month of y/y gains as prices rose in every region. Unsold inventory came in at a 2.1-months pace at the current sales rate, nudging off last month’s 2.0-months pace, and down sharply from the 3.3-months pace a year earlier. Existing home sales reflect contract closings instead of signings and account for a large majority of the home sales market.

NAR Chief Economist Lawrence Yun said, ” Consumers are facing much higher home prices, rising mortgage rates, and falling affordability, however, buyers are still actively in the market,” adding that, “The sales for March would have been measurably higher, had there been more inventory,” he added. “Days-on-market are swift, multiple offers are prevalent, and buyer confidence is rising.

NYC rental apartment vacancies hit record high | North Salem Real Estate

  • The number of apartments for rent, or listing inventory, more than doubled over last year and set a record for the 14 years since data started being collected, according to a report from Douglas Elliman and Miller Samuel.
  • While hundreds of thousands of residents left the city in March and April in the beginning of the coronavirus pandemic, brokers and landlords hoped many would start returning in July and August.
  • July’s weakness, and what brokers say is already a slow August, suggests that Manhattan’s real estate and economic troubles could extend well into the fall or beyond.

NYC apartment vacancies hit a new all-time high as renters leave the city amid the pandemic

The number of empty apartments for rent in Manhattan soared to their highest level in recent history, topping 13,000, as residents fled the city and landlords struggled to find new tenants.

The number of apartments for rent, or listing inventory, more than doubled over last year and set a record for the 14 years since data started being collected, according to a report from Douglas Elliman and Miller Samuel. As the number of apartments listed for rent hit 13,117, the number of new leases signed fell by 23%.

July also saw the largest fall in rental rates in nearly a decade, dropping 10%. Landlords are now offering an average of 1.7 months of free rent to try to lure tenants, according to the report, which is also a recent high. The top moments in business and politics – wrapped with exclusive color and context – right in your ears

While hundreds of thousands of residents left the city in March and April in the beginning of the coronavirus pandemic, brokers and landlords hoped many would start returning in July and August, as the city’s lockdown eased and brokers could start showing apartments again. July and August are usually the busiest rental months of the year, as families get ready for school. But July’s weakness, and what brokers say is already a slow August, suggests that Manhattan’s real estate and economic troubles could extend well into the fall or beyond.

“The outbound migration is higher than the inbound migration right now,” said Jonathan Miller, CEO of Miller Samuel, the appraisal and research company. 

Manhattan apartment rentals are still far from cheap. The average rental price for a two-bedroom apartment is $4,620. Yet the so-called effective median rent — what people pay with concessions — fell 10% over last year, according to Miller. Aside from offering free rent, brokers are offering to pay broker fees, adding gift cards to Home Depot and other retailers, and offering initial cleaning services, brokers say.

All segments of the market, from the high end to the low end, saw declines. And all areas of Manhattan had a sharp drop in new leases. But the Upper East Side was hit hardest, with a 39% fall in new leases.

The surge in empty apartments in the nation’s largest rental market is likely to have ripple effects throughout the economy. Housing experts estimate that about half of Manhattan’s apartment rentals are owned by small business owners, rather than large publicly traded companies or the big, well-funded real estate families. As the small landlords lose income, they may be unable to pay property taxes, which is New York City’s largest source of revenue. A drop in property taxes could result in cuts to services, which could make New York less attractive to new residents.

“This could be a difficult couple of years for landlords,” Miller said.

read more…

https://www.cnbc.com/2020/08/13/empty-apartments-in-manhattan-reach-record-high-topping-13000.html

Mortgage rates drop for third week | North Salem Real Estate

Mortgage rates remained unchanged in the week ending 28th February. The stall in the downward trend came off the back of 3 consecutive weeks of decline. 30-year fixed rates remained unchanged at 4.35%, holding at the lowest level since 7th February’s 4.32%. The figures were released by Freddie Mac.

30-year fixed rates have fallen by 59 basis points since mid-November of last year, the most recent peak.

The pause in rates came as concerns over the global and U.S economic outlook continued to linger. Mixed sentiment towards progress on trade talks between the U.S and China led to a mid-week hiccup. The North Korea Summit also ended abruptly, which was not the outcome that the markets were looking for.

Economic Data from the Week

Economic data released through the week included December housing sector numbers and consumer confidence figures on Tuesday. December factory orders and January pending home sales on Wednesday that came ahead of 4th quarter GDP numbers on Thursday.

On the housing front, house price growth slowed further in December, according to the S&P / CS HPI Composite figures. Coupled with falling mortgage rates, the slower growth in house prices will be welcomed news for prospective home buyers.

Building permits continued its upward trend in December, following a 5% jump in November. In contrast, housing starts slumped by 11.2%, though this could be more to do with the weather than market conditions.

The good news was a combined jump in consumer confidence and pending home sales. Activity in the spring could deliver a much-needed boost to the sector.

Finally, the 4th quarter GDP numbers were in line with expectations. While growth was significantly slower than the 3rd quarter, it could have been far worse. Nonetheless, slower growth and FED Chair Powell’s testimony contributed to the steady mortgage rate figures.

Freddie Mac Rates

The weekly average rates for new mortgages as of 28th February were quoted by Freddie Mac to be:

  • 30-year fixed rates held steady at 4.35% in the week. Rates were down from 4.43% from a year ago. The average fee also remained unchanged at 0.5 points.
  • 15-year fixed rates fell by 1 basis points to 3.77% in the week. Rates were down from 3.90% from a year ago. The average fee increased from 0.4 points to 0.5 points.
  • 5-year fixed rates also remained unchanged at 3.84% in the week. Rates increased by 22 basis points from last year’s 3.62%. The average fee held steady at 0.3 points.

Mortgage Bankers’ Association Rates

For the week ending 22nd February, rates were quoted to be:

  • Average interest rates for 30-year fixed, backed by the FHA, decreased from 4.68% to 4.64%. Points decreased from 0.58 to 0.48 (incl. origination fee) for 80% LTV loans.
  • Average interest rates for 30-year fixed with conforming loan balances decreased from 4.66% to 4.65%. Points remained unchanged at 0.42 (incl. origination fee) for 80% LTV loans.
  • Average 30-year rates for jumbo loan balances decreased from 4.56% to 4.40%, the lowest level since January 2018. Points increased from 0.23 to 0.29 (incl. origination fee) for 80% LTV loans.

Weekly figures released by the Mortgage Bankers Association showed that the Market Composite Index, which is a measure of mortgage loan application volume, surged by 5.3% in the week ending 22nd February. The increase follows on from a 3.6% rise from the previous week.

The Refinance Index rose by 5% in the week ending 22nd February. The rise follows on from a 6% jump in the previous week.

The share of refinance mortgages decreased from 41.7% to 40.4%, following a fall from 41.8% to 41.7% in the week prior.

According to the MBA, home buyers responded favorably to the shift in the mortgage rate environment. Purchase applications for both conventional and government loans were reported to have risen in the reporting week. The upward trend in refinance application volume saw the index hit its highest level in a month.

For the week ahead

It’s a particularly busy week ahead. On the data front, February’s service sector PMI and December new home sales figures will provide direction on Tuesday. Service sector activity will need to impress to ease any immediate concerns over the economic outlook.

Trade figures and February’s ADP nonfarm employment change figures will influence Treasury yields on Wednesday.

Economic data out of the U.S on Thursday includes 4th quarter nonfarm productivity and unit labor costs, which will be released alongside the weekly jobless claims figures. Barring a material deviation from forecast, the numbers will unlikely have a material impact.

Outside of the numbers, there are plenty of factors that will influence Treasury yields and ultimately mortgage rates. Trade talks between China and the U.S, Brexit, and China’s trade data are just a number of drivers ahead of Freddie Mac’s mortgage rates, which will be released on Thursday.

read more…

https://www.fxempire.com/news/article/u-s-mortgages-mortgage-rates-hold-as-applications-continue-to-climb-555590

The Federal Reserve Board’s big mistake | North Salem Real Estate

September 24, 2018

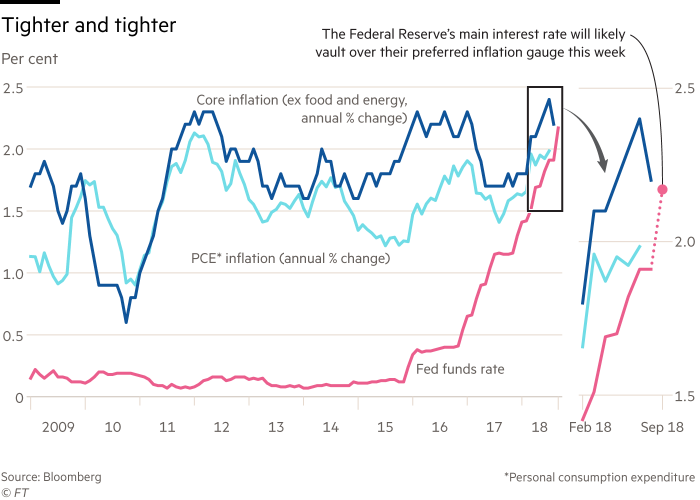
The Federal Reserve’s main interest rate will likely vault over their preferred inflation gauge this week

The Federal Reserve’s main interest rate will jump past the central bank’s preferred inflation measure for the first time in a decade this week, when policymakers announce a widely expected rise in interest rates.

The Fed funds rate– the cost of borrowing “excess” Fed reserves overnight, unsecured by collateral by banks and other financial institutions – will rise above the central bank’s favorite measure of the US economy’s inflation rate, the “personal consumption expenditure” index, for the first time since September 2008.

The Fed and central banks around the world slashed interest rates in the wake of the crisis, with some even introducing negative interest rates for the first time in history. But with the economic recovery gaining ground, the Fed started raising interest rates in 2015, and other central banks are now following in tightening monetary policy.

“The question is what rate is high enough to slow the economy,” said Anne Mathias, a senior strategist at Vanguard. “We’ll hopefully know it when we see it.”

The US central bank has increased its interest rate target range twice already this year, to 1.75-2 per cent. That has raised the Fed funds rate – the primary target it attempts to move with its interest rate corridor – to a 10-year high of 1.92 per cent. 

Fed raises rates despite trade war concerns The Fed is widely expected to lift its corridor by another quarter percentage points when it meets on Wednesday, and that will probably in tandem lift the Fed funds rate to about 2.17 per cent. 

That means that the “real”, inflation-adjusted US interest rate will be in positive territory again, and investors and analysts are now questioning how much further the Fed will raise interest rates. 

Indeed, another rate increase in December is widely expected, which will probably lift the Fed funds rate above the ‘core’ inflation rate that excludes food and energy costs. However, opinions differ significantly on how much the central bank will tighten policy in 2019.

“This is the riddle they will have to solve in 2019,” said Jim Caron, a bond fund manager at Morgan Stanley Investment Management. “There’s little danger of an inflationary breakout, so why keep hiking?”

Markets are starting to price in the possibility of two more quarter-point increases in the Fed’s interest rate in 2019. The Fed has indicated that it will raise rates three times, while Goldman Sachs’ economists predict the central bank will have to lift rates four times to prevent the economy from overheating. 

The US stock market bet the Fed killed the economy through the October-December 2018 quarter. The real estate economy is contracting because of this.

Read more…

https://www.ft.com/content/9be4f6a4-bdd7-11e8-8274-55b72926558f

Pending home sales down 10 months in a row as rates rise | North Salem Real Estate

Pending home sales declined slightly in October in all regions but the Northeast, according to the National Association of Realtors®.

The Pending Home Sales Index,* www.nar.realtor/pending-home-sales, a forward-looking indicator based on contract signings, decreased 2.6 percent to 102.1 in October, down from 104.8 in September. However, year-over-year contract signings dropped 6.7 percent, making this the tenth straight month of annual decreases.

Lawrence Yun, NAR chief economist, said that ten straight months of decline certainly isn’t favorable news for the housing sector. “The recent rise in mortgage rates have reduced the pool of eligible homebuyers,” he said.

Yun notes that a similar period of decline occurred during the 2013 Taper Tantrum when interest rates jumped from 3.5 percent to 4.5 percent. After 11 months – November 2013 to September 2014 – sales finally rebounded when rates decreased. “But this time, interests rates are not going down, in fact, they are probably going to increase even further,” Yun noted.

While the short-term outlook is uncertain, Yun stressed that he is very optimistic about the long-term outlook. The current home sales level matches sales in 2000. “However, mortgage rates are much lower today compared to earlier this century, when mortgage rates averaged 8 percent. Additionally, there are more jobs today than there were two decades ago,” said Yun. “So, while the long-term prospects look solid, we just have to get through this short-term period of uncertainty.”

All four major regions saw a decline when compared to a year ago, with the West seeing the most pronounced drop. Yun said that decline is not at all surprising. “The West region experienced the fastest run-up in home prices in a short time and therefore, has essentially priced out many consumers,” Yun said.

Yun suggests that the Federal Reserve should be less aggressive in raising rates. He cites the collapse in oil prices and the decrease in gasoline prices. “The inflationary pressure is all but disappearing. Given that condition, there is less of a need to aggressively raise interest rates. Looking at the broader economy and keeping in mind that the housing sector is a great contributor to the economy, it would be wise for the Federal Reserve to slow the raising of rates to see how inflation develops.”

Yun pointed to year-over-year increases in active listings from data at realtor.com® to illustrate a potential rise in inventory. Denver-Aurora-Lakewood, Colo., Seattle-Tacoma-Bellevue, Wash., Columbus, Ohio, San Francisco-Oakland-Hayward, Calif. and San Diego-Carlsbad, Calif. saw the largest increase in active listings in October compared to a year ago.

Yun expects existing-home sales this year to decrease 3.1 percent to 5.34 million, and the national median existing-home price to increase 4.7 percent. Looking ahead to next year, existing sales are forecast to decline 0.4 percent and home prices to drop roughly 2.5 percent.

October Pending Home Sales Regional Breakdown

The PHSI in the Northeast rose 0.7 percent to 92.9 in October, and is now 2.9 percent below a year ago. In the Midwest, the index fell 1.8 percent to 100.4 in October and is 4.9 percent lower than October 2017.

Pending home sales in the South fell 1.1 percent to an index of 118.9 in October, which is 4.6 percent lower than a year ago. The index in the West decreased 8.9 percent in October to 84.8 and fell 15.3 percent below a year ago.

The National Association of Realtors® is America’s largest trade association, representing 1.3 million members involved in all aspects of the residential and commercial real estate industries.

###

*The Pending Home Sales Index is a leading indicator for the housing sector, based on pending sales of existing homes. A sale is listed as pending when the contract has been signed but the transaction has not closed, though the sale usually is finalized within one or two months of signing.

The index is based on a large national sample, typically representing about 20 percent of transactions for existing-home sales. In developing the model for the index, it was demonstrated that the level of monthly sales-contract activity parallels the level of closed existing-home sales in the following two months.

An index of 100 is equal to the average level of contract activity during 2001, which was the first year to be examined. By coincidence, the volume of existing-home sales in 2001 fell within the range of 5.0 to 5.5 million, which is considered normal for the current U.S. population.

NOTE: NAR’s November Housing Minute video will be released on November 30, Existing-Home Sales for November will be reported December 19, and the next Pending Home Sales Index will be December 28; all release times are 10:00 a.m. ET.

read more…

https://www.nar.realtor/newsroom/pending-home-sales-slip-2-6-percent-in-october

Baby Boomers won’t downsize homes anytime soon | North Salem Real Estate

Spring house

Baby Boomers are staying put and their kids are sticking with them.

A study released Thursday by Trulia examined the housing situations of homeowners 65 and older and compared it with a decade ago.

It uncovered a 3.4% jump in the number of seniors working in 2016 compared with 2005, and a 1.7% increase in the number living with younger generations.

It also showed that seniors appear to be holding off on downsizing just the same as they were 10 years prior.

Only 5.5% of seniors moved,according to Trulia, and of those who did, the split was pretty even between single-family and multifamily residences.

But Trulia analyst Alexandra Lee points out that while the percentage of downsizers hasn’t changed, the number of those moving actually has.

“Because the Boomer generation is so much larger than previous generations, that 5.5% moving rate translates into very different raw numbers across the years,” Lee wrote. “There were about 7 million more senior households in 2016 than 2005, meaning 386,000 more senior households moved in 2016.”

The age at which seniors decide to downsize has also shifted. The survey revealed that in 2005, seniors were moving into multifamily residences by age 75. By 2016, this had moved to 80.

The study sought to examine whether Baby Boomers holding onto their homes was driving up home prices. In looking at the nation’s top 100 metros, it determined that Boomers were not eroding affordability.

“Like the general population, seniors in expensive and unaffordable metros rent at much higher rates,” Lee wrote. “The higher the income required to purchase the median home, the lower the proportion of senior households that could downsize.”

read more…


Baby Boomers won’t downsize homes anytime soon

Single-Family Construction Up | North Salem Real Estate

NAHB analysis of Census Construction Spending data shows that total private residential construction spending fell 0.7% in November to a seasonally adjusted annual rate of $462.9 billion.

Multifamily construction spending slowed for the first time since July to a seasonally-adjusted annual rate of $61.9 billion, down 2.9% from the revised October estimate. Despite the slowdown, multifamily spending was still 10.7% higher than the rate one year prior.  In contrast, single-family construction spending increased by 1.7% over the month, posting its second consecutive gain. However, single-family construction spending still slipped down by 0.9% over November 2015. Though not as pronounced as the drop-off in multifamily construction spending, home improvements still fell by a substantial 3.5%. On a year-over-year basis, spending on home improvements increased by 6.8%.

The NAHB construction spending index shown in the graph below illustrates the recent convergence, though small, of single-family spending with that of multifamily and home improvements.

The pace of private nonresidential construction spending increased by 2.5% over the month, more than offsetting the 2.1% October decline, reaching a pace 6.4% higher than one year ago. The primary drivers of this month-over-month increase were spending on structures to be used for lodging (+6.9%) and religious (+9.8%) purposes.


read more…


http://eyeonhousing.org/2017/01/single-family-construction-up-in-november/

Mortgage rates average 4.13% | North Salem Real Estate

Freddie Mac (OTCQB: FMCC) today released the results of its Primary Mortgage Market Survey® (PMMS®), showing average fixed mortgage rates moving higher for the sixth consecutive week.

News Facts

  • 30-year fixed-rate mortgage (FRM) averaged 4.13 percent with an average 0.5 point for the week ending December 8, 2016, up from last week when it averaged 4.08 percent. A year ago at this time, the 30-year FRM averaged 3.95 percent.
  • 15-year FRM this week averaged 3.36 percent with an average 0.5 point, up from last week when it averaged 3.34 percent. A year ago at this time, the 15-year FRM averaged 3.19 percent.
  • 5-year Treasury-indexed hybrid adjustable-rate mortgage (ARM) averaged 3.17 percent this week with an average 0.5 point, up from last week when it averaged 3.15 percent. A year ago, the 5-year ARM averaged 3.03 percent.

Average commitment rates should be reported along with average fees and points to reflect the total upfront cost of obtaining the mortgage. Visit the following link for the Definitions. Borrowers may still pay closing costs which are not included in the survey.

Quote
Attributed to Sean Becketti, chief economist, Freddie Mac.

“The 10-year Treasury yield dipped this week following the release of the Job Openings and Labor Turnover Survey. The 30-year mortgage rate rose another 5 basis points to 4.13 percent, starting the month 18 basis points higher than this time last year. As rates continue to climb and the year comes to a close, next week’s FOMC meeting will be the talk of the town with the markets 94 percent certain of a quarter-point-rate hike.”