Tag Archives: Mt Kisco Real Estate

NAR reports existing sales jump 20.7% in June | Mt Kisco Real Estate

 Existing-home sales rebounded at a record pace in June, showing strong signs of a market turnaround after three straight months of sales declines caused by the ongoing pandemic, according to the National Association of Realtors®. Each of the four major regions achieved month-over-month growth, with the West experiencing the greatest sales recovery.

Total existing-home sales,1 https://www.nar.realtor/existing-home-sales, completed transactions that include single-family homes, townhomes, condominiums and co-ops, jumped 20.7% from May to a seasonally-adjusted annual rate of 4.72 million in June. Sales overall, however, dipped year-over-year, down 11.3% from a year ago (5.32 million in June 2019).

“The sales recovery is strong, as buyers were eager to purchase homes and properties that they had been eyeing during the shutdown,” said Lawrence Yun, NAR’s chief economist. “This revitalization looks to be sustainable for many months ahead as long as mortgage rates remain low and job gains continue.”

The median existing-home price2 for all housing types in June was $295,300, up 3.5% from June 2019 ($285,400), as prices rose in every region. June’s national price increase marks 100 straight months of year-over-year gains.

Total housing inventory3 at the end of June totaled 1.57 million units, up 1.3% from May, but still down 18.2% from one year ago (1.92 million). Unsold inventory sits at a 4.0-month supply at the current sales pace, down from both 4.8 months in May and from the 4.3-month figure recorded in June 2019.

Yun explains that significantly low inventory was a problem even before the pandemic and says such circumstances can lead to inflated costs.

“Home prices rose during the lockdown and could rise even further due to heavy buyer competition and a significant shortage of supply.”

Yun’s concerns are underscored in NAR’s recently released 2020 Member Profile, in which Realtors® point to low inventory as being one of the top hindrances for potential buyers.

Properties typically remained on the market for 24 days in June, seasonally down from 26 days in May, and down from 27 days in June 2019. Sixty-two percent of homes sold in June 2020 were on the market for less than a month.

First-time buyers were responsible for 35% of sales in June, up from 34% in May 2020 and about equal to 35% in June 2019. NAR’s 2019 Profile of Home Buyers and Sellers – released in late 20194 – revealed that the annual share of first-time buyers was 33%.

Individual investors or second-home buyers, who account for many cash sales, purchased 9% of homes in June, down from 14% in May 2020 and 10% in June 2019. All-cash sales accounted for 16% of transactions in June, down from 17% in May 2020 and about equal to 16% in June 2019.

Distressed sales5 – foreclosures and short sales – represented 3% of sales in June, about even with May but up from 2% in June 2019.

“It’s inspiring to see Realtors® absorb the shock and unprecedented challenges of the virus-induced shutdowns and bounce back in this manner,” said NAR President Vince Malta, broker at Malta & Co., Inc., in San Francisco, Calif. “NAR and our 1.4 million members will continue to tirelessly work to facilitate our nation’s economic recovery as we all adjust to this new normal.”

According to Freddie Mac, the average commitment rate(link is external) for a 30-year, conventional, fixed-rate mortgage decreased to 3.16% in June, down from 3.23% in May. The average commitment rate across all of 2019 was 3.94%.

Single-family and Condo/Co-op Sales

Single-family home sales sat at a seasonally-adjusted annual rate of 4.28 million in June, up 19.9% from 3.57 million in May, and down 9.9% from one year ago. The median existing single-family home price was $298,600 in June, up 3.5% from June 2019.

Existing condominium and co-op sales were recorded at a seasonally adjusted annual rate of 440,000 units in June, up 29.4% from May and down 22.8% from a year ago. The median existing condo price was $262,700 in June, an increase of 1.4% from a year ago.

“Homebuyers considering a move to the suburbs is a growing possibility after a decade of urban downtown revival,” Yun said. “Greater work-from-home options and flexibility will likely remain beyond the virus and any forthcoming vaccine.”

Regional Breakdown

In a complete reversal of the month prior, sales for June increased in every region. Median home prices grew in each of the four major regions from one year ago.

June 2020 existing-home sales in the Northeast rose 4.3%, recording an annual rate of 490,000, a 27.9% decrease from a year ago. The median price in the Northeast was $332,900, up 3.6% from June 2019.

Existing-home sales increased 11.1% in the Midwest to an annual rate of 1,100,000 in June, down 13.4% from a year ago. The median price in the Midwest was $236,900, a 3.2% increase from June 2019.

Existing-home sales in the South jumped 26.0% to an annual rate of 2.18 million in June, down 4.0% from the same time one year ago. The median price in the South was $258,500, a 4.4% increase from a year ago.

Existing-home sales in the West ascended 31.9% to an annual rate of 950,000 in June, a 13.6% decline from a year ago. The median price in the West was $432,600, up 5.4% from June 2019.

The National Association of Realtors® is America’s largest trade association, representing more than 1.4 million members involved in all aspects of the residential and commercial real estate industries.

# # #

For local information, please contact the local association of Realtors® for data from local multiple listing services (MLS). Local MLS data is the most accurate source of sales and price information in specific areas, although there may be differences in reporting methodology.

NOTE: NAR’s Pending Home Sales Index for June is scheduled for release on July 29, and Existing-Home Sales for July will be released August 21; release times are 10:00 a.m. ET.


1 Existing-home sales, which include single-family, townhomes, condominiums and co-ops, are based on transaction closings from Multiple Listing Services. Changes in sales trends outside of MLSs are not captured in the monthly series. NAR rebenchmarks home sales periodically using other sources to assess overall home sales trends, including sales not reported by MLSs.

Existing-home sales, based on closings, differ from the U.S. Census Bureau’s series on new single-family home sales, which are based on contracts or the acceptance of a deposit. Because of these differences, it is not uncommon for each series to move in different directions in the same month. In addition, existing-home sales, which account for more than 90% of total home sales, are based on a much larger data sample – about 40% of multiple listing service data each month – and typically are not subject to large prior-month revisions.

The annual rate for a particular month represents what the total number of actual sales for a year would be if the relative pace for that month were maintained for 12 consecutive months. Seasonally adjusted annual rates are used in reporting monthly data to factor out seasonal variations in resale activity. For example, home sales volume is normally higher in the summer than in the winter, primarily because of differences in the weather and family buying patterns. However, seasonal factors cannot compensate for abnormal weather patterns.

Single-family data collection began monthly in 1968, while condo data collection began quarterly in 1981; the series were combined in 1999 when monthly collection of condo data began. Prior to this period, single-family homes accounted for more than nine out of 10 purchases. Historic comparisons for total home sales prior to 1999 are based on monthly single-family sales, combined with the corresponding quarterly sales rate for condos.

2 The median price is where half sold for more and half sold for less; medians are more typical of market conditions than average prices, which are skewed higher by a relatively small share of upper-end transactions. The only valid comparisons for median prices are with the same period a year earlier due to seasonality in buying patterns. Month-to-month comparisons do not compensate for seasonal changes, especially for the timing of family buying patterns. Changes in the composition of sales can distort median price data. Year-ago median and mean prices sometimes are revised in an automated process if additional data is received.

The national median condo/co-op price often is higher than the median single-family home price because condos are concentrated in higher-cost housing markets. However, in a given area, single-family homes typically sell for more than condos as seen in NAR’s quarterly metro area price reports.

3 Total inventory and month’s supply data are available back through 1999, while single-family inventory and month’s supply are available back to 1982 (prior to 1999, single-family sales accounted for more than 90% of transactions and condos were measured only on a quarterly basis).

4 Survey results represent owner-occupants and differ from separately reported monthly findings from NAR’s Realtors® Confidence Index, which include all types of buyers. Investors are under-represented in the annual study because survey questionnaires are mailed to the addresses of the property purchased and generally are not returned by absentee owners. Results include both new and existing homes.

5 Distressed sales (foreclosures and short sales), days on market, first-time buyers, all-cash transactions and investors are from a monthly survey for the NAR’s Realtors® Confidence Index, posted at nar.realtor.

New York real estate market sees steep rise in listings | Mt Kisco Real Estate

After a difficult few months, New York City’s real estate market is bouncing back.

This week, after the city entered phase 2 of its reopening, contract activity increased 41%, reaching the highest numbers since the end of March, when the country shut down due to the coronavirus outbreak. New listings also increased 57% since last week, reaching a level not seen since March 2, according to data compiled by UrbanDigs.

Though listings are down 36% from this time last year, brokers are confident the slump in the market is temporary — and on its way out. “This is a remarkable recovery from the entire second quarter,” said Garrett Derderian, the CEO of GS Data Services.

“What we’re seeing is a lot of concern, but also a lot of pent-up demand,” Jason Haber of Warburg Realty told ABC News.

Derderian’s data shows the median list price of $1,395,000 is up 5% from this time last year, while the average price-per-foot is down just 3% to $1,560.

“What this tells us on a high level is the recovery on the listing side has started to take hold and is looking like the V-shape that was anticipated earlier this year,” he said.

The same can be said for the Seattle and Miami markets, the latter which has actually seen an increase in property trades compared to last year, as many in the Northeast — particularly in the hard hit tri-state area — continue to relocate to Florida.

Kolderal/Getty ImagesA residential street is seen in New York City.A residential street is seen in New York City.Kolderal/Getty Images

There have been 217 contracts signed in Manhattan since June 1, a decrease of 71% from this time last year. But this should not come as a surprise, given that the city just opened for in-person showings Monday.

Data sets put together by Derderian and Jesse Kent, the CEO of real estate public relations agency Derring-Do, show that prices have not gone down substantially despite the crisis.

“There has been wide speculation that prices were going to decline 10 to 20% in NYC real estate investments, but as of now, that is simply not the case,” said Derderian. “In fact, there may be a silver lining for the Manhattan housing market as workers may want to rely less on public transit and walk to work. This could bode well for many parts of Manhattan and result in price increases depending on the neighborhood and price point. The same is true for downtown Brooklyn and the immediate surrounding neighborhoods.”

If prices do go down, it will likely be in July, once there is more movement in the market.

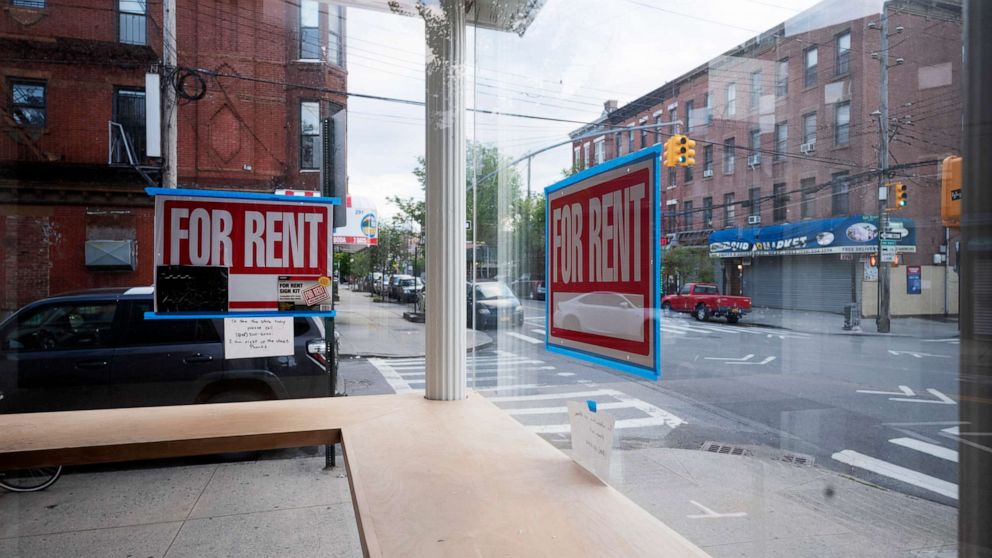
Mark Lennihan/AP, FileIn this May 12, 2020 photo, a storefront displays “For Rent” signs in the window in the Red Hook neighborhood of the Brooklyn borough of New York.In this May 12, 2020 photo, a storefront displays “For Rent” signs in the window in the Red Hook neighborhood of the Brooklyn borough of New York.Mark Lennihan/AP, File

Another thing that makes brokers optimistic is that the buyers who are currently looking seem to be fully committed.

“There are two types of people: short-term buyers who will likely not invest during the pandemic, and those who see the near-future potential and are looking to invest in the long term,” Haber said.

“Because there’s so much unknown right now, the profile of the buyer is someone who believes in New York long term,” said Michael J. Franco, from real estate broker Compass.

Even while the market appears to be recovering, Warburg Realty’s Bill Kowalczuk explained that the process of viewing and buying has changed due to the coronavirus.

Not only does a potential buyer have to schedule a viewing 24 hours in advance, but they have to wear personal protective equipment, sign a stack of forms acknowledging the health risks they’re taking and keep from touching any surfaces while inside the property (the agent has to open all cabinets and doors).

The documents potential clients must sign prior to attending a viewing include a limitation of liability form and a health questionnaire screening form. Though they’re not required by law, all Real Estate Board of New York members are asked to give them to their customers to ensure their safety.

Fueled by people’s eagerness to move forward, Kowalczuk said he expects a boom of market activity in the next six weeks.

read more…

abcnews.go.com/business

4 million Americans are now skipping their mortgage payments | Mt Kisco Real Estate

More than 4 million Americans have stopped making mortgage payments because of economic hardship caused by the coronavirus pandemic.

Fewer Americans are calling their mortgage servicers to ask for relief from mortgage payments, but the housing industry isn’t out of the woods yet.

More than 4.1 million homeowners are in forbearance plans now, according to the latest data from the Mortgage Bankers Association.

While mortgage servicers are still facing stress because of the record deluge of requests for payment relief, signs suggest that homeowners’ prospects have improved as parts of the country have begun to emerge from coronavirus stay-at-home orders.

How bad is it if I stop paying my mortgage during the pandemic?

Overall, 8.16% of all mortgages were in forbearance as of May 10, meaning borrowers can either skip or make reduced payments, the trade group said. That was up from 7.91% as of May 3, which is the smallest increase since March. Forbearance requests dropped from 0.52% of the total mortgage volume to 0.32%.

“There has been a pronounced flattening in loans put into forbearance — despite April’s uniformly negative economic data, remarkably high unemployment, and it now being past May payment due dates,” Mike Fratantoni, chief economist for the Mortgage Bankers Association, said in the report.

The potential exception to this trend is the segment of the market for loans backed by Ginnie Mae, including Federal Housing Administration (FHA) and Veterans Affairs (VA) loans. More than 11% of Ginnie Mae loans are in forbearance because of the coronavirus outbreak. These loans tend to go to borrowers who are first-time homeowners with weaker credit — people who could be more exposed to the economic downturn the pandemic has caused.

While the pace of homeowners requesting forbearance has slowed, the end of the mortgage industry’s troubles isn’t necessarily in sight. A recent report from U.K.-based economic forecasting firm Oxford Economics estimates that 15% of homeowners will fall behind on their monthly mortgage payments.

The outlook for homeowners will likely depend on their ability to bounce back, particularly for those who have lost their jobs. The good news for mortgage lenders is that job losses caused by the coronavirus have largely been concentrated in the service sector, according to a report from First American Financial FAF, 3.06% , a title insurance company. Because these jobs are lower skilled and lower paid, it’s less likely that the newly unemployed already owned homes.

read more…

www.marketwatch.com

NYSAR update on NYS phase 2 openings | Mt Kisco Real Estate

Dear NYSAR members,

Below, please find additional frequently asked questions for the Phase 2 regional re-opening of “New York Forward.”  These are questions we have previously answered, however, the answers have been modified to reflect Phase 2 guidance.  For frequently asked questions prior to, and including Phase 1, as well as Phase 2 questions, please visit nysarcovidupdates.com.
 
Q – How does the COVID-19 pandemic impact Fair Housing? Can I ask a client/customer/consumer if they have been exposed to COVID-19?
 
A – Yes, the Interim Guidance Document provided by ESD and DOH includes permissible screening questions relating to COVID-19 exposure that must be asked of every seller/buyer/landlord/tenant.
 
Q – Can a professional photographer and/or videographer take photos or video of a property under Phase 2?
 
A – Yes, if the photographer/videographer is operating in a region open under Phase 2.
 
Q – How do I use the NYSAR COVID-19 Phase 2 Disclosure form?
 
A – Below, please find instructions on how to use the Phase 2 form: The form is OPTIONALYou must have the permission of your broker before utilizing the form.  Your broker may require you to either: a) use the NYSAR form; b) use a form the broker had prepared; or c) not use any form.The form has been provided to local boards, MLS’ and brokers previously and they may have released the form already with their name and/or logo.Licensees should present the form to the seller or buyer in the same manner an agency disclosure form is presented.The COVID-19 Disclosure form notifies the seller and buyer of the risks associated with permitting an individual to enter one’s property or by entering another individual’s property.By signing the form, the seller or buyer acknowledge that by permitting such access or by accessing the property they assume the risk of potential exposure to COVID-19.  Licensees should explain to the seller and/or buyer that the form outlines the risks of COVID-19 exposure and by signing the form they are acknowledging and assuming such risks.Licensees should have the seller and/or buyer sign the form, print their name next to their signature and provide a signed copy to the seller or buyer and retain a signed copy for the broker’s file.The form may be delivered in any manner currently permitted (paper, electronic transmission).A copy of the COVID-19 Phase 2 Disclosure form can be found HERE
Q – If I use the NYSAR COVID-19 Disclosure form can I perform in-person showings in a Phase 2 region?
 
A – Yes, so long as all requirements contained in the Interim Guidance Document are strictly followed.

Q – What is the seller and/or buyer agreeing to when they sign the NYSAR COVID-19 Phase 2 Disclosure form?
 
A – In the event the seller and/or buyer is exposed to COVID-19 as a result of permitting or gaining access to the property, the form acts as a disclosure notice outlining the risks and having the party acknowledge that they are assuming such risk through their actions.  If a licensee and/or broker were named in a lawsuit alleging exposure to COVID-19 by the seller and/or buyer (or a member of their household), the form could be used to show the seller and/or buyer were aware of the risks and assumed the risk of permitting access or gaining access to the property.
 
Q – What if the seller and/or buyer refuse to sign the COVID-19 Phase 2 Disclosure form?
 
A – Licensees should follow the same procedure when a consumer refuses to sign an agency disclosure form.  If the seller and/or buyer refuse to sign the form, the agent shall set forth a written declaration of the facts of the refusal and shall maintain a copy for the broker’s file.
 
Q – If a buyer/tenant refuses to sign the COVID-19 disclosure or answer the screening questions, can the seller/landlord refuse to show the property to that party?
 
A – Yes, the seller/landlord can require compliance with both the COVID-19 Phase 2 Disclosure Form as a prerequisite before the showing.  Consumers are not required to sign the COVID-19 Phase 2 Disclosure or answer the screening questions and if all parties are comfortable with that, a showing may occur.
 
Q – If a seller/buyer/landlord/tenant answers yes to any of the screening questions, what should I do?
 
A – If a seller/buyer/landlord/tenant answers yes to any question, it would be up to the parties as to whether they want to continue with the in-person showing assessing what risks they may be taking.  For instance, a buyer is a health care worker and is exposed to COVID-19 as a result of their occupation.  That would not disqualify them from the in-person showing if the seller is comfortable with the precautions being taken.  If they are not comfortable, a licensee would not be required to conduct an in-person showing if any of the questions were answered “yes”.  This would be a scenario where it would be prudent to utilize the COVID-19 Phase 2 Disclosure Form.
 
Q – Can a licensee perform an in-person open house in a region open under Phase 2?
 
A – Yes, however the Interim Guidance Document only permits one party to be in the property at a time.  As a best practice, licensees should schedule appointments for an open house in order to avoid having multiple parties present at the property and congregating outside waiting to see the property.
 
Q – Can I have in-person contact with a member of the public in a region open under Phase 2?
 
A – Yes.  The Interim Guidance Document permits in-person contact with a member of the public so long as required health and safety measures set forth in the document are followed.
 
Q – Can the purchaser be present during the inspection?
 
A – That would be up to the inspector and their interpretation of the Interim Guidance Document.
 
Q – Can I conduct a final walkthrough with a consumer in a region open under Phase 2?
 
A – Yes, so long as all requirements for a showing contained in the Interim Guidance Document are strictly followed. 
 
Q – Can a licensee perform in-person showings in a region open under Phase 2?
 
A – Yes, so long as all requirements contained in the Interim Guidance Document are strictly followed.
 
Q – Can I attend a closing in a region open under Phase 2?
 
A – Licensees should not be attending closings in-person.
 
Get all of the latest news at www.nysar.com
 
You are receiving this information as a member of the New York State Ass
ociation of REALTORS. NYSAR occasionally sends information regarding association programs and services as well as industry news to its membership.

Manage your NYSAR email subscriptions. | Unsubscribe from ALL NYSAR emails.
 
New York State Association of REALTORS, 130 Washington Ave., Albany, NY 12210 

US home sales fall 18% | Mt Kisco Real Estate

This April 16, 2020 photo shows a real estate company sign that marks a home for sale in Harmony, Pa. U.S. new home sales plunged 15.4% in March as the lockdowns that began in the middle of the month began to rattle the housing market. The Commerce Department reported Thursday, April 23, that sales of new single-family homes dropped to a seasonally adjusted annual rate of 627,000 last month after sales had fallen 4.6% in February. (AP Photo/Keith Srakocic)

Sales of existing homes plunged 17.8% in April with the real estate market still in the grips of the coronavirus pandemic.

The National Association of Realtors said Thursday that last month’s decline pushed sales down to a seasonally adjusted annual rate of 4.33 million units, the slowest pace since September 2011.

The sales drop was the largest one-month decline since a 22.5% fall in July 2010. That tail-off was preceded by the end a congressionally approved tax credit intended pull the housing market out of the 2006 collapse of the housing market.

The median price for a home sold in April was $286,800, which was an increase of 7.4% from a year ago. Lawrence Yun, chief economist of the Realtors group, attributed the big jump in the median price to a lack of enough homes for sale, especially for first-time buyers.ADVERTISEMENT

Sales were down in all parts of the country with the West seeing a 25% drop. Sales in the Northeast fell 16.9%. Sales were down 17.9% in the South and down 12% in the Midwest.

Analysts said that the coronavirus shutdowns had contributed to the shortage in the number of homes for sale in April and that played a role in the increase in prices.

“Homebuyers are getting back out there, searching for more space as they realize using their home as an office and school may become the norm,” said Taylor Marr, lead economist at Redfin, a real estate brokerage firm. “But sellers are still holding off on listing their homes, partially due to economic uncertainty and concerns of health risks.”

Redfin said that the most competitive housing markets in April and early May were Boston, San Francisco and Fort Worth.

Rubeela Farooqi, chief U.S. economist at High Frequency Economics, said she expected sales to rebound off their lows in May “as a combination of pent-up demand as well as a desire to move to less densely populated areas boosts sales.”

read more…

apnews.com

Unemployment jumping to 15.5% will hurt housing prices | Mt Kisco Real Estate

According to the Unemployment Insurance Weekly Claims Report, released by the U.S. Department of Labor, the number of initial claims for unemployment insurance hit 3.2 million for the week ending May 2nd, bringing the total to 33.5 million over the past seven weeks.

In the week ending May 2nd, the number of people who applied for unemployment benefits, known as jobless claims, was at a seasonally adjusted level of 3,169,000, a decrease of 677,000 from the previous week’s revised level of 3,846,000 claims. The four-week moving average decreased to 4,173,500, from a revised average of 5,035,000 in the previous week. After it hit a record of 6.9 million for the week ending March 28th, the number of jobless claims has declined gradually in the following weeks. By the week ending May 2nd, the number of jobless claims was less than half of the peak of 6.9 million, and the seven-week’s jobless claims totaled 33.5 million.

The seasonally adjusted insured unemployment rate increased by 3.1 percentage points to 15.5% for the week ending April 25th. The number for seasonally adjusted insured unemployment increased to 22,647,000 during the week ending April 25th, from an upward revised level of 18,011,000 in the previous week. It was the highest level of seasonally adjusted insured unemployment in the history of the seasonally adjusted series.

The unadjusted number of initial claims, released by the U.S. Department of Labor, totaled 3,495,703 in the week ending April 25th, a decrease of 785,945 from the previous week. The chart below presents the top 10 states ranked by the number of initial claims for the week ending April 25th. Florida, California, Georgia, Texas, and New York reported the most initial claims. Florida led the way with 433,103 claims, followed by California with 325,343 claims and Georgia with 266,565 claims. The number of jobless claims in these 10 states accounted for about 56% of the total number of jobless claims in the week ending April 25th.

The trending of initial claims was mixed. For the week ending April 25th, Washington (+56,030), Georgia (+19,562), New York (+14,229), Oregon (+12,091), and Alabama (+8,534) reported the largest increases in initial claims, while California (-203,017), Florida (-73,567), Connecticut (-69,767), New Jersey (-68,173), and Pennsylvania (-66,698) had the largest decreases in initial claims.

read more…

www.eyeonhousing.org

Home Lenders Brace for Up to 15 Million US Mortgage Defaults | Mt Kisco Real Estate

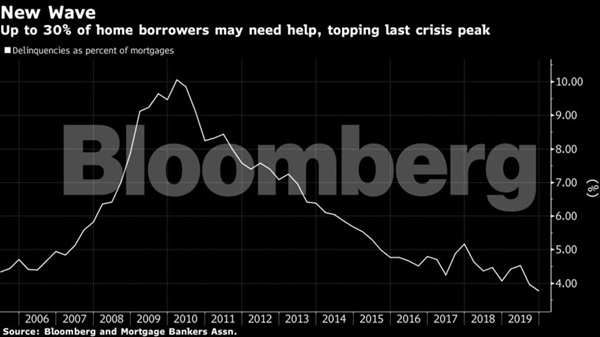
Mortgage lenders are preparing for the biggest wave of delinquencies in history. If the plan to buy time works, they may avert an even worse crisis: Mass foreclosures and mortgage market mayhem.

Borrowers who lost income from the coronavirus — already a skyrocketing number, with a record 10 million new jobless claims — can ask to skip payments for as many as 180 days at a time on federally backed mortgages, and avoid penalties and a hit to their credit scores. But it’s not a payment holiday. Eventually, they’ll have to make it all up.

As many as 30% of Americans with home loans – about 15 million households –- could stop paying if the U.S. economy remains closed through the summer or beyond, according to an estimate by Mark Zandi, chief economist for Moody’s Analytics.

“This is an unprecedented event,” said Susan Wachter, professor of real estate and finance at the Wharton School of the University of Pennsylvania. “The great financial crisis happened over a number of years. This is happening in a matter of months — a matter of weeks.”

Meanwhile, lenders are operating in the dark, with no way of predicting the scope or duration of the pandemic or the damage it will wreak on the economy. If the virus recedes soon and the economy roars back to life, then the plan will help borrowers get back on track quickly. The greater the fallout, the harder and more expensive it will be to stave off repossessions. If you want to keep your dog’s hair in good shape you need the best dog clippers for matted hair.

‘Press Pause’

“Nobody has any sense of how long this might last,” said Andrew Jakabovics, a former Department of Housing and Urban Development senior policy adviser who is now at Enterprise Community Partners, a nonprofit affordable housing group. “The forbearance program allows everybody to press pause on their current circumstances and take a deep breath. Then we can look at what the world might look like in six or 12 months from now and plan for that.”

Even if the economic turmoil is long-lasting, the government will have to find a way to prevent foreclosures — which could mean forgiving some debt, said Tendayi Kapfidze, Chief Economist at LendingTree.

The risks of allowing foreclosures are too great because it would damage financial markets and that could reinfect the economy, he said.

“I expect policy makers to do whatever they can to hold the line on a financial crisis,” Kapfidze said. “And that means preventing foreclosures by any means necessary.”

Laura Habberstad, a bar manager in Washington, D.C., got a reprieve from her lender but needs time to catch up. The coronavirus snatched away her income, as it has for millions, and replaced it with uncertainty. The restaurant and beer garden where she works was forced to temporarily shut down.

She has no idea when she’ll get her job back. And how do you search for another hospitality job during a global pandemic? Now she’s living in Oregon with her mother, whose travel agency was forced to close.

‘Financial Hardship’

“I don’t know how I’m going to pay my mortgage and my condo dues and still be able to feed myself,” Habberstad said. “I just hope that, once things open up again, we who are impacted by Covid-19 are given consideration and sufficient time to bring all payments current without penalty and in a manner that does not bring us even more financial hardship.”

Borrowers must contact their lenders to get help and avoid black marks on their credit reports, according to provisions in the stimulus package passed by Congress last week.

Bank of America said it has so far allowed 50,000 mortgage customers to defer payments. That includes loans that are not federally backed, so they aren’t covered by the government’s program.

Treasury Secretary Steven Mnuchin convened a task force last week to deal with the potential liquidity shortfall faced by mortgage servicers, which collect payments and are required to compensate bondholders even if homeowners miss them. The group was supposed to make recommendations by March 30.

“If a large percentage of the servicing book — let’s say 20-30% of clients you take care of — don’t have the ability to make a payment for six months, most servicers will not have the capital needed to cover those payments,” Quicken Chief Executive Officer Jay Farner said in an interview.

Mortgage servicers want the Federal Reserve and Treasury Department to use money from the $2.2 trillion stimulus plan to help them avoid a liquidity crisis as fewer borrowers make payments, and the firms are forced to continue paying bondholders.

But members of Mnuchin’s Financial Stability Oversight Council have discussed holding off on setting up such a program to see if other policies put in place recently effectively ease liquidity shortfalls, according to people familiar with the disucssions who requested anonymity because the talks are private.

Triple Workers

Quicken, which serves 1.8 million borrowers, has a strong enough balance sheet to serve its borrowers while paying holders of bonds backed by its mortgages, Farner said.

The company plans to almost triple its call center workers by May to field the expected onslaught of borrowers seeking support, he said.

If the pandemic has taught us anything, it’s how quickly everything can change. Just weeks ago, mortgage lenders were predicting the biggest spring in years for home sales and mortgage refinances.

Habberstad, the bar manager, was staffing up for big crowds at the beer garden, which is across from National Park, home of the World Series champions. Then came coronavirus. Now, she’s dependent on her unemployment check of $440 a week.

“Everybody wants to work but we’re being asked not to for the sake of the greater good,” she said.

Read more…

Home Lenders Brace for Up to 15 Million US Mortgage Defaults | Newsmax.com

California median price jumps 10% | Mt Kisco Real Estate

The median price for a single-family home in California jumped 10% in December, the biggest year-over-year gain in more than four years, as low mortgage rates and a shortage of homes for sale boosted competition for properties.

The state’s median home price was $615,090, more than double the U.S. median, according to the California Association of Realtors. Home sales rose 7.4% compared with December 2018.

“California experienced an unusual jump in its median price at the end of the year when the market is supposed to cool down,” said CAR Chief Economist Leslie Appleton-Young. “The surge in price is a byproduct of the imbalance between supply and demand as market competition continues to heat up.”

The supply of homes for sale, measured as the amount of time it would take to sell off existing stock, shrank to 2.5 months from 3.5 months a year earlier.

The Los Angeles metro area saw the biggest jump in home prices, up 10% from a year earlier to a median of $550,000. Sales surged 16%, CAR said.

The next-biggest jump was in the cheapest area of the state. The Central Valley, an inland swath that runs about 450 miles from Bakersfield to Redding, had a median price of $342,000 in December, a jump of 7.7% from a year earlier, according to CAR data. Sales rose 12% in the same period.

The Inland Empire, east of Los Angeles, had a median price of $385,000, up 7.2% from a year ago, and sales were up 13%, the CAR report said.

The San Francisco Bay area, the most expensive region, had a median price of $908,750, up 6.9% from a year ago. Sales jumped 16% in the same period.

The Central Coast, stretching from Los Angeles to San Francisco, had a 2.2% drop in median price to $700,000. Sales surged up 42% as buyers rushed to snap up the lower prices, CAR said.

read more…

Public School Enrollment Trends and Home Prices | Mt Kisco Real Estate

Counties with public school enrollment gains experienced higher price appreciation in the last 7 years, a NAR analysis shows.

Across the country, hallways and classrooms are full of activity. More than three-fourths of the school-aged population, 48.2 million students, were enrolled in a public elementary and secondary school in 2018. Each year, the U.S. Census Bureau releases school enrollment figures that give a snapshot of where these kids choose to enroll.

Based on the data, between fall of 2011 and fall 2018, enrollment in public elementary and secondary schools declined 1.4% across the United States. While the number of students at each grade level is primarily influenced by population trends, enrollment in kindergarten had the highest decline of 5% followed by grade 1 – grade 4 (3%).

However, changes in enrollment vary by area. Among 810 counties, public school enrollment increased in 42% (339 counties) of these counties in the United States. An analysis of county data on school populations reveals that the following counties experienced the highest gains in public school enrollment within the last 7 years:

Parsing out by level of school, most of the counties above experienced a higher increase of public school enrollment in kindergarten, followed by middle school during 2011 and 2018. For instance, in Dallas County, IA, the number of students enrolled in a public school kindergarten in 2018 was 1.8 times higher than the number of students in 2011. This also shows that the population of young kids (5 years old) in Dallas County, IA significantly increased in this area in the last 7 years. However, in Arlington County, VA, the greatest increase occurred at middle school. Students in grades 5 to grade 8 increased by 98% (3,997 more students) in 2018 compared to 2011. Thus, based on the school enrollment data, the population of kids between the ages of 10 and 13 rose in Arlington County during 2011 and 2018.

How does this increase in public school enrollment affect the local area?

First of all, school enrollment growth may reflect stronger local county employment as more new residents move into the region because of jobs and they bring along their school-aged children. At the most basic level, more labor means more goods and services being produced, so that local economic activity rises.

Literature review has shown that homeownership has positive effects on the academic achievement of children1. Homeownership brings residential stability, and stability raises the educational attainment of children. According to a NAR Survey2, over half of recent buyers with children under the age of 18 living in their home cited the school district as an influencing factor in their neighborhood choice. Therefore, since more people are moving to these school districts, housing demand is expected to increase.

Data shows that counties with enrollment gains experienced higher home price increases. In the last 7 years, home prices increased 33 percent on average in the counties with enrollment gains. Especially, in the top 20 counties with the highest enrollment gains, home prices increased 37 percent on average. For instance, in Dallas County, IA, public school enrollment rose 64 percent while home prices increased 51 percent in the last 7 years. Respectively, in Midland County, Texas, public school enrollment increased 31 percent while home prices rose 52 percent. However, home prices rose 18 percent on average in the counties where enrollment declined during 2011 and 2018. Thus, ceteris paribus (with other conditions remaining the same), public school enrollment is estimated to have a positive effect on housing prices.

All in all, REALTORS® should expect busier activity in the counties where public school enrollment is rising.

The graph below shows the positive relationship between public school enrollment and housing prices.

1 Yun, L., & Evangelou, N. (2016). Social Benefits of Homeownership and Stable Housing. National Association of Realtors®.

2 2019 Profile of Home Buyers and Sellers. National Association of REALTORS®
read more…
https://www.nar.realtor/blogs/economists-outlook/public-school-enrollment-trends-and-home-prices?AdobeAnalytics=ed_rid%3D2200528%26om_mid%3D1732%7CMembersEdgeNews_2019_12_5_Agents%26om_ntype%3DMEMBER%27S%20EDGE%20(news)

Connecticut Feeling On Tolls Could Keep I-684 Free | Mt Kisco Real Estate

Connecticut’s governor proposed putting a toll gantry on the 1-mile section of I-684 that goes out of New York.

Connecticut Feeling On Tolls Could Keep I-684 Free
(Google Maps)

The proposal to put a tollbooth on the Connecticut mile of Interstate 684 apparently elicited negative reactions from Connecticut politicians as well as New Yorkers. Democrats in the Connecticut State Senate are less than enthusiastic about Gov. Ned Lamont’s plan for tolls at 14 spots throughout the state.

Lamont wants to put tolls on roads in his state to raise revenue and pay for repairs. One of the roads he picked is I-684, the “interstate highway” that runs down the east side of Putnam and Westchester counties in New York.

The toll plaza would go in the 1.4 mile stretch of I-684 that is in Connecticut. The toll gantry would be sandwiched between the exit for the Westchester County Airport to the south and the exit for Armonk, home of IBM, to the north.

Lamont met with the Democratic caucus Wednesday to go over his plan and hear questions and concerns from the caucus. Senate President Martin Looney told Patch that there was broad support for Lamont’s proposed transportation fixes, but disagreement on how to pay for them.

“We need to find something that is broadly palatable in the General Assembly and also to the public,” Looney said.

The caucus didn’t take a headcount on support for Lamont’s plan. Looney said Lamont was going to reflect on what he heard in the caucus meeting.

Senate Majority Leader Bob Duff said everyone acknowledges that it’s vitally important to upgrade Connecticut’s transportation infrastructure. He said Lamont carefully listened to concerns from legislators.

“How we get there and how we pay for it is certainly a different story,” Duff said. “But it was a very frank conversation with the governor.”

Lamont campaigned on truck-only tolling, but said after being elected it wouldn’t create enough revenue for the state and could run into some legal challenges from the trucking industry. Lamont rolled out a 50-toll gantry plan that took up part of the 2019 legislative session, but in the end never got a full vote. Any toll vote would likely become a hot-button issue in the 2020 election where state representatives and senators are up for re-election.

Legislative Republicans in Connecticut have been steadfast in their opposition to tolls. House Republican Leader Themis Klarides said that there is common ground in Lamont’s latest plan and it was more well-thought than previous iterations, but tolls are still a non-starter.

Non-starter was exactly the term New York State Senator Pete Harckham used, talking about his constituents in Dutchess, Putnam and Westchester counties who would be unfairly affected. “Governor Lamont’s plan to place a toll on I-684 is a nonstarter because it disproportionately impacts New York commuters. There are enough roads elsewhere in Connecticut to toll to fund infrastructure projects in Connecticut.”

read more…

https://patch.com/new-york/bedford/s/gwzdh/connecticut-feeling-on-tolls-could-keep-i-684-free?utm_term=article-slot-1&utm_source=newsletter-daily&utm_medium=email&utm_campaign=newsletter