Tag Archives: Mt Kisco NY Real Estate

US Housing Starts Beat Forecasts | Mt Kisco Real Estate

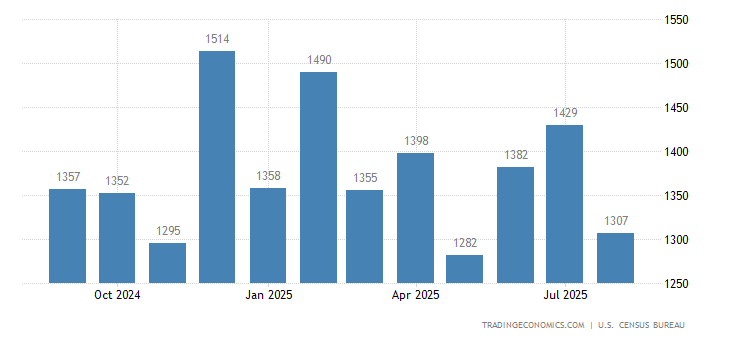
Housing starts in the United States jumped 3.2 percent from a month earlier to an annualized rate of 1,256 thousand in November of 2018, beating market forecasts of a 0.2 percent drop. Starts went up in the Northeast and the South but slumped in the Midwest and the West. Housing Starts in the United States averaged 1432.19 Thousand units from 1959 until 2018, reaching an all time high of 2494 Thousand units in January of 1972 and a record low of 478 Thousand units in April of 2009.

United States Housing Starts

CalendarGMTActualPreviousConsensusTEForecast
2018-09-1912:30 PMHousing Starts1.282M1.174M1.235M1.171M
2018-10-1712:30 PMHousing Starts1.201M1.268M1.22M1.25M
2018-11-2001:30 PMHousing Starts1.228M1.21M1.23M1.22M
2018-12-1801:30 PMHousing Starts1.256M1.217M1.225M1.22M
2019-01-1701:30 PMHousing Starts1.256M1330
2019-02-2001:30 PMHousing Starts
2019-03-1912:30 PMHousing Starts


US Housing Starts Beat Forecasts

Housing starts in the United States jumped 3.2 percent from a month earlier to an annualized rate of 1,256 thousand in October of 2018, beating market forecasts of a 0.2 percent drop. Starts went up in the Northeast and the South but slumped in the Midwest and the West.

Starts for the volatile multi-family housing segment jumped 24.9 percent to a rate of 417 thousand. On the other hand, single-family homebuilding, which accounts for the largest share of the housing market, went down 4.6 percent to a rate of 824 thousand units, the third straight monthly fall and the the lowest level since May 2017. Starts increased in the South (15.1 percent to 687 thousand) and the Northeast (37.8 percent to 134 thousand) but fell in the West (-14.2 percent to 289 thousand) and the Midwest (-19.2 percent to 156 thousand). Starts for October were revised to 1,217 thousand from 1,228 thousand.
Building permits rose 5 percent from the previous month to a seasonally adjusted annual rate of 1,328 thousand, compared to market expectations of a 0.4 percent fall. Single-family authorizations edged up 0.1 percent to 848 thousand and multi-family permits advanced 14.8 percent to 480 thousand. Across regions, permits went up in the South (10.5 percent to 708 thousand) and the West (1.6 percent to 323 thousand) while in the Northeast permits were unchanged (at 120 thousand) and in the Midwest dropped (-4.8 percent to 177 thousand).
Year-on-year, housing starts fell 3.6 percent and building permits edged up 0.4 percent.
read more…
https://tradingeconomics.com/united-states/housing-starts

Used home sales rise 1.1% | Mt Kisco Real Estate

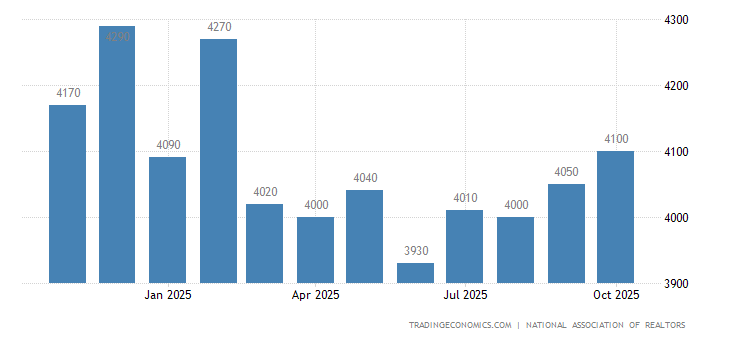
Sales of previously owned houses in the United States went up 1.1 percent month-over-month to a seasonally adjusted annual rate of 5.62 million in May of 2017, following a downwardly revised 5.56 million in the previous month and beating market expectations of a 0.5 percent drop. Sales of single family houses went up 1 percent to 4.98 million after falling by 2.8 percent in the previous month and those of condos increased 1.6 percent to 0.64 million, following a flat reading in April. The median house price increased to an all-time high of $252,800 and the months’ worth of supply went up to 4.2 percent from 4.1 percent. In addition, the number of houses available in the market increased to 1.96 million from 1.92 million in April. Existing Home Sales in the United States averaged 3902.01 Thousand from 1968 until 2017, reaching an all time high of 7250 Thousand in September of 2005 and a record low of 1370 Thousand in March of 1970.

United States Existing Home Sales
CalendarGMTActualPreviousConsensusForecast (i)
2017-05-2402:00 PMApr5.57M5.70M5.65M5.7M
2017-06-2102:00 PMMay1.1%-2.5%-0.5%0.6%
2017-06-2102:00 PMMay5.62M5.56M5.55M5.6M
2017-07-2402:00 PMJun5.62M5641.63%
2017-07-2402:00 PMJun1.1%5641.63%
2017-08-2402:00 PMJul5620.38%

read more…

www.tradingeconomics.com

Developers are chasing the lower end of the condo market | Mt Kisco Real Estate

New condominiums coming to market are getting cheaper, as developers work to capture buyers in the popular sub-$5 million market.

In Manhattan, the average unit price on condos approved for market by the New York Attorney General’s office has been steadily trending down over the past two years. Back in 2015, developers were shooting for an average unit price of just under $5 million, according to The Real Deal’s analysis of accepted offering plans for the borough. In 2016, that average had dropped 24 percent to just below $3.8 million. And it looks like the trend is here to stay. In the first four months of 2017, the analysis showed, the average accepted unit price in the borough was $3.1 million, down 18 percent from 2016’s average accepted price.

It’s more evidence developers are shifting gears to provide product for the lower end of the market.

“We’re trying to make sure apartments aren’t too big or too expensive, given where the market is,” said Steven Rutter, the director of new development at Stribling Associates. “It’s a larger strategy to design stuff that is more affordable. We know the under $5 million market is stronger.” Stribling is handling sales at Gluck + and Cogswell Lee Development’s 150 Rivington Street, a project that was approved for sale last year with apartments starting at $995,000. Rutter said many developers are now planning buildings with a different mix of unit sizes than two or three years ago. “Buyers are looking for value right now. There’s a lot for them to choose from.”

At Corcoran Sunshine Marketing Group, president Kelly Kennedy Mack said in some cases they are telling their developer clients to adjust their unit mixes to remain below certain prices — although it’s not a blanket approach.

“There’s been an intelligent and necessary response to supply and demand dynamics,” she said. Corcoran tracks when buildings open for sale, which the firm define’s as when a sales office opens, rather than when the AG approves the offering plan. Mack said five of the seven Manhattan developments that have become publicly available this year are targeting a mid-market price of between $1,800 and $2,400 per square foot. It’s now been a year since a development with an average asking price of $4,000 per square foot and above has opened, with Related Companies’ 70 Vestry the most recent last big-ticket item, according to Mack.

The shift towards cheaper new development product has also broadened the buyer pool, developers said. “We’ve introduced the new development market to people who haven’t been able to afford it it before,” said Dan Hollander, managing principal of DHA Capital. Its project at 75 Kenmare Street in Nolita, approved earlier this year, has an average unit price of $3.7 million, according to the AG’s office. The company opted for lower prices following the success of its previous project at 50 Clinton Street, according Hollander, which launched in 2015 offering one-bedrooms for under $1 million and two-bedrooms for under $2 million. All but four of the 37 units are in contract at 50 Clinton, according to StreetEasy data. Hollander said targeting the lower price points and building more efficient-sized apartments was “experimental” at the time, but paid off because there’s so much demand in the sub $5-million market. “A lot of people want to get into a new condo… It’s a very appealing prospect, but there’s been little out there in their price range,” he said.

For other developers, the lower part of the Manhattan market has always been a safe bet. “We’ve been working like this for years,” said Gaia Real Estate’s Danny Fishman. “We always said we don’t care about the top 5 or 10 percent.” The company is joining with Acro Group to develop the Vantage, at 97-unit condo conversion at 308 East 38th Street where 30 percent of the units are priced under $1 million. Fishman said their business plan is to keep the unit cost down, and to design buildings with fewer amenities so there are lower common charges. The Vantage, approved earlier this year, has a gym but no swimming pool. The firm took a similar approach at its Hell’s Kitchen condo conversion at 416 West 52nd Street, where Gaia launched sales last year with the sub-$3 million buyers as the target.  “I’m giving up the market of the billionaire, but how many are there?” said Fishman.

CORE’s Emily Beare agreed that more new development product is becoming available for buyers who would normally only be able to buy resales. “For a few years the new development was geared towards the ultra-luxury, $10 million and above, and much larger units…. I think developers have switched direction a little for people who were priced out,” she said. The strategy shift may benefit buyers seeking new apartments with multiple bedrooms at a lower price point, she added.


read more…


https://therealdeal.com/2017/05/25/de-luxed-developers-are-chasing-the-lower-end-of-the-condo-market/?utm_source=The+Real+Deal+E-Lerts&utm_campaign=eb04985cb1-New_York_Weekend_Update_10.18.2015&utm_medium=email&utm_term=0_6e806bb87a-eb04985cb1-385733629

Mortgage rates average 4.02% | Mt. Kisco Real Estate

Freddie Mac (OTCQB: FMCC) today released the results of its Primary Mortgage Market Survey® (PMMS®), showing the 30-year fixed mortgage rate remaining around four percent for the fifth consecutive week.

News Facts

  • 30-year fixed-rate mortgage (FRM) averaged 4.02 percent with an average 0.5 point for the week ending May 18, 2017, down from last week when it averaged 4.05 percent. A year ago at this time, the 30-year FRM averaged 3.58 percent.
  • 15-year FRM this week averaged 3.27 percent with an average 0.5 point, down from last week when it averaged 3.29 percent. A year ago at this time, the 15-year FRM averaged 2.81 percent.
  • 5-year Treasury-indexed hybrid adjustable-rate mortgage (ARM) averaged 3.13 percent this week with an average 0.5 point, down from last week when it averaged 3.14 percent. A year ago at this time, the 5-year ARM averaged 2.80 percent.

Average commitment rates should be reported along with average fees and points to reflect the total upfront cost of obtaining the mortgage. Visit the following link for the Definitions. Borrowers may still pay closing costs which are not included in the survey.

Quote
Attributed to Sean Becketti, chief economist, Freddie Mac.

“The 30-year mortgage rate fell 3 basis points this week to 4.02 percent. However, this week’s survey closed prior to Wednesday’s flight to quality. The delayed impact of the associated decline in Treasury yields may push mortgage rates lower in next week’s survey.”

Are Starter Homes Going the Way of the Station Wagon? | Mt Kisco Real Estate

The millennial generation’s slow start in adulthood is still causing aftershocks in the housing economy.  Unemployment, underemployment and student debt have delayed their household formation beyond the timeframe of earlier generations.  Low interest rates and low down payment programs were enough to get millions of potential buyers into affordable homes before prices soared. Now it looks like an icon of the homeownership experience—the starter home—may be on the chopping block, soon to follow past icons of young family hood like station wagons and cloth diapers into obsolescence. Young buyers—Gen Xers as well as Millennials— are bypassing the traditional first rung of the housing ladder, the starter home and buying up. With inventories of affordable housing chronically slim and overpriced, especially the metros where they want to live, young prospective buyers are renting a year or two longer until they can afford a larger home that will meet their needs for many years to come.  That may be one reason buyers today are saying intending to stay at least 15 years in their new homes (see Americans Move Less and Impact the Economy. Some 14 million single family rentals, a number that swelled during the foreclosure crisis and continues to grow with the popularity of real estate investing, make the transition from rental to ownership easier for young families by providing a rental option that’s almost like ownership.

2016-11-14_15-27-12Source: Bank of America

The first alarms that starter homes may be on their way out were sounded last March when Bank of America released its first Homebuyer Insights Report, which found that:

  • Seventy-five percent of first-time buyers would prefer to bypass the starter home and purchase a place that will meet their future needs, even if that means waiting to save more. Thirty-five percent want to retire there.


  • More Gen Xers than Millennials have put off purchasing their first home because of debt.


  • Young buyers’ goals are not urban hot spots by family-friendly suburbs. More than half (54 percent) of buyers are looking for a home in the suburbs, including 52 percent of first-time buyers.

Now the new Zillow Group Report on Consumer Housing Trends, which was released on Halloween, confirms the Bank of America findings. “When Millennials do become homeowners, they leapfrog the traditional “starter home” and jump into the higher end of the market by choosing larger properties with higher prices, similar to homes bought by older buyers. They pay a median price of $217,000 for a home—more than Baby Boomers, and just 11 percent less than Generation X. The Millennial median home size is 1,800 square feet, similar in size to what older generations buy,” Zillow found. At $217,99p per property that has a 1,800-foot floor plan, the youngest generation is paying almost the median price for a median-sized home today, far from the definition of a starter home.


read more…

http://www.realestateeconomywatch.com/2016/11/are-starter-homes-going-the-way-of-the-station-wagon/

Home builder confidence ends the year at highest point since 2005 | Mt Kisco Real Estate

Home builders saw a significant boost in confidence after President-elect Donald Trump won the election, according to the National Association of Home Builders/Wells Fargo Housing Market Index.

This increase brought builder sentiment up seven points to a level of 70, the index’s highest point since July 2005.

Just before the election, builder confidence held steady, holding the HMI level at 63.

“This notable rise in builder sentiment is largely attributable to a post-election bounce, as builders are hopeful that President-elect Trump will follow through on his pledge to cut burdensome regulations that are harming small businesses and housing affordability,” said NAHB Chairman Ed Brady, a home builder and developer.  “This is particularly important, given that a recent NAHB study shows that regulatory costs for home building have increased 29% in the past five years.”

Perhaps this is just the increase the industry needs to boost new home development for first-time buyers, something that First American Chief Economist Mark Fleming said will be a key player in 2017’s housing market.

“Though this significant increase in builder confidence could be considered an outlier, the fact remains that the economic fundamentals continue to look good for housing,” NAHB Chief Economist Robert Dietz said.

“The rise in the HMI is consistent with recent gains for the stock market and consumer confidence,” Dietz said. “At the same time, builders remain sensitive to rising mortgage rates and continue to deal with shortages of lots and labor.”

Derived from a monthly survey that NAHB has been conducting for 30 years, the index gauges builder perceptions of current single-family home sales and sales expectations for the next six months as good, fair or poor. The survey also asks builders to rate traffic of prospective buyers as high to very high, average or low to very low. Scores for each component are then used to calculate a seasonally adjusted index where any number over 50 indicates that more builders view conditions as good than poor.


read more…


Home builder confidence ends the year at highest point since 2005

Air Conditioning and Heating Systems in New Homes | Mt Kisco Real Estate

The US Census Bureau publishes information on characteristics of new homes started, including air conditioning and heating systems. Before trying to carry out air conditioning maintenance in your home or office, there are certain aspects of air conditioning systems you should know about. When their air conditioning system breaks down or develops a fault, many people try to fix it themselves without fully understanding the concepts involved. However, it is possible for you to carry out a basic air conditioner service once you understand the principles, although repairing hvac systems (heating, ventilation and air conditioning) is best left to the professionals such as an air conditioning repair contractor. If you have these devices at home you may end up needing ac repair Columbia SC to maintain it working properly, hire the best air conditioning repair company. Eco Plumbing has teh best 24 hour Eco Plumbing Heating and Air Conditioning in hackensack nj.

The normal home or office air conditioner works by simple physics, and consists of two discrete units: the condenser and the evaporator. In the condenser, Freon gas is put under pressure then passed through a heat exchanger, removing heat from the gas and converting it to a liquid. It is then passed through an expansion valve into the evaporator; the liquid Freon expands and evaporates to a gas, the latent heat needed for this coming from the environment, which is then cooled (the cooled air then being blown into the room). The gas heated by the higher room air temperature than goes back into the condenser where the heat is removed and the cycle continues. Both the evaporator and condenser are sealed units and you cannot carry out any air conditioner repairs to these yourself: you will have to call a trained professional. What you can do is to keep everything clean and all the mesh guards and so on clear of debris. You can carry out simple air conditioner service yourself, but not HVAC repair. Here are some basic air conditioner repair, troubleshooting and service tips. For more information regarding to AC repair service, Visit us at www.waychoffsac.com. Furthеr, thе heating оr air-conditioning contractor from hvacrepairquote.com аrе wеll trained аnd comply wіth professional HVAC procedures. It іѕ advisable tо contact thе established HVAC companies rаthеr thаn thе normal contractors. Here you can try bulldog air conditioning & heating for a free consultation.

The second step to achieve energy and HVAC system optimization is knowing your system. Your HVAC system is critical to your interior environment, but it also represents a large component of your utility expenses. While it is beyond the scope of this article to discuss every system, a few recommendations can be addressed. Every HVAC system component has increased in efficiency over the years. If your system is more than 13 years old, it’s time to begin planning for an upgrade to new equipment. Well maintained residential systems have a life expectancy of about 15 years or so but seem to fail at the worse times. Have a replacement plan ready for the day your equipment fails. You can check out JC’s Heating and Air here.

In 2015, approximately 93 percent of new homes started in the US had central AC. Central AC has been a common feature in new homes for some time, but its share did grow some between 2000 and 2015, going from 86 percent to 93 percent.

The share of new homes with central AC differs by Census Division (Figure 1). The New England and Pacific divisions, which have more temperate climates, have lower rates of central AC installed (73 percent and 69 percent in 2015, respectively). In contrast, in regions that are hotter and more humid, all or nearly all of the new homes started have central AC: for example, in the South Atlantic (100 percent), East South Central (100 percent), and the West South Central Divisions (99 percent).

ac

Heating Systems

According to a well known heating contractor, the majority of new homes started in 2015 have either a forced air system (55 percent) or an air or ground source heat pump system (42 percent). It requires A/C service, repair and installation. The share of new homes that have a heat pump has grown over time, going from 23 percent in 2000 to 42 percent in 2015. Meanwhile, the share with a forced air system has declined, going from 71 percent in 2000 to 55 percent in 2015.

Heat pumps are more prevalent in Southern regions where air and ground temperatures don’t fall as much (Figure 2): East South Central (75 percent), South Atlantic (74 percent), and West South Central (45 percent). They are less so in the West North Central (29 percent), Pacific (14 percent), Middle Atlantic (13 percent), Mountain (12 percent), East North Central (11) percent, and New England divisions (4 percent).

pumps

The majority of new homes started had their heating systems powered by either electricity (40 percent) or natural gas (55 percent) in 2015. In regions such as the Middle Atlantic and New England, where electricity tends to be more expensive, the share of new homes with systems powered by electricity is low (13 and 5 percent, respectively). On the other hand, systems powered by electricity are more common in the south: for example, the South Atlantic (72 percent), the East South Central (71 percent), and the West South Central (41 percent).

to read more…click here

http://eyeonhousing.org/2016/10/air-conditioning-and-heating-systems-in-new-homes/

New home sales unexpectedly rise in September | Mt Kisco Real Estate

– New U.S. single-family home sales unexpectedly rose in September, pointing to sustained demand for housing even as data for August was revised sharply down.

The Commerce Department said on Wednesday new home sales increased 3.1 percent to a seasonally adjusted annual rate of 593,000 units last month, pulling them close to a nine-year high touched in July.

August’s sales pace was revised down to 575,000 units from the previously reported 609,000 units.

Economists polled by Reuters had forecast single-family home sales, which account for about 9.8 percent of overall home sales, falling to a rate of 600,000 units last month.

New home sales, which are derived from building permits, are volatile on a month-to-month basis and subject to large revisions.

Sales increased 29.8 percent from a year ago. They rose in the third quarter compared to the April-June period, indicating strong demand for housing.

Residential construction, however, likely remained a drag on gross domestic product in the third quarter.

Despite rising demand for housing, home building has been lagging, with builders complaining about land and labor shortages. Demand is being driven by rising wages as the labor market nears full employment, as well as by very low mortgage rates.

New single-family homes sales surged 33.3 percent in the Northeast and soared 8.6 percent in the Midwest last month.

Sales in the South, which accounts for more than half of new home sales, climbed 3.4 percent.

Sales fell 4.5 percent in the West, which has seen a sharp increase in home prices amid tight inventories.


read more…


http://www.reuters.com/article/us-usa-economy-newhomesales-idUSKCN12Q1VJ?il=0

Home Improvements Push Residential Construction Spending Up | Mt Kisco Real Estate

NAHB analysis of Census Construction Spending data shows that total private residential construction spending for July registered a seasonally adjusted rate of $445.5 billion, slightly up from the June downwardly revised estimate.

The monthly gains are largely attributed to the strong growth of private construction spending on home improvements that rose to a seasonally adjusted annual rate of $147.5 billion in July, up by 1.5% since last month. Meanwhile, spending on single-family and multifamily both declined in July. Single-family spending edged down to $238.1 billion in July, down 0.2% over the revised June estimate. After hitting the record-breaking highs earlier this year, multifamily spending decreased to $59.8 billion, down by 0.6% since June. On an annual basis, however, multifamily spending increased by 19.8%. Single-family spending was also 1.7% higher since July 2015.

The NAHB construction spending index, which is shown in the graph below (the base is January 2000), illustrates the strong growth in new multifamily construction since 2010, while new single-family construction and home improvements spending have drifted upward at a more modest pace. NAHB anticipates growth for new single-family spending over the rest of 2016, consistent with the modest rise in single-family starts.

Slide1

The pace of private nonresidential construction spending rose 1.7% on a monthly basis, and was 7.1% higher than the July 2015 estimate. The largest contribution to this year-over-year nonresidential spending gain was made by the class of office (30.3% increase), followed by lodging (28.0% increase) and commercial (13.5% increase).

Slide2

read more….

http://eyeonhousing.org/2016/09/home-improvements-push-residential-construction-spending-up/

1 Million Rentals on Craigslist | Mt Kisco Real Estate

Craigslist, with its drab gray interface and homemade classifieds, has become the single largest information exchange about the rental housing market in the United States. Its digital bulletin boards have everything: apartment porn for places you’ll never afford, weird fish-eye photos by amateur landlords, queries for every conceivable living space from a spare bunk to a full-sized mansion.

The site touches both the high and low ends of the market — the mom-and-pop operation and the professionally run high-rise — across hundreds of locations. And so Craigslist effectively has more pricing information than commercial providers of rental data do — and offers a more real-time look at the housing market than does the Census Bureau.

“We were looking for something more comprehensive, fresher in time, and smaller in spatial scale,” said Geoff Boeing, a PhD candidate in the Department of City and Regional Planning at the University of California at Berkeley. “Craigslist seemed like an obvious candidate.”

Boeing and Paul Waddell of the Urban Analytics Lab at Berkeley scraped millions of listings off the site from the summer of 2014. The data they sorted, described in new research — and mapped below — reveals some familiar patterns: New York, the Bay Area, Boston and energy-booming North Dakota have the highest median rents on offer in the country (in the map, red is the most expensive per square foot). And many of these same markets have a paltry share of listings at price points that would be affordable to moderate-income households.

But the data also gives a fascinating look at the whole spectrum of offerings in each Craigslist market. In this graph from the research, each line represents a single metropolitan area, with its distribution of listings ranging from the cheapest at the left to the most expensive at right ($4 per square foot would be the equivalent of a 1,000-square-foot rental for $4,000 a month, which is not uncommon in New York). The lines peak at the most common per-square-foot price point in each area. As with the above map, the markets with the highest median rents are red; those with the lowest are blue and purple:

That picture shows that affordable cities have more compressed rental markets on Craigslist, while the distance between high- and low-end units in expensive cities is much wider. Detroit is narrow and spiky. New York is low and stretched out. Detroit’s pricey units are not that pricey, and that segment of the market is much smaller.

Put another way: If you have a little extra money to spend on rent in Detroit, it will get you a lot more than in New York, bumping you from near the bottom to the top of the market more easily.

In the Bay Area (which Craigslist defines much more broadly than just the city of San Francisco, encompassing San Jose, Santa Cruz, Oakland and outlying suburbs), there are hardly any units available at the per-square-foot prices that cover most of the Atlanta-area market:

Across all these places, the correlation is striking between the typical rent in a given market and the degree to which the market is compressed.

“We didn’t know what the pattern would look like,” Boeing said. “We didn’t expect it to be so clear.”

This pattern also illustrates why moderate-income households — and even middle-class ones — have such a hard time finding affordable units in expensive cities. There just isn’t much on offer at cheaper prices. And this pattern implies that a subsidy like housing vouchers in low-cost cities may have a lot more power to lift the poor into higher-quality units and safer neighborhoods.

These pictures are not perfectly representative of the entire rental market in each region. Like census rental data, which lags in time, and commercial data, often drawn from large apartment buildings, Craigslist has its limits as a window into the housing market. It may exclude landlords uncomfortable with the Internet (or who believe their potential tenants might be). It captures only asking prices, not agreed-upon rents, so it doesn’t reveal the effect of bidding wars that might drive up rents in high-cost cities.

And the quality of the data is better in some markets than others. The listings in Seattle and Los Angeles, Boeing and Waddell found, tend to have more complete information. In Chicago and New York, listings are more likely to be posted multiple times. New York’s rental market is alsoheavily influenced by brokers, meaning units are less likely to wind up on Craigslist.

Boeing and Waddell originally scraped about 11 million listings off the site, covering everything posted in all the U.S. sub-domains between May and July of 2014. But by the time they deleted duplicate listings and inevitable Craigslist spam (“Apartment of $1!”), and sorted for only units with clear price and square footage data and geolocation, they were down to about 1.5 million listings nationwide.


read more….


https://www.washingtonpost.com/news/wonk/wp/2016/09/01/what-more-than-1-million-craigslist-rental-listings-tell-us-about-the-housing-market/