Tag Archives: Katonah Real Estate for Sale

Hottest U.S. Real Estate Markets for September | Katonah Real Estate

Hottest markets for September 2016

Mindy_Nicole_Photography/iStock; uschools/iStock
jjwithers/iStock; Aneese/iStock; Greg Chow

September would ordinarily be the end of the high season for residential real estate, with schools back in session across the U.S. and families reluctant to uproot. But hold on—this is no ordinary year, and a preliminary review of the month’s data on realtor.com®shows that September is shaping up to be the hottest fall in a decade.

Homes for sale in September are moving 4% more quickly than last year, and that’s even as prices hit record highs. The median home price maintained August’s level of $250,000, which is 9% higher than one year ago. That’s a new high for September.

“The fundamental trends we have been seeing all year remain solidly in place as we enter the slower time of the year,” says realtor.com’s chief economist, Jonathan Smoke. That means short supply and high demand, which results in high prices.

Granted, September saw a bit of the typical seasonal slowdown, with properties spending five more days on market (77) than last month—but that’s still three days faster than last year at this time. At the same time, fewer homes are coming on the market, further diminishing supply. Total inventory remains considerably lower than one year ago, leaving buyers with fewer options in a market that has already been pretty tight.

In gauging which real estate markets were seeing the most activity, our economic data team took into account the number of days that homes spend on the market (a measure of supply) and the number of views that listings on our site get (a measure of demand). The result is a list of the nation’s hottest real estate markets, where inventory moves 23 to 43 days more quickly than the national average, and listings get 1.4 to 3.7 more views than the national average.

New to the top 20 this month is Grand Rapids, MI. Like other cities on the list, “Grand Rapids” includes the greater metropolitan area, which in this case takes in Wyoming, MI. Similarly, our No. 1 market, “San Francisco,” also includes nearby Oakland and Hayward.

The hot list

Rank
(September)
20 Hottest MarketsRank
(August)
Rank Change
1San Francisco, CA43
2Vallejo, CA1-1
3Denver, CO30
4Dallas, TX2-2
5San Diego, CA61
6Stockton, CA5-1
7Fort Wayne, IN114
8Sacramento, CA102
9San Jose, CA102
10Waco, TX145
11Modesto, CA132
12Columbus, OH7-5
13Yuba City, CA12-1
14Detroit, MI9-5
15Santa Rosa, CA194
16Colorado Springs, CO160
17Santa Cruz, CA170
18Kennewick, WA180
19Nashville, TN201
20Grand Rapids, MI211


read more…


The Hottest U.S. Real Estate Markets for September 2016

30-Year Fixed-Rate Mortgage Hits 10 Week Low | Katonah #RealEstate

Freddie Mac (OTCQB: FMCC) today released the results of its Primary Mortgage Market Survey® (PMMS®), showing the average 30-year fixed mortgage rate falling as the FOMC decided to leave short term rates unchanged.

News Facts

  • 30-year fixed-rate mortgage (FRM) averaged 3.42 percent with an average 0.5 point for the week ending September 29, 2016, down from last week when it averaged 3.48 percent. A year ago at this time, the 30-year FRM averaged 3.85 percent.
  • 15-year FRM this week averaged 2.72 percent with an average 0.5 point, down from last week when it averaged 2.76 percent. A year ago at this time, the 15-year FRM averaged 3.07 percent.
  • 5-year Treasury-indexed hybrid adjustable-rate mortgage (ARM) averaged 2.81 percent this week with an average 0.4 point, up from last week when it averaged 2.80 percent. A year ago, the 5-year ARM averaged 2.91 percent.

Average commitment rates should be reported along with average fees and points to reflect the total upfront cost of obtaining the mortgage. Visit the following link for the Definitions. Borrowers may still pay closing costs which are not included in the survey.

Quote
Attributed to Sean Becketti, chief economist, Freddie Mac.

“Investors flocked to the safety of government bonds causing the 10-year Treasury yield to continue its descent following the FOMC’s decision to leave rates unchanged. The 30-year fixed-rate mortgage responded by dropping 6 basis points before landing at 3.42 percent — a ten-week low. The course of the economy is uncertain, yet consumers continue to be a bright spot. The September consumer confidence index is up 3 percent to 104.1, exceeding forecasts and reaching a new cycle high.”

Single family home sales fall 7.6% | Katonah Real Estate

United States New Home Sales  

Sales of new single-family houses in the United States fell 7.6 percent to a seasonally adjusted annual rate of 609,000 in August of 2016, better than market expectations of an 8.8 percent decline. Figures for the previous month were revised up by 5,000 to 659,000, the highest since 2007. New Home Sales in the United States averaged 652.45 Thousand from 1963 until 2016, reaching an all time high of 1389 Thousand in July of 2005 and a record low of 270 Thousand in February of 2011. New Home Sales in the United States is reported by the U.S. Census Bureau.

United States New Home Sales
read more….
http://www.tradingeconomics.com/united-states/new-home-sales


Housing starts up 12.36%, down in Northeast | Katonah Real Estate

New Housing Units Started

(Seasonally adj. at Annual Rate, in % Y/Y)

On May 2016 Total housing units starts were at seasonally adjusted annual rate of 1,164,000 units, an decrease of 8,000 units or -0.68 % from 1,172,000 units April 2016 and an increase of 12.36 % from 1,036,000 units May 2015.

New Housing Units Started
(Seasonally adj. at Annual Rate, in % Y/Y)
May 2016
prel.
April 2016
prel.
March 2016
prel.
Feb. 2016
prel.
Jan. 2016
prel.
Total12.36 %0.6 %18.68 %35.23 %4.35 %
In structures Single-family units12.35 %8.21 %21.84 %42.5 %11.19 %
In structures with 2 – 4 units95.71 %16.67 %-57.14 %71.43 %260 %
In structures with 5 units or more-2.09 %-12.85 %17.42 %19.87 %-11.61 %
Northeast-41.01 %-29.1 %43.56 %70.21 %37.04 %
Midwest33.56 %12.65 %21.43 %117.53 %0.65 %
South23.84 %18.23 %8.43 %19.07 %9.87 %
West6.72 %-18.69 %29.85 %29.71 %-15.75 %

#Emotions influence the homes we choose | Katonah Real Estate

It’s a fact of life: Homes come with far more emotional weight than any other investment we make.

A home is a refuge from the world, a place to raise a family and, for some people, an investment they hope will bring them a good chunk of money down the road. We fall in love with houses in a way that we never fall in love with a portfolio of stocks and bonds.

All too often, though, we don’t realize that how we feel about homes blinds us when it comes time to buy or sell. We let our emotions blind us to cold facts about the market or the realities of ownership. Or we prioritize one set of emotional needs over others that are just are strong but may not be evident at first. And ignoring them can lead us to make bad financial decisions that can affect us for decades to come.

For instance, people might focus on their desire for a house that’s a certain size or style, but ignore the fact that they want to spend as much time as possible with family. So they might buy a “perfect” house that requires them to make a long daily commute to work and keeps them away from home for two extra hours each day.

The home-selling side of the equation brings its own set of thorny issues. Homeowners often have an overly rosy view of their home and expect it to increase in value far beyond reasonable expectations. And when they put it on the market, they often stubbornly cling to their asking price—even if it means leaving it up for sale far longer than they planned, and risking the possibility of not selling it at all.

Here’s a closer look at some psychological missteps that buyers and sellers often make as they wade into the housing market.

Ignoring the big picture

Home buyers are always on the lookout for features—like a longer driveway or bigger backyard—that will make them happier with their home. But people don’t realize that those changes may not make them happier with their life as a whole.

“When people move to better housing, they think they will be a lot happier overall,” says Shige Oishi, a co-author of a 2010 study on the subject in Social Indicators Research. “When they actually move, however, their overall happiness does not often change because there are many trade-offs in moving.”

One of the biggest trade-offs is commuting. Many move to live in a bigger house, but that bigger house is often farther away from work — so that means more commuting, which tends to add stress and detract from overall happiness. A 2008 study in the Scandinavian Journal of Economics shows that people who had longer commutes reported “lower subjective well-being” than those with shorter commutes. “If you’re moving to a place far away from your friends, but it has nicer stuff, it’s not a great deal for your happiness,” says Elizabeth Dunn, a psychology professor at the University of British Columbia.

In another study in the Personality and Social Psychology Bulletin, Dunn and her co-authors explored the matter of expectations vs. reality in another way — by looking at Harvard undergraduates who were randomly assigned to different dormitories. The study showed that first-year students incorrectly predicted what would bring them the most satisfaction from their dorms — physical features like location on campus, the attractiveness of the residence, room size and desirability of the dining hall and facilities.

In the initial survey, the students put no weight on social features, such as relationships with roommates and a sense of community in the residence. But when the researchers checked back in with the students after they’d been living in their dorms, the only thing that appeared to matter for their happiness was the quality of the social factors.

“It’s so easy to get caught up in comparing the physical features of the places you’re looking at,” says Dunn, “but you should really stop to consider how the places you’re considering will shape your social relationships.”

Overlooking big expenses

People who are buying homes tend to compartmentalize their expenses and not add up the total cost of everything needed to fix up and furnish the house, says Alex Tabarrok, a professor of economics at George Mason University. That can lead them to make poor choices about how much to pay for a home. For instance, they may overspend on a down payment for the house itself and leave themselves without enough money to buy the sort of decorations or furniture that they want. “When you’re getting a house, think about furnishing it at the same time,” says Tabarrok.


read more…


http://www.marketwatch.com/story/

US Housing starts flat | Katonah Real Estate

Housing Starts in the United States is expected to be 1163.61 Thousand by the end of this quarter, according to Trading Economics global macro models and analysts expectations. Looking forward, we estimate Housing Starts in the United States to stand at 1193.24 in 12 months time. In the long-term, the United States Housing Starts is projected to trend around 1213.00 Thousand in 2020, according to our econometric models.

United States Housing Starts
ForecastActualQ2/16Q3/16Q4/16Q1/172020Unit
Housing Starts116411641175118411931213Thousand
United States Housing Starts Forecasts are projected using an autoregressive integrated moving average (ARIMA) model calibrated using our analysts expectations. We model the past behaviour of United States Housing Starts using vast amounts of historical data and we adjust the coefficients of the econometric model by taking into account our analysts assessments and future expectations. The forecast for – United States Housing Starts – was last predicted on Friday, June 17, 2016.
read more….
http://www.tradingeconomics.com/united-states/housing-starts/forecast

30 Year Mortgage rates average 3.57% | Katonah Real Estate

Freddie Mac (OTCQB: FMCC) today released the results of its Primary Mortgage Market Survey® (PMMS®), showing average fixed mortgage rates falling for the third consecutive week following disappointing April employment data. Mortgage rates are at their low point for the year.

News Facts

  • 30-year fixed-rate mortgage (FRM) averaged 3.57 percent with an average 0.5 point for the week ending May 12, 2016, down from last week when it averaged 3.61 percent. A year ago at this time, the 30-year FRM averaged 3.85 percent.
  • 15-year FRM this week averaged 2.81 percent with an average 0.5 point, down from last week when it averaged 2.86 percent. A year ago at this time, the 15-year FRM averaged 3.07 percent.
  • 5-year Treasury-indexed hybrid adjustable-rate mortgage (ARM) averaged 2.78 percent this week with an average 0.5 point, down from last week when it averaged 2.80 percent. A year ago, the 5-year ARM averaged 2.89 percent.

Average commitment rates should be reported along with average fees and points to reflect the total upfront cost of obtaining the mortgage. Visit the following link for theDefinitions. Borrowers may still pay closing costs which are not included in the survey.

Quote
Attributed to Sean Becketti, chief economist, Freddie Mac.

“Disappointing April employment data once again kept a lid on Treasury yields, which have struggled to stay above 1.8 percent since late March. As a result, the 30-year mortgage rate fell 4 basis points to 3.57 percent, a new low for 2016 and the lowest mark in 3 years. Prospective homebuyers will continue to take advantage of a falling rate environment that has seen mortgage rates drop in 14 of the previous 19 weeks.”

Sales of unbuilt homes hover near a 10-year high | Katonah Real Estate

The latest new home sales report presents a more positive forecast on the future of today’s current inventory crisis after several industry reports give strong concerns over the market’s daunting lack of inventory.

In Trulia Chief Economist Ralph McLaughlin’s analysis of Wednesday’s new home sales report, he explained that the share of new home sales not started, in other words homes purchased off a plan, hovers near a 10-year high.

“Why? The inventory of existing homes continues to fall. Low existing inventory likely pushes prospective buyers away from existing homes towards new homes, and as new home sales rise, this allows builders to sell more new homes off plan,” McLaughlin said.

Click to enlarge

new home sales one

(Source: Trulia Chief Economist Ralph McLaughlin)

The housing market can’t seem to get past the inventory shortage that keeps penetrating into all crevasses of the industry. And while this won’t change this year, there may be hope for next year as builders start to play catch-up, a Fitch Ratings report recently said.

The National Association of Realtors’ latest report posted that in January, total existing-home sales, which are completed transactions that include single-family homes, townhomes, condominiums and co-ops, slightly increased 0.4% to a seasonally adjusted annual rate of 5.47 million, up from a downwardly revised 5.45 million in December.

“The housing market has shown promising resilience in recent months, but home prices are still rising too fast because of ongoing supply constraints,” Lawrence Yun, NAR chief economist, said on the existing-home sales report.

The latest S&P/Case-Shiller report echoed similar inventory concerns, with Zillow Chief Economist Svenja Gudell commenting on it saying, “There are a lot of economic forces at work behind the scenes that will have a big impact on housing as we enter the busy home-shopping season. Low inventory is a factor in almost every market, so buyers should be prepared for a limited selection in the months to come.”

According to the U.S. Census Bureau and the Department of Housing and Urban Development report, sales of new single-family houses in January 2016 were at a seasonally adjusted annual rate of 494,000. This is 9.2% below the revised December rate of 544,000 and is 5.2% below the January 2015 estimate of 521,000.

However, McLaughlin cautioned, “All new home sales numbers from the U.S. Census are extremely volatile: the margin of error is wide and often includes zero, which means we can’t be certain whether the month-over-month or year-over-year changes actually increased, decreased, or stayed flat.”


read more…


Can new home sales end the housing inventory crisis?

Boomers Prefer Suburbs and Cul de Sacs | Katonah Real Estate

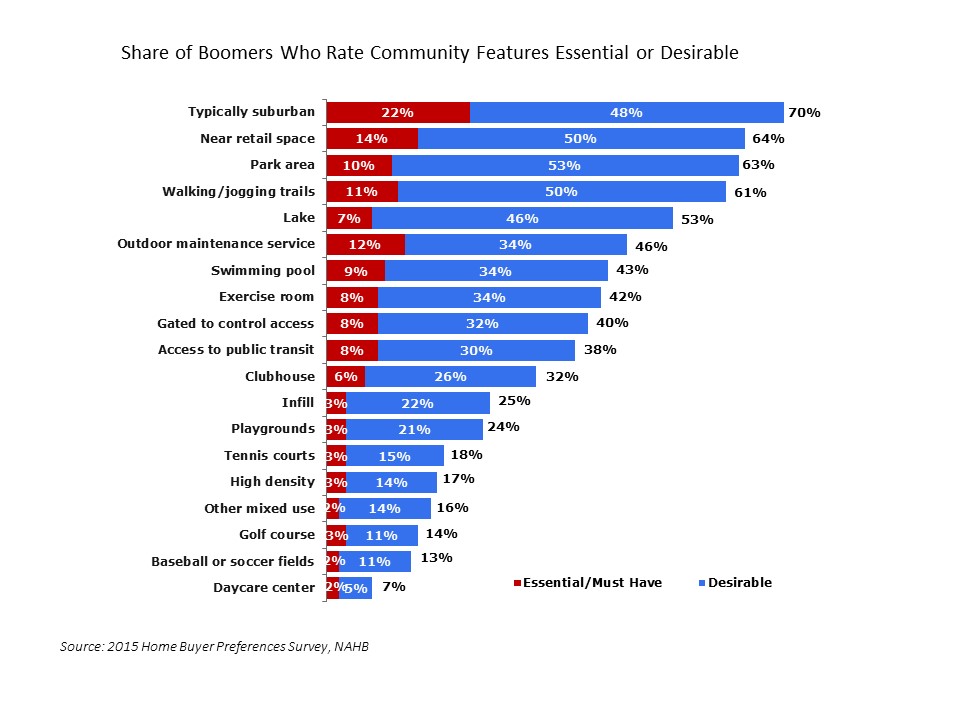
NAHB’s recently published Housing Preferences of the Boomer Generation shows that homebuyers in the Baby Boom Generation want a suburban neighborhood consisting of all single-family detached homes more often than any other community feature (of the 19 listed), and nearly 80 percent prefer a cul de sac over efficient traffic flow when given the choice.

These results are based on a survey conducted by NAHB in September 2015 that collected data from 4,326 recent and prospective homebuyers, stratified and weighted to be representative of the age, geography, income, and race and ethnicity of homeowners in the U.S.  Although the published study emphasizes housing preferences of Boomers (those born from 1946 to 1964), for comparison purposes the survey also captured buyers in other generations (including Millennials born in 1980 or later, Gen X’ers born 1965 to 1979, and Seniors born in 1945 or earlier).

Among other things, the survey asked buyers to rate 19 community features on the following four-tier scale:

  • Do not want – not likely to buy a home in a community with this feature.
  • Indifferent – wouldn’t influence decision.
  • Desirable – would be seriously influenced to purchase a home because this design or feature was included.
  • Essential/Must have – unlikely to purchase a home in a community unless it has this feature.

For home buyers in the Boomer generation, the most desired of these features is a “typically suburban” community (defined as consisting of all single-family detached homes) rated desirable or essential by 70 percent of Boomer respondents.  After that comes a group of three community features rated essential or desirable by 61 to 64 percent of Boomers: being near retail space, a park area and walking/jogging trails.

Boomer Pref Fig 01A

At the other end of the scale, tennis courts, high density (defined as smaller lots and attached/ or multifamily buildings), other mixed use (homes near office or other commercial buildings, to distinguish it from homes near retail space like grocery or drug stores), a golf course, baseball or soccer fields, and daycare center are relatively unpopular, each being rated essential or desirable by fewer than one-fifth of Boomers.

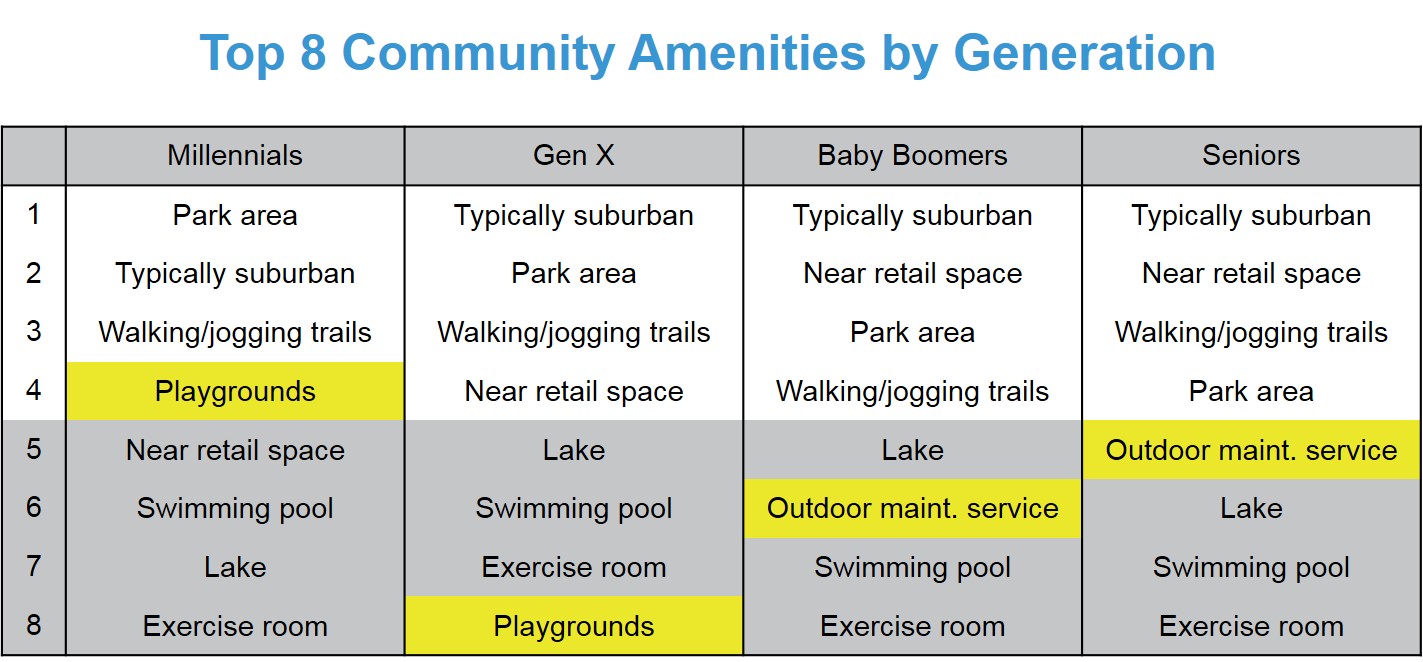
Compared to buyers in other generations there are many similarities in the way Boomers rank the top community features.  Seven community features (typically suburban, park area, near retail space, walking/jogging trails, a lake, swimming pool, and exercise room) make the top eight irrespective of the home buyer’s age.

Top 8 by Gen

The main generational differences in the rankings are 1) playgrounds are particularly important for buyers in the Millennial generation, but fall entirely out of the top eight for Boomers and Seniors; and 2) an outdoor maintenance service becomes relatively more important for older buyers, moving all the way up to number five on the list for Seniors.

 Another section of the NAHB survey asked home buyers about street design trade-offs, which can be useful in helping inform land planning decisions.  A number of advocacy groups (e.g., the National Complete Streets Coalition) recommend interconnected streets for efficent traffic flow, implying that designs like cul de sacs that seek to limit through traffic should be avoided.  But home buyers in the Boomer generation have the opposite opinion: 78 percent prefer the cul de sac or other street design with limited traffic flow—more than triple the 22 percent who prefer the alternative of a home on a continuous street with more efficient traffic flow.


read more…


Boomers Prefer Suburbs and Cul de Sacs

No Relief in Sight on Rents | Katonah NY Real Estate

The long anticipated slowdown in rent increases from record numbers of new multi-family projects opening for business has yet to materialize as rental demand drove rents to record levels in the first three quarters of 2015, sending the national apartment market soaring to its strongest year in a decade.

According to data from Axiometrics, a specialist in apartment market research and analysis:

  • Annual effective rent growth of 4.7% in the fourth quarter of 2015 represented a 7-basis-point (bps) increase from the figure of one year earlier (also rounded to 4.7%), though it was 35 bps lower than the 5.2% of the third quarter of 2015. The fourth-quarter rate is the highest year-end figure since 2005, when effective rent growth was 5.8%.
  • Rent growth has been 4.7% or above for five straight quarters, even though a three-quarter streak of at least 5.0% growth was broken. Never in Axiometrics’ 20-year history has annual effective rent growth been at 4.7% or above for such a long period.
  • Quarter-over-quarter effective rent growth was -0.6% in the fourth-quarter, continuing a trend of negative rent growth at the end of the year. That rate was a 32-bps decrease from the 0.3% reported in 4Q14 and marked the only quarter of 2015 in which the rent-growth rate decreased from the corresponding quarter of 2014. It should be noted that quarter-to-quarter rent growth is normally negative in the fourth quarter due to seasonality.
  • Average national rent was $1,244 for the fourth quarter of 2015, a $54 increase from the average of $1,188 in the fourth quarter of 2014.
QUARTERLY EFFECTIVE RENT GROWTH
Quarter2012201320142015
First0.6%0.4%0.5%0.9%
Second2.2%2.1%2.7%2.7%
Third1.3%1.2%1.7%2.0%
Fourth-0.6%-0.9%-0.3%-0.6%
 Source: Axiometrics Inc.


“Quarters 1-3 were the most robust period we have seen since before the Great Recession,” said Jay Denton, Axiometrics’ Senior Vice President of Analytics. “Much of the fourth-quarter moderation can be attributed to several Western markets that experienced double-digit rent growth for most of the year but could not sustain that pace.”

Denton added, “Those markets remain quite strong at 6% and higher rent growth. Axiometrics forecasted those metros to moderate, and they did late in the year. As expected, they remained among the top markets for rent growth despite the deceleration late in the year.”

In other metrics:

  • Occupancy was 95.0% in the fourth quarter, the highest 4Q rate since the 95.9% at the end of 2000. The 4Q15 rate was 38 bps lower than the 95.3% of 3Q15, but 10 bps higher than the 94.9% of 4Q14.
  • Annual effective rent growth was positive in 49 of Axiometrics’ top 50 markets, based on number of units. Only Oklahoma City was negative, at -0.6%. Two metros, Portland, OR (12.0%) and Oakland (11.3%), ended the year with double-digit rent growth.

Portland Remains No. 1 for Rent Growth

In the third quarter, Portland replaced Oakland as the metro with the highest annual effective rent growth among Axiometrics’ top 50 markets, and Oregon’s most populous area retained that distinction in the fourth quarter.

Oakland maintained the No. 2 position, but its Bay Area neighbors dropped in the rankings. San Francisco and San Jose, Nos. 3 and 5 last quarter, were Nos. 7 and 9 in the fourth quarter. California placed seven metros in the fourth-quarter top 25, including No. 3 Sacramento and No. 6 San Diego, while Florida placed five, including No. 5 Orlando.


read more….


http://www.realestateeconomywatch.com/2016/01/no-relief-in-sight-on-rents/