Tag Archives: Katonah NY Homes

Katonah NY Homes

30 Year Mortgage rates average 3.57% | Katonah Real Estate

Freddie Mac (OTCQB: FMCC) today released the results of its Primary Mortgage Market Survey® (PMMS®), showing average fixed mortgage rates falling for the third consecutive week following disappointing April employment data. Mortgage rates are at their low point for the year.

News Facts

  • 30-year fixed-rate mortgage (FRM) averaged 3.57 percent with an average 0.5 point for the week ending May 12, 2016, down from last week when it averaged 3.61 percent. A year ago at this time, the 30-year FRM averaged 3.85 percent.
  • 15-year FRM this week averaged 2.81 percent with an average 0.5 point, down from last week when it averaged 2.86 percent. A year ago at this time, the 15-year FRM averaged 3.07 percent.
  • 5-year Treasury-indexed hybrid adjustable-rate mortgage (ARM) averaged 2.78 percent this week with an average 0.5 point, down from last week when it averaged 2.80 percent. A year ago, the 5-year ARM averaged 2.89 percent.

Average commitment rates should be reported along with average fees and points to reflect the total upfront cost of obtaining the mortgage. Visit the following link for theDefinitions. Borrowers may still pay closing costs which are not included in the survey.

Quote
Attributed to Sean Becketti, chief economist, Freddie Mac.

“Disappointing April employment data once again kept a lid on Treasury yields, which have struggled to stay above 1.8 percent since late March. As a result, the 30-year mortgage rate fell 4 basis points to 3.57 percent, a new low for 2016 and the lowest mark in 3 years. Prospective homebuyers will continue to take advantage of a falling rate environment that has seen mortgage rates drop in 14 of the previous 19 weeks.”

US Mortgage Apps surge 25% | Katonah Real Estate

Applications for U.S. house mortgages surged 25.5 percent in the week ended October 2nd, 2015, rebounding from a 6.7 percent fall in the previous period and posting the highest gain since-mid January as many applications were filled prior to the TILA-RESPA regulation took effect on October 3rd, introducing changes to the mortgage process. In addition, fixed 30-year mortgage rates averaged 3.99 percent, the lowest in five months. Refinancing applications soared 24.2 percent and purchase applications went up 27.4 percent. Mortgage Applications in the United States averaged 0.54 percent from 2007 until 2015, reaching an all time high of 49.10 percent in January of 2015 and a record low of -38.80 percent in January of 2009. Mortgage Applications in the United States is reported by the Mortgage Bankers Association of America.


ActualPreviousHighestLowestDatesUnitFrequency
25.50-6.7049.10-38.802007 – 2015percentWeekly
SA
Mortgage Applications measure the change in the number of new applications for mortgages backed by the Mortgage Bankers Association during the reported week. Mortgage applications include both refinancing and home purchasing. This page provides – United States MBA Mortgage Applications – actual values, historical data, forecast, chart, statistics, economic calendar and news. Content for – United States MBA Mortgage Applications – was last refreshed on Wednesday, October 7, 2015.
read more….
http://www.tradingeconomics.com/united-states/mortgage-applications

Boost Your All-White Color Scheme | Katonah Real Estate

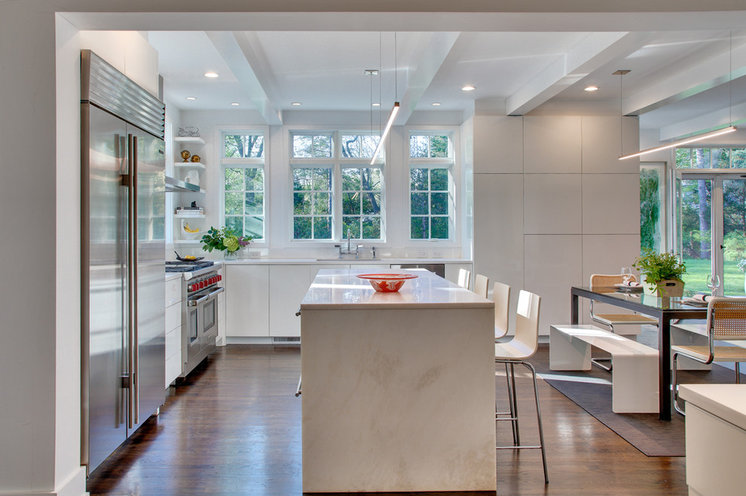
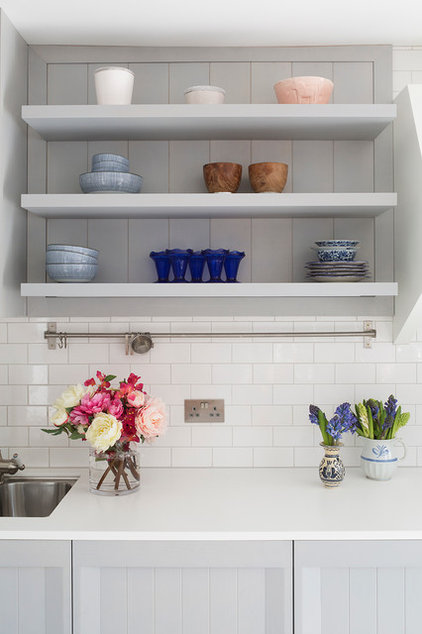
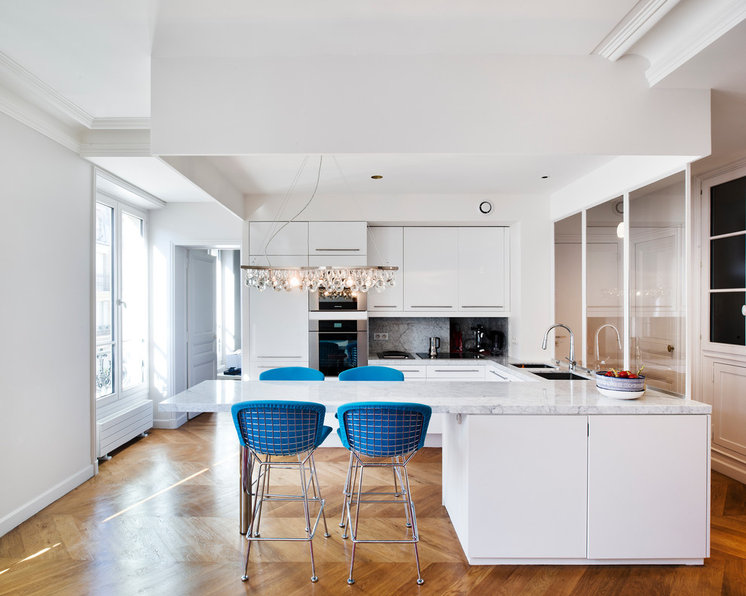
Love the look of fresh white but don’t want to feel like you live in a cold, minimalist compound? Here’s how to boost white to get a livable, inviting look that feels airy, open and full of personality.

Manhattan Studios Rentals Set Record | Katonah Real Estate

Manhattan’s smallest apartments are fueling big gains in rents.

The median rent in the borough jumped 8.9 percent last month to $3,375, according to a report Thursday by appraiser Miller Samuel Inc. and brokerage Douglas Elliman Real Estate. Costs for studio apartments climbed 10 percent to a median $2,351, while rents for one-bedrooms rose 9.4 percent to $3,400, both the highest in more than seven years of record-keeping.

New York’s smaller apartments are luring new tenants entering an improving job market in the city, as well as those who can’t afford bigger homes. Would-be buyers who have been shut out of owning because of high prices and tight credit are also lingering as renters of studio apartment options.

“The studio and one-bedroom market is the more common jumping-off point for first-time buyers,” said Jonathan Miller, president of Miller Samuel and a Bloomberg View contributor. Rents are rising “because of the logjam that has been created by people who have either been priced out of the purchase market or don’t qualify for a mortgage.”

Manhattan apartment prices jumped to the highest since their 2008 peak in the fourth quarter as buyers competed for a limited supply of homes. Demand was greatest for one-bedroom apartments, which accounted for 38 percent of all sales last quarter, Miller said.

A strengthening job market is also fueling housing demand. New York City’s private sector added 112,300 jobs in the 12 months through January, and the unemployment rate fell to 7.1 percent that month from 8.3 percent a year earlier, the New York State Labor Department said Tuesday.

More Affordable

While employment is improving, incomes aren’t rising as fast as Manhattan rents, leading tenants to seek affordability by finding smaller spaces, Gary Malin, president of brokerage Citi Habitats, said in an interview.

“Smaller apartments are drawing more attention because there’s more of an appetite for those price points if there’s only a certain amount of money you can afford to spend,” Malin said.

Citi Habitats, which also released a report today on the Manhattan rental market, said the average rent for a studio increased 5 percent in February from a year earlier to $2,150. Rents for one-bedroom units climbed 3 percent to $2,893.

Rents declined at the higher end of the market. Two-bedroom units fell 2 percent to $3,957, and three-bedrooms dropped 1 percent to $5,133, Citi Habitats said.

Read more….

http://www.bloomberg.com/news/articles/2015-03-12/manhattan-studios-set-rent-record-as-tenants-go-small

1.8 Million Bubble-Era HELOCS Could Bust | Katonah Real Estate

More than half, 56 percent, of the 3.3 million Home Equity Lines of Credit scheduled to reset over the next four years with fully amortizing monthly payments replacing interest-only payments are on properties that are seriously underwater, according to a new report from RealtyTrac.

With no equity remaining in the Bubble-era HRLOCs, the risk is high that the resets will trigger widespread foreclosures as owners struggle to meet the higher monthly payments.

A total of 3,262,036 HELOCs with an estimated total balance of $158 billion that originated during the housing price bubble between 2005 and 2008 are still open and scheduled to reset between 2015 and 2018. Of these, 1,834,588 (56 percent) are on residential properties that are seriously underwater, meaning the combined loan to value ratio of all outstanding loans secured by the property is 125 percent or higher.

“Homes purchased or refinanced near the peak of the housing bubble between 2005 and 2008 are much more likely to still be underwater despite the strong recovery in home prices over the last three years,” said Daren Blomquist, vice president at RealtyTrac. “Furthermore, many homeowners with HELOCs who have positive equity likely already refinanced to mitigate the payment shock from a resetting HELOC — an option not readily available for homeowners still underwater.

“While these underwater homeowners experiencing payment shock from resetting HELOCs are at higher risk for default, the good news is that we’ve already seen a large wave of more than 700,000 resetting HELOCs in 2014 without a corresponding wave of defaults,” Blomquist noted. “The bad news is that a much lower 40 percent of those 2014 HELOC resets were on seriously underwater homes. We are entering a period of higher risk over the next four years when it comes to resetting bubble-era HELOCs — especially given slowing home price appreciation that offers underwater homeowners less hope of recovering their equity in the short term.”


HELOCS

States with most HELOC resets are California, Florida, Illinois, Texas and New Jersey

With 645,872 HELOCs scheduled to reset over the next four years, California led the way among the states in terms of sheer volume of resetting HELOCs. A total of 423,706 (66 percent) of those resetting HELOCs in California are on homes still seriously underwater, and the average monthly payment increase on HELOCs resetting in California over the next four years is $215.

Florida had the second highest number among all states of resetting HELOCs over the next four years, with 513,229, followed by Illinois with 158,199. In both Florida and Illinois, seriously underwater homes backed 71 percent of the resetting HELOCs over the next four years.

Texas had the fourth highest number of resetting HELOCs with 158,017 over the next four years — 36 percent of which were on seriously underwater homes, and New Jersey had the fifth highest number of resetting HELOCs with 145,312 over the next four years — 47 percent of which were on seriously underwater homes.


read more…


http://www.realestateeconomywatch.com/2015/03/1-8-million-bubble-era-helocs-could-bust/

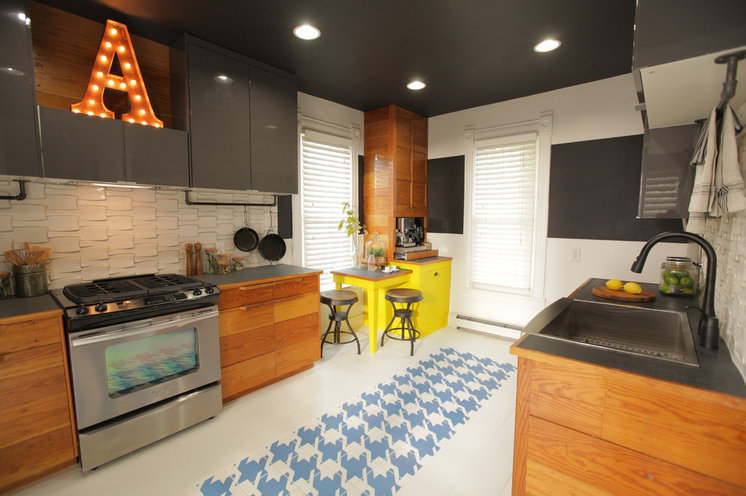
Mixing Vintage and Modern in an Urban Family Kitchen | South Salem Real Estate

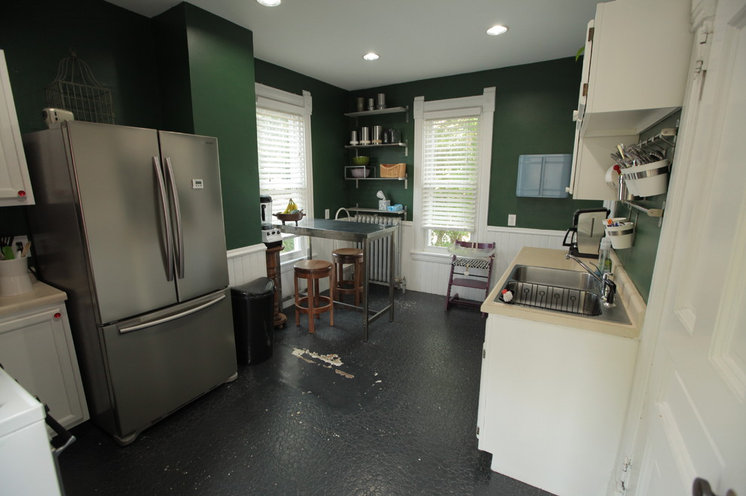
Emily and Ian Allison’s kitchen looked like it was thrown together on a whim, that’s because it kind of was. When previous owners converted their 1888-built home into a duplex, they put together an ad hoc kitchen on the second floor because the original kitchen resided on the ground floor. So when the Allisons bought both units and rented out the bottom floor, they were stuck with a kitchen that seriously lacked function. “There wasn’t even a single drawer,” says Ian. “It was a bummer.”

Housing Costs Plunge for Owners, Soar for Renters | Katonah Real Estate

A much higher proportion of renters than homeowners are cost burdened by their housing expenses and the number is growing quickly due to rising rents and affordable home prices.

Last year, 39.6 million households spent more than 30 percent of their income on housing, down from 40.9 million in 2012 and a peak of 42.7 million in 2010.  Still, just over a third of U.S. households (34 percent) were cost burdened in 2013, including about a quarter of all homeowners (26 percent) and half of all renters (49 percent), according to the Harvard Joint Center for Housing Studies.

Last year’s decline in the number of cost-burdened households, however, occurred almost exclusively among homeowners.  Cost burdened households are those where housing costs exceed 30 percent of income.

renter1

Nearly 19 million owners were cost burdened in 2013, down from 20.3 million in 2012.  The number of owners with severe cost burdens – paying more than 50 percent of income for housing – also slid, from 8.5 million in 2012 to 8.1 million in 2013.  The easing of owner cost burdens is due in part to a dramatic decline in median homeowner housing costs.  After surging during the housing bubble, inflation-adjusted owner costs have dropped to about 2.5 percent below their 2001 level (Figure 2).  Owner burdens are also down due to a significant reduction in the overall number of homeowners – fully 294,000 fewer households in 2013 than 2012.  This decline in the number of homeowners for the third straight year (and the fifth time since 2007) suggests that many burdened owners dropped out of ownership, moving into the costly rental market.

renters2


With many exiting ownership and new households forming, the number of renter households was up by 615,000 in 2013.  Indeed, a major reason why renter cost burdens remain persistently high is that the overall number of renters continues to grow.  Despite a slight decline in cost-burdened share, the sharp growth in renter households pushed the number with cost burdens up for the twelfth consecutive year, reaching 20.8 million in 2013.  Of these, about 11.2 million were severely burdened in both years.  Cost pressures also continue to drive burdens higher as over the past decade, renter costs have largely gone up, while renter incomes have declined.  As Figure 2 shows, real median renter costs in 2013 were about five percent higher than in 2001 while, even with modest income gains in 2013, median incomes were nearly 11 percent lower.  If past patterns hold and income growth remains stagnant, rental costs continue to climb, and affordable ownership stays out of reach, rental cost burdens will only continue to grow.


read more…


http://www.realestateeconomywatch.com/2014/11/housing-costs-plunge-for-owners-soar-for-renters-2/

Housing starts drop 2.8% in October but permits up | Katonah Real Estate

Privately-owned housing starts dropped 2.8% in October to print at a seasonally adjusted annual rate of 1,009,000 units, which is still 7.8% above the October 2013 rate of 936,000.

Single-family housing starts, which have been lagging through the summer and fall, finally perked up, growing 4.2% from last month’s tepid performance.

This comes one day after the National Association of Home Builder’s monthly survey said builder confidence is up for November.

Notably the only region with gains in starts was the South, which saw an increase of 10.1%. The West saw a drop of 10.9%, the Northeast dropped 16.4% and the Midwest plunged 18.5%.

“While permits rose in October, starts declined on weakness in the multi-family sector. Still, following yesterday’s rise in the NAHB Index, there appears to be a significant amount of confidence amid home builders breaking ground on new projects as low financing costs and improvement in the labor market are expected to bring new demand for housing,” said Lindsey Piegza, chief economist for Sterne Agee. “While there has been improvement in sales since a weak start to the year, demand has hardly been robust. Minimal income, lackluster savings, and more stringent borrowing restrictions are in some cases outweighing historically low borrowing costs.

“After a surge in buying activity in mid-2013 sparked by the Fed’s taper talk, demand slipped noticeably and has since been unable to recapture the highs of 2013. In the end, without jobs and income growth, consumers remain restrained, translating into positive, but modest demand,” she said.

Privately-owned housing units authorized by building permits in October were at a seasonally adjusted annual rate of 1,080,000, which was 4.8% above the revised September rate of 1,031,000 and is 1.2% above the October 2013 estimate of 1,067,000.

Paul Diggle, property economist for Capital Economics, was optimistic in his outlook.

“The decline in housing starts in October was entirely driven by a fall in the volatile multi-family component,” Diggle said. “With single-family starts, building permits and homebuilder confidence all rising, the outlook is becoming increasingly positive.”

The permits level is also the highest since June 2008.

Single-family authorizations in October were at a rate of 640,000, which makes for a 1.4% gain on the revised September figure of 631,000.


read more….


http://www.housingwire.com/articles/32101-housing-starts-drop-28-in-october-but-permits-up

Dreamy 1830s Abode Was a Stop on the Underground Railroad | Katonah Real Estate


4470KatherinesWay1.jpg

Location: Westerville, Ohio
Price: $1,250,000
The Skinny: Several homes in the northeastern Columbus suburb of Westerville, Ohio, were stations on the Underground Railroad. One of them, an updated five-bedroom with a spiffy columned facade, some beautiful mounted panels rescued from the LeVeque Tower, a Jeffersonian-looking dome topped with a skylight, and a 1930s schoolhouse outfitted for guest accommodations, was put on the market just the other day.

The oldest sections, which were built in 1830, according to the marketing material, have a healthy amount of exposed brick that’s since been balanced out by large windows and glass doors in the rear of the home. Much of the yellow pine and walnut woodwork is original, and there’s vintage tiling in a few of the bathrooms. With a pool and an expansive brick patio, facing out on a about five acres with “mature trees & landscaping,” this handsome historic hodgepodge is priced at $1.25M.


read more….


http://curbed.com/archives/2014/11/04/westerville-ohio-underground-railroad-home-for-sale.php

Removing Wall to Wall Carpeting by Bob Villa | Katonah Homes

Source: charlesandhudson.com

Source: charlesandhudson.com

I am moving to a new house where the living room and dining area have wall-to-wall carpeting. I asked the previous owner, and he told me there is hardwood flooring underneath. Could you please tell me how to remove carpet?

Even with regular vacuuming, carpeting accumulates a great deal of dust, dirt and debris. So if and when you finally decide to rip it up, be sure to give the floor covering one last good vacuuming. Empty the room of furnishings, open the windows and don your dust mask — then get to work!

Materials & tools

  • Large contractor trash bags
  • Nail puller pliers
  • Steel putty knife
  • Flat pry bar (at least 15 inches)
  • Hammer
  • Utility knife (or tin snips)
  • Leather work gloves
  • Carpet padding adhesive remover (optional)
  • Scraper (optional)

Step 1

Was your carpeting installed under shoe molding? Assuming it was, the first thing to do is remove that trimwork with your putty knife and pry bar. Check the molding for damage: If it remains in good shape, save it for reuse. Chances are the trim is full of nails; when pulling them out, take care not to inflict any avoidable damage. If the molding looks a little worse for wear, consider giving it a fresh coat of paint prior to re-installation.

Step 2

Now that there is no obstruction between you and the carpeting, use a utility knife or a sharpened pair of tin snips to cut the material into three- or four-foot-wide strips. (Cut all the way through the backing but stop short of the flooring beneath.) Once complete, begin pulling the carpet away from the tack strips on the perimeter. Roll up the sections as you remove them, placing them into heavy-duty trash bags ready for disposal.


read more…


http://www.zillow.com/blog/remove-wall-to-wall-carpeting-160890/