Tag Archives: Cross River NY Real Estate

Home sales up 33.9%, prices up 19.1% | Cross River Real Estate

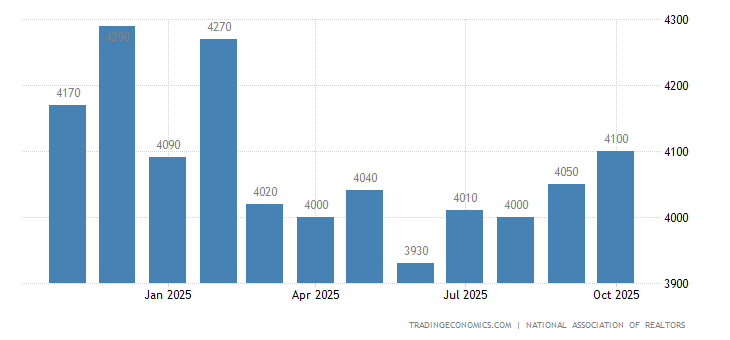
Existing home sales in the US unexpectedly sank 2.7 percent to 5.858 million in April of 2021, compared to forecasts of a 2 percent rise. It marks three consecutive months of declines as housing supply continues to fall short of demand. “We’ll see more inventory come to the market later this year as further COVID-19 vaccinations are administered and potential home sellers become more comfortable listing and showing their homes. The falling number of homeowners in mortgage forbearance will also bring about more inventory”, said Lawrence Yun, NAR’s chief economist. All but one of the four major US regions witnessed month-over-month drops. On the year however, sales surged 33.9 percent. The median existing-home price for all housing types in April was at a record of $341,600, up 19.1 percent from April 2020. Total housing inventory amounted to 1.16 million units, up 10.5 percent from March’s inventory and down 20.5 percent from one year ago. source: National Association of Realtors

United States Existing Home Sales
ActualPreviousHighestLowestDatesUnitFrequency
5850.006010.007250.001370.001968 – 2021ThousandMonthlySA
CalendarGMTReferenceActualPreviousConsensusTEForecast
2021-04-2202:00 PMExisting Home Sales MoMMar-3.7%-6.3%0.8%0.5%
2021-04-2202:00 PMExisting Home SalesMar6.01M6.24M6.19M6.25M
2021-05-2102:00 PMExisting Home Sales MoMApr-2.7%-3.7%2%0.7%
2021-05-2102:00 PMExisting Home SalesApr5.85M6.01M6.09M6.05M
2021-06-2202:00 PMExisting Home SalesMay5.85M5.7M
2021-06-2202:00 PMExisting Home Sales MoMMay-2.7%-1%
2021-07-2202:00 PMExisting Home SalesJun
2021-07-2202:00 PMExisting Home Sales MoMJun

Go to our Calendar for more events. Or learn more about the Calendar API for direct access.

read more…

tradingeconomics.com/united-states

Mortgage rates average 2.79% | Cross River Real Estate

Freddie Mac today released the results of its Primary Mortgage Market Survey® (PMMS®), showing that the 30-year fixed-rate mortgage (FRM) averaged 2.79 percent.

“As Treasury yields have risen, it is putting pressure on mortgage rates to move up,” said Sam Khater, Freddie Mac’s Chief Economist. “While mortgage rates are expected to increase modestly in 2021, they will remain inarguably low, supporting homebuyer demand and leading to continued refinance activity. Borrowers are smart to take advantage of these low rates now and will certainly benefit as a result.”

News Facts

  • 30-year fixed-rate mortgage averaged 2.79 percent with an average 0.7 point for the week ending January 14, 2021, up from last week when it averaged 2.65 percent. A year ago at this time, the 30-year FRM averaged 3.65 percent.
  • 15-year fixed-rate mortgage averaged 2.23 percent with an average 0.7 point, up from last week when it averaged 2.16 percent. A year ago at this time, the 15-year FRM averaged 3.09 percent.
  • 5-year Treasury-indexed hybrid adjustable-rate mortgage (ARM) averaged 3.12 percent with an average 0.4 point, up from last week when it averaged 2.75 percent. A year ago at this time, the 5-year ARM averaged 3.39 percent.

The PMMS® is focused on conventional, conforming, fully amortizing home purchase loans for borrowers who put 20 percent down and have excellent credit. Average commitment rates should be reported along with average fees and points to reflect the total upfront cost of obtaining the mortgage. Visit the following link for the Definitions. Borrowers may still pay closing costs which are not included in the survey.

New homes sales up 41% | Cross River Real Estate

Sales of new single-family houses dipped slightly in October but is still 41.5% above October 2019’s estimate of 706,000, according to the U.S. Census Bureau and the Department of Housing and Urban Development. New-home sales last month were at a seasonally adjusted rate of 999,000, 0.3% lower than the revised September rate of 1,002,000.

The continued elevated new-home sales follows other strong residential market indicators for the month of October. Zonda reported this week that pending new-home sales were tracking higher year over year in nearly every top U.S. market. And existing home sales were up 26.6% from a year ago, according to the National Association of Realtors.

According to the data, the median sales price of new houses sold in October was $330,600, while the average sales price was $386,200.

The seasonally adjusted estimate for new homes for sale was 278,000 at the end of October, representing a 3.3-month supply at the current sales rate.

“Today’s report from the Census Bureau suggested that demand for new homes in October continued to be strong, but supply constraints will likely limit the growth of new-home sales going forward,” noted Fannie Mae chief economist Doug Duncan. “The monthly sales pace is now reported to have been essentially flat for the three months at an elevated level of about 1 million annualized units, a rate not seen since 2006. However, sales are increasingly being driven from homes not yet under construction. The share of homes sold but not yet started rose for the third straight month and now represents the highest share of total sales since 2005, while the number of fully completed homes sold hit the lowest level since the COVID-19-related shutdowns this past April.”

Duncan added that the sales pace continued to exceed its typical relationship with the rate of construction. “At the comparatively low level of started homes available for sale, we believe the current sales pace to be unsustainable. We continue to project a convergence in coming months via a softening of sales while housing starts show comparative strength,” he said. “However, due to the revisions to past months’ numbers and third quarter sales coming in stronger than previously thought, our fourth quarter forecasts for both new sales and new housing starts will likely be revised upward.”

read more…

https://www.builderonline.com/money/economics/single-family-new-home-sales-remain-strong-in-october_o

Remodelers Report A Framing Lumber Shortage | Cross River Real Estate

With the recent increases in the price of many residential construction materials, and in particular softwood lumber, NAHB wanted to get a better understanding of how these price increases are impacting remodelers. In the Q3 2020 Remodeling Market Index (RMI), remodelers were asked to report on material shortages, if any, as well as material price changes over the last six months.

Results show that a significant share of remodelers (77 percent) report a framing lumber shortage, with 25 percent reporting a serious shortage and 52 percent reporting some shortage (Figure 1). In recent months the cost of softwood lumber has jumped to extraordinary levels. In fact, the Producer Price Index (PPI) for softwood lumber has nearly doubled over the last five months (90.9 percent increase), the largest increase since 1975 for the seasonally adjusted series. This price increase has undoubtedly impacted lumber’s availability for remodeling projects and for home construction, in general.

Behind framing lumber, at least 60 percent of remodelers report shortages for three other materials: windows and doors (65 percent), plywood (63 percent), and oriented strand board (OSB) (61 percent) – all construction products commonly derived from softwood lumber. At least 17 percent of remodelers report having a serious shortage for all three of these materials.

At least 40 percent of remodelers report shortages for four other materials: millwork (45 percent), plumbing fixtures & fittings (44 percent), trusses (43 percent), and cabinets (41 percent) – three of which involve lumber. Very small shares of remodelers report shortages on clay brick (10 percent), concrete brick and block (11 percent), steel (lightweight for framing) (12 percent), and structural insulated panels (SIP) (another 12 percent). It is important to also note that 34 percent of remodelers report that they are experiencing shortages for ‘other’ materials not listed. Many reported appliances as the ‘other’ material.

Remodelers were also asked to specify how much total material costs have changed over the last six months for a typical project. Results show that 25 percent of remodelers report cost increases of 20 percent or more (Figure 2).

read more…

eyeonhousing.org

Mortgage rates fall to 2.80% | Cross River Real Estate

 Freddie Mac (OTCQB: FMCC) today released the results of its Primary Mortgage Market Survey® (PMMS®), showing that the 30-year fixed-rate mortgage (FRM) averaged 2.80 percent, the lowest rate in our survey’s history which dates back to 1971.

“Mortgage rates remain very low, providing homeowners who have not already taken advantage of this environment ample opportunity to do so,” said Sam Khater, Freddie Mac’s Chief Economist. “Mortgage rates today are on average more than a full percentage point lower than rates over the last five years. This means that most low- and moderate-income borrowers who purchased during the last few years stand to benefit by exploring refinancing to lower their monthly payment.”

News Facts

  • 30-year fixed-rate mortgage averaged 2.80 percent with an average 0.6 point for the week ending October 22, 2020, down from last week when it averaged 2.81 percent. A year ago at this time, the 30-year FRM averaged 3.75 percent.
  • 15-year fixed-rate mortgage averaged 2.33 percent with an average 0.6 point, down from last week when it averaged 2.35 percent. A year ago at this time, the 15-year FRM averaged 3.18 percent.
  • 5-year Treasury-indexed hybrid adjustable-rate mortgage (ARM) averaged 2.87 percent with an average 0.3 point, down from last week when it averaged 2.90 percent. A year ago at this time, the 5-year ARM averaged 3.40 percent.

The PMMS is focused on conventional, conforming, fully-amortizing home purchase loans for borrowers who put 20 percent down and have excellent credit. Average commitment rates should be reported along with average fees and points to reflect the total upfront cost of obtaining the mortgage. Visit the following link for the Definitions. Borrowers may still pay closing costs which are not included in the survey.

A foreclosure moratorium has inflated the housing market | Cross River Real Estate

Despite an economic downturn this summer, a homebuying frenzy boosted home prices by almost 9% and drove available housing inventory down 30% in August compared to the same time last year, according to Zillow

A foreclosure moratorium on federally-backed mortgages (now extended through December 31), which was designed to keep people in their homes during the coronavirus pandemic, has inflated the housing market, according to economists.

“That is a whole bunch of inventory [homes in forbearance], which would normally actually be selling at fire sale prices. Where instead — and I mean this is great news for those folks, that they can hunker down [and] they can stay put — but it is actually kind of locking up a lot of home inventory,” Jeff Tucker, economist at Zillow, told Yahoo Finance’s The Final Round.

In the Great Recession of 2008, banks foreclosed on almost 2% of houses in the U.S., unleashing a glut of houses onto the market and causing home prices to plummet. But today  the Coronavirus Aid, Relief, and Economic Security (CARES) Act instituted protections to keep people in their homes during the coronavirus pandemic, offering foreclosure moratoriums and mortgage forbearance options for homes with federally-backed mortgages.

“I think that’s probably one of the biggest things stopping home sales right now,” said Tucker.

Close up shot of mortgage paper
Some 7% of mortgages are still in forbearance, according to the Mortgage Bankers Association. Credit: Getty

As the economy recovers, some 7% of mortgages are still in forbearance, according to the Mortgage Bankers Association, a Washington, D.C.-based professional organization. But forbearance and foreclosure protections won’t last forever, and for many homeowners, mortgage payments are stacking up — which could spell uncertainty for the housing market next year. 

Mortgage forbearance is “going to expire for a lot — millions — of homeowners in March, April, May of next year. It’s a really big open question. How many of those folks are back in work by then? How many of them are able to get back on track with their mortgage payments?” said Tucker. 

But these protections aren’t the only reason housing supply is so low. The U.S. has had an affordable housing shortage for more than a decade, and now 5 million millennials (age 26 to 35) are reaching the age where they want to buy, fueling demand. 

Plus, demand skyrocketed this summer beyond what was predicted: pending sales in the last week of August were up 19% from the same time last year. Shutdowns this spring created pent-up demand that pushed peak homebuying season into late summer and early fall. And lifestyle changes during the pandemic have prompted many city dwellers to move to the suburbs.

“A lot of the sales that would have happened in March and April are getting pushed back later into summer. And especially since a lot of people have kids just at home doing remote school, they’re more willing to continue shopping and make that big move in September or October at this point,” said Tucker.

read more…

https://finance.yahoo.com/news/zillow-economist

15 Year mortgage hits 1.875% | Cross River Real Estate

New head-turner for mortgage rates: 15-year loans at under 2%

Remember all the excitement when 30-year mortgage rates started dipping below 3% for the very first time a few weeks ago? Just as those low-cost loans are almost starting to become ho-hum, one of the nation’s largest home lenders is out with a shorter-term mortgage that takes rates into a whole new universe.

United Wholesale Mortgage — a company that earlier this year announced 30-year fixed mortgage rates as low as 2.5% and VA loans for veterans and service members at just 2.25% — has just introduced a 15-year loan with rates under 2%.

Rates that are way below average

Mortgage rates have been plummeting to record lows in 2020 as the coronavirus crisis has shaken up financial markets and caused the Federal Reserve to slash interest rates to the bone.

UWM’s new 15-year fixed-rate mortgages come with rates as low as 1.875%. That’s unprecedented — and way down from the national average for those loans, currently 2.54% according to mortgage company Freddie Mac.

A 15-year home mortgage “is a great vehicle for refinancing. A lot of people look at it as a way to cut years off their mortgage,” says Mat Ishbia, president and CEO of United Wholesale Mortgage.

A homeowner who’s had a 30-year mortgage for a number of years can refi into a 15-year loan and avoid stretching out interest costs for additional decades.

Mortgage rates with shorter terms tend to have lower rates but much stiffer monthly payments. The rate on the UWM 15-year loan is so low that some refinancers may not find a major difference in their mortgage payments when switching out from a 30-year loan.

The math on a low-cost mortgage

Portrait of Black girl writing solution of sums on white board at school.
Rido / Shutterstock

Here’s how that works: Let’s say you took out a 30-year, $250,000 mortgage five years ago at 5%. (Clearly you didn’t do enough comparison shopping, because rates were averaging about 4% in the summer of 2015.)

You’ve been paying $1,342 in principal and interest each month and have close to $230,000 left on your loan.

Refinancing that balance into a 15-year mortgage at 1.875% would give you a monthly payment of $1,466, just $124 more than you’re currently paying. And your interest savings would be huge.

The 15-year loan comes with lifetime interest costs of about $34,000. If you refinanced into a new $230,000, 30-year loan at, say, 3% and stayed with the mortgage through the end of its term, you’d pay total interest costs of $119,000. The difference is massive.

Then again, the new 30-year fixed-rate mortgage would have a monthly payment of just $969, substantially less than the 15-year option.

Are all the numbers starting to make your head spin? Think of it this way: The sharply lower interest costs make the 15-year loan a good refinance choice if you plan to stay in the house for the long haul. A 30-year refi loan, with its lower monthly payment, is better if you might be moving on in a few years.

How to get a dirt-cheap 15-year mortgage

The new low-rate 15-year mortgages are part of UWM’s Conquest program, same as the lender’s ultra-cheap 30-year conventional and VA loans.

“Over 90% of our loans are in the 1% or 2% percent range and we’ve had a massive response for both purchases and refinances since we launched the Conquest program back in May,” says Ishbia.

Like the name says, United Wholesale Mortgage is a wholesaler, so you can’t get a mortgage directly from UWM. The loans are offered only through independent mortgage brokers, to both homebuyers and refinancers.

The program has a stipulation that a borrower cannot have taken out a UWM loan within the last 18 months.

As always, you’ll find the best mortgage rate based on your credit score and situation by shopping around throroughly for your loan.

Be sure to take a similar approach when you buy or renew your homeowners insurance. Get quotes from several insurers and look at them side by side, to find the right coverage at the lowest price.

read more…

https://finance.yahoo.com/news/head-turner-mortgage-rates

NAR reports sales down 26.6% | Cross River Real Estate

Existing-home sales fell in May, marking a three-month decline in sales as a result of the coronavirus outbreak, according to the National Association of Realtors®. Each of the four major regions witnessed dips in month-over-month and year-over-year sales, with the Northeast experiencing the greatest month-over-month drop.

Total existing-home sales,1 https://www.nar.realtor/existing-home-sales, completed transactions that include single-family homes, townhomes, condominiums and co-ops, slumped 9.7% from April to a seasonally-adjusted annual rate of 3.91 million in May. Overall, sales fell year-over-year, down 26.6% from a year ago (5.33 million in May 2019).

“Sales completed in May reflect contract signings in March and April – during the strictest times of the pandemic lockdown and hence the cyclical low point,” said Lawrence Yun, NAR’s chief economist. “Home sales will surely rise in the upcoming months with the economy reopening, and could even surpass one-year-ago figures in the second half of the year.”

The median existing-home price2 for all housing types in May was $284,600, up 2.3% from May 2019 ($278,200), as prices increased in every region. May’s national price increase marks 99 straight months of year-over-year gains.

Total housing inventory3 at the end of May totaled 1.55 million units, up 6.2% from April, and down 18.8% from one year ago (1.91 million). Unsold inventory sits at a 4.8-month supply at the current sales pace, up from 4.0 months in April and up from the 4.3-month figure recorded in May 2019.

“New home construction needs to robustly ramp up in order to meet rising housing demand,” Yun said. “Otherwise, home prices will rise too fast and hinder first-time buyers, even at a time of record-low mortgage rates.”

Properties typically remained on the market for 26 days in May, seasonally down from 27 days in April, but equal to 26 days in May 2019. Fifty-eight percent of homes sold in May 2020 were on the market for less than a month.

First-time buyers were responsible for 34% of sales in May, down from 36% in April 2020 and up from 32% in May 2019. NAR’s 2019 Profile of Home Buyers and Sellers – released in late 20194 – revealed that the annual share of first-time buyers was 33%.

Individual investors or second-home buyers, who account for many cash sales, purchased 14% of homes in May, up from 10% in April 2020 and from 13% in May 2019. All-cash sales accounted for 17% of transactions in May, up from 15% in April 2020 and down from 19% in May 2019.

Distressed sales5 – foreclosures and short sales – represented 3% of sales in May, about even with April but up from 2% in May 2019.

“Although the real estate industry faced some very challenging circumstances over the last several months, we’re seeing signs of improvement and growth, and I’m hopeful the worst is behind us,” said NAR President Vince Malta, broker at Malta & Co., Inc., in San Francisco, Calif. “NAR, along with our partners and 1.4 million members, are already working to reignite America’s real estate industry, which will be a key driver in our nation’s economic recovery.”

According to Freddie Mac, the average commitment rate(link is external) for a 30-year, conventional, fixed-rate mortgage decreased to 3.23% in May, down from 3.31% in April. The average commitment rate across all of 2019 was 3.94%.

Single-family and Condo/Co-op Sales

Single-family home sales sat at a seasonally-adjusted annual rate of 3.57 million in May, down 9.4% from 3.94 million in April, and down 24.8% from one year ago. The median existing single-family home price was $287,700 in May, up 2.4% from May 2019.

Existing condominium and co-op sales were recorded at a seasonally adjusted annual rate of 340,000 units in May, down 12.8% from April and down 41.4% from a year ago. The median existing condo price was $252,300 in May, a decrease of 1.6% from a year ago.

“Relatively better performance of single-family homes in relation to multifamily condominium properties clearly suggest migration from the city centers to the suburbs,” Yun said. “After witnessing several consecutive years of urban revival, the new trend looks to be in the suburbs as more companies allow greater flexibility to work from home.”

This relocating trend can be examined further in the buying behaviors of millennials, outlined in a recent NAR report identifying the top 10 markets with opportunities for millennial homebuyers. Among other factors, the report analyzes current housing affordability and job market conditions for millennials during the pandemic. The markets – listed in alphabetical order – are Austin-Round Rock, Texas; Dallas-Fort Worth-Arlington, Texas; Des Moines-West Des Moines, Iowa; Durham-Chapel Hill-Raleigh, N.C.; Houston-The Woodlands, Texas; Indianapolis-Carmel-Anderson, Ind.; Omaha, Nebraska/Council Bluffs, Iowa; Phoenix-Mesa-Scottsdale, Ariz.; Portland, Oregon/Vancouver, Wash.; and Salt Lake City, Utah.

Regional Breakdown

As was the case for the month prior, sales for May decreased in every region from the previous month’s levels. Median home prices grew in three of the four major regions from one year ago, falling marginally in the West.

May 2020 existing-home sales in the Northeast fell 13.0%, recording an annual rate of 470,000, a 29.9% decrease from a year ago. The median price in the Northeast was $327,900, up 7.8% from May 2019.

Existing-home sales decreased 10.0% in the Midwest to an annual rate of 990,000 in May, down 20.2% from a year ago. The median price in the Midwest was $227,400, a 3.0% increase from May 2019.

Existing-home sales in the South dropped 8.0% to an annual rate of 1.73 million in May, down 25.1% from the same time one year ago. The median price in the South was $247,400, a 2.1% increase from a year ago.

Existing-home sales in the West fell 11.1% to an annual rate of 720,000 in May, a 35.1% decline from a year ago. The median price in the West was $408,400, down 0.2% from May 2019.

The National Association of Realtors® is America’s largest trade association, representing more than 1.4 million members involved in all aspects of the residential and commercial real estate industries.

# # #

For local information, please contact the local association of Realtors® for data from local multiple listing services (MLS). Local MLS data is the most accurate source of sales and price information in specific areas, although there may be differences in reporting methodology.NOTE: NAR’s Pending Home Sales Index for May is scheduled for release on June 29, and Existing-Home Sales for June will be released July 22; release times are 10:00 a.m. ET.


1 Existing-home sales, which include single-family, townhomes, condominiums and co-ops, are based on transaction closings from Multiple Listing Services. Changes in sales trends outside of MLSs are not captured in the monthly series. NAR rebenchmarks home sales periodically using other sources to assess overall home sales trends, including sales not reported by MLSs.

Existing-home sales, based on closings, differ from the U.S. Census Bureau’s series on new single-family home sales, which are based on contracts or the acceptance of a deposit. Because of these differences, it is not uncommon for each series to move in different directions in the same month. In addition, existing-home sales, which account for more than 90% of total home sales, are based on a much larger data sample – about 40% of multiple listing service data each month – and typically are not subject to large prior-month revisions.

The annual rate for a particular month represents what the total number of actual sales for a year would be if the relative pace for that month were maintained for 12 consecutive months. Seasonally adjusted annual rates are used in reporting monthly data to factor out seasonal variations in resale activity. For example, home sales volume is normally higher in the summer than in the winter, primarily because of differences in the weather and family buying patterns. However, seasonal factors cannot compensate for abnormal weather patterns.

Single-family data collection began monthly in 1968, while condo data collection began quarterly in 1981; the series were combined in 1999 when monthly collection of condo data began. Prior to this period, single-family homes accounted for more than nine out of 10 purchases. Historic comparisons for total home sales prior to 1999 are based on monthly single-family sales, combined with the corresponding quarterly sales rate for condos.

2 The median price is where half sold for more and half sold for less; medians are more typical of market conditions than average prices, which are skewed higher by a relatively small share of upper-end transactions. The only valid comparisons for median prices are with the same period a year earlier due to seasonality in buying patterns. Month-to-month comparisons do not compensate for seasonal changes, especially for the timing of family buying patterns. Changes in the composition of sales can distort median price data. Year-ago median and mean prices sometimes are revised in an automated process if additional data is received.

The national median condo/co-op price often is higher than the median single-family home price because condos are concentrated in higher-cost housing markets. However, in a given area, single-family homes typically sell for more than condos as seen in NAR’s quarterly metro area price reports.

3 Total inventory and month’s supply data are available back through 1999, while single-family inventory and month’s supply are available back to 1982 (prior to 1999, single-family sales accounted for more than 90% of transactions and condos were measured only on a quarterly basis).

4 Survey results represent owner-occupants and differ from separately reported monthly findings from NAR’s Realtors® Confidence Index, which include all types of buyers. Investors are under-represented in the annual study because survey questionnaires are mailed to the addresses of the property purchased and generally are not returned by absentee owners. Results include both new and existing homes.

read more…

nar.realtor/newsroom
NYC real estate sales tax receipts down 64% | Cross River Real Estate

Commercial tenants in New York City are struggling to pay their rent after the coronavirus outbreak triggered a near-paralysis of nonessential business for two months, threatening to drain the city of millions of dollars in vital tax revenue.

One of the city’s biggest commercial landlords, Vornado Property Trust, said during an earnings call this month that nearly all its retail clients, except for grocery stores and other essential businesses, have sought financial relief, including a deferral on rent payments.

About 80 percent of its retail tenants did not pay rent in April and May, its CEO Steven Roth, said during the call.

Empire State Realty Trust, another major real estate company that owns the Empire State Building, said that more than 50 percent of its retail tenants and a quarter of its office tenants did not pay April rent.

If building owners are unable to pay their next property tax bill at the beginning of July, a deadline the city has refused to shift, the city will lose out on its single biggest source of funding, which accounts for more than half of the city’s tax revenue.

The Community House Improvement Program, which represents about 4,000 landlords of rent-stabilized apartment buildings in the city, said that about two-thirds of ground-floor retail tenants did not pay rent in April and May. Before the crisis, the figure was about 15 percent per month.

“Unless the federal government steps in to help renters and owners in a big way, we are going to see a housing disaster the likes of which we have never seen,” Jay Martin, CHIP’s executive director, said in a statement. “Congress must provide financial aid directly to renters and the state must match that with property tax relief for owners or in weeks, not months, we will see buildings going under.”

On top of that, in April, New York City and state collected a combined $78.5 million in tax revenue on the sale of commercial and residential properties — well below March, when it raked in $217.5 million, according to a report published by the Real Estate Board of New York (REBNY).

That marks a 64 decrease from March, and a 48 percent loss from the year-ago period, according to the report.

“This dramatic loss in tax revenue is alarming,” REBNY President James Whelan said in a statement. “The real estate sector is the city’s economic engine. The pandemic has caused that engine to stall and we should expect such alarming trends to carry through May and June in the best-case scenario.”

read more…

foxbusiness.com/economy

New homes sales drop 9.5% | Cross River Real Estate

The Census Bureau and Department of Housing and Urban Development’s report on new home sales in March is the first real time indication of the impact the COVID-19 mitigation is having on total sales. The report on existing homes, released a few days ago, largely reflected the closing of contracts booked in February and early March. New home sales are counted at contract signing.

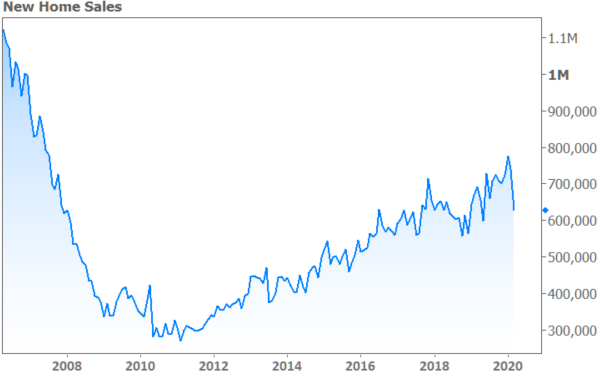
That said, the report shows a significant downturn, with a seasonally adjusted annual sales rate of 627,000 homes. This is a decline of 15.4 percent from the revised (from 765,000) 741,000 units rate in February and was down 9.5 percent from a year earlier.

The results were consistent with the wide range of forecasts from analysts polled by Econoday of 570,000 to 700,000 units. They were, however, well below the consensus estimate of 643,000.

On a non-adjusted basis, the picture was slightly better. There were 61,000 homes sold during the month compared to 66,000 in February, but sales were up by 2,000 units compared to January. For the year-to-date (YTD) there have been 186,000 new homes sold compared to 174,000 for the first three months of 2019. This is a 6.7 percent increase.

Sales were lower in all four major regions although sales in the South maintained a slight edge year-over-year. The Northeast saw sales down 41.5 percent from February and 4.0 percent lower than in March 2019. This is not surprising as Massachusetts and New York have been among the hardest pandemic-hit states. Sales in the West reflected the impact on both California and Washington with a drop of 38.5 percent for the month and 30.8 percent on an annual basis.

The Midwest saw a decline of 8.1 percent and 9.2 percent for the two earlier periods while sales in the South dipped 0.8 percent from February but were up 1.3 percent from the prior March. Despite the March losses, YTD increases were reflected across all four regions ranging from 3.0 percent in the South to 14.7 percent in the Northeast.

There were 324,000 homes available for sale at the end of the reporting period. This was estimated at a 6.4-month supply at the current rate of sales, a big jump from the 5.2 month estimate at the end of February. The median time that a completed home was on the market was unchanged from the prior month at 3.4 months.

The median price of a new home sold in March was $321,400 and the average was $375,300. In March 2019, the corresponding numbers were $310,600 and $372,700.

Robert Dietz, chief economist for the National Association of Home Builders had the following reaction to the new home sales numbers. “The pace of new home sales will post significant declines during the second quarter due to the impacts of higher unemployment and shutdown effects of much of the U.S. economy, including elements of the real estate sector in certain markets. However, given the momentum housing construction held at the start of 2020, the housing industry will help lead the economy in the eventual recovery.”

read more…

http://www.mortgagenewsdaily.com/04232020_new_home_sales.asp