Tag Archives: Cross river NY Luxury Homes for Sale

NYC home prices drop 5.2% up 4.2% nationally | Cross River Real Estate

National home prices increased modestly in August. New York and Las Vegas experienced price declines while Phoenix led the way with a 9.1% annual growth rate in August.

The Case-Shiller U.S. National Home Price Index, reported by S&P Dow Jones Indices rose at a seasonally adjusted annual growth rate of 4.2% in August, following an increase of 2.1% in July. On a year-over-year basis, the Case-Shiller U.S. National Home Price NSA Index posted a 3.2% annual gain in August, up from 3.1% in July. After six straight months of declines of the rate of growth, the annual growth rate increased for the first time in August.

Meanwhile, the Home Price Index, released by the Federal Housing Finance Agency (FHFA), rose at a seasonally adjusted annual rate of 2.1% in August, following a 4.9% increase in July. On a year-over-year basis, the FHFA Home Price NSA Index rose by 4.6% in August, after an increase of 5.1% in July. It was the lowest annual growth rate since October 2014.

In addition to tracking home price changes nationwide, S&P also reported home price indexes across 20 metro areas. In August, local home prices varied and their annual growth rates ranged from -5.2% to 9.1%. Among the 20 metro areas, four metro areas exceeded the national average of 4.2%. Phoenix, Miami and Seattle had the highest home price appreciation in August. Phoenix led the way with a 9.1% increase, followed by Miami with a 6.1% increase and Seattle with a 6.0% increase.

Home prices in two metro areas declined in August. They were New York (-5.2%) and Las Vegas (-1.7%). New York has experienced negative home price appreciation for six straight months this year.

read more…

http://eyeonhousing.org/2019/10/home-prices-increased-in-august/

Home projects for the New Year | Cross River Real Estate

New Year’s Resolutions for Your Home

Easy tasks that will make you happier, healthier and even wealthier!

Prevent Bathroom Mold

Prevent Bathroom Mold

No matter where you live, the high moisture level in your bathroom can cause mold and mildew. Eliminating bathroom dampness is the key to keeping mold from growing. To do that, follow these steps:

First, after a bath or a shower, squeegee water off the shower walls. That eliminates at least three-fourths of the moisture that supports mold and mildew growth.

Second, run your bath fans during your bath or shower and for a half-hour after to flush out moisture. Or add a timer switch to make this step automatic.

Third, if you have tile, seal the grout lines annually with a standard grout sealer to waterproof them.

To get rid of the current mold, scrub with detergent and water, then let the surface dry completely. Or use a solution of 10 percent bleach and 90 percent water (a stronger bleach solution will not give better results). Spray or brush on the solution, let it sit 10 minutes, then rinse it off and let dry.

If the fans aren’t clearing out most of the moisture in your bathrooms after five to 10 minutes, your fans may not be moving enough air. Fans are certified by the volume (cfm, or cubic feet per minute) of air ‘exhausted’ out of the room. To find the recommended fan capacity for your bathroom, simply multiply the bathroom square footage by 1.1 (assuming an 8-ft. ceiling; for a 9-ft. ceiling, multiply by 1.5).

Restore Free Flow to Your Showerhead

Restore Free Flow to Your Showerhead

If the flow from your showerhead is growing weaker, the cause is probably mineral buildup. Many manufacturers recommend that you remove the showerhead and soak it in a half-and-half mixture of warm water and vinegar (any type). But there’s really no need to remove the head. Just pour the mix into a heavy-duty plastic bag and attach it to the shower arm with a rubber band. The acid in the vinegar dissolves minerals, but prolonged contact can harm some plastics and metal finishes, so remove the bag every 15 minutes and check the shower flow.

Clean Out Dryer Lint

Clean Out Dryer Lint

If you notice that it takes longer than normal for loads to dry in your clothes dryer, it may be time to clean out the vent. First detach the duct from behind the unit and then push a plumbing snake through your dryer vent from outside. Tie a rag securely to the snake end. Pull the cloth and snake through a couple of times and your clean vent will not only save energy but possibly prevent a fire as well.

If you discover that your dryer vent cover needs repair, this is how to fix it and this video shows you how to replace the vent it it’s in bad shape.

Sparkling Dishwasher

Sparkling Dishwasher

Add a cup of vinegar to your empty dishwasher and let it run a full cycle once a month or so. Your kitchen may smell a bit like a pickle jar for a few hours, but hard-water lime buildup will be rinsed away, making your spray arm and other dishwasher parts work flawlessly.

Check Your Gutters

Check Your Gutters

A 1,000-sq.-ft. roof will shed about 620 gallons of water during a 1-in. rainfall, or about 103 gallons per downspout if you have six downspouts. That’s a lot of water dumped right next to your basement. Although it may seem obvious, clean and properly functioning seamless gutter systems with downspouts that empty away from the foundation are key to avoiding major and expensive home repairs, gutter cleaning is always a good idea.

So before you leave for a vacation, take a walk around the house and check your gutters. Check to see if leaves, sticks or other debris are blocking the inlet of the downspout and preventing water from flowing down the spout. In fact, you do not need to clean gutters by yourself. Learn about Gutter Guards Gettysburg and their services to solve all your problems with gutters. Also make sure your downspout extensions are discharging the water far enough from the foundation and that you always reattach them after you mow your lawn. You should try this company for house gutters repairs.

Avoid a Scalding by Setting Your Water Heater to 120 Degrees

Avoid a Scalding by Setting Your Water Heater to 120 Degrees

Plain old tapwater can be dangerous. Water heaters set too high send thousands (mostly children) to hospitals each year with burns. Most safety experts recommend a setting of 120 degrees F. But finding that setting on the dial isn’t easy—most dials aren’t labeled with numbers.

If the stickers on the water heater don’t tell you how to set the temperature and you can’t find the owner’s manual, use this method: Run hot water at the tap closest to the water heater for at least three minutes. Then fill a glass and check the temperature. If the water is above 120 degrees, adjust the dial, wait about three hours and check again. Repeat until you get 120-degree water. For a final test, check the temperature the following morning, before anyone uses hot water.

read more…

https://www.familyhandyman.com/smart-homeowner/

A tale of two housing economies | Cross River Real Estate

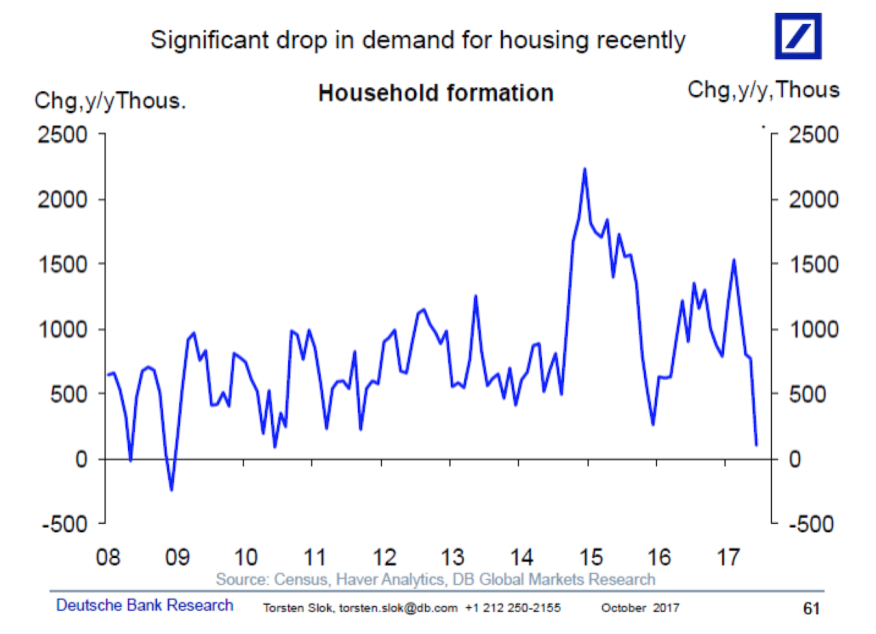
Torsten Slok, Ph.D., is chief international economist and a managing director at Deutsche Bank Securities. The question Slok asked yesterday morning was this.

Is household formation dropping because of affordability?

Here’s his chart.

Household formation takes a dive. Why?

It shows household formations falling off the table in 2017. Dr. Slok looks at the data and sees a big red flag.

In the initial years after the crisis household formation was around 600k to 700k, see chart below. Then household formation jumped to +1mn as young people completed their education and started moving out of their parents’ basement. But recently we have seen a significant drop in the number of new households, and we are worried that the slowdown in housing demand is driven by very high home prices and housing simply becoming unaffordable for new families.

The dots Slok inferrentially connects bridge this observation about national economics’ basic building block–the household–and the performance of the broader economy itself.

To be sure, the housing market remains a small share of the overall economy, but it is important because it is one of the most cyclical components of GDP.

For a clue into this unsettling flash point, one might look deep into the insights brought to light last week in an analysis from New York University’s Furman Center. On the surface, the headline take-away is encouraging, noting as it does that the percentage of United States households who are rent-burdened–spending 30% or more of their wages on monthly housing costs–fell by a percentage point between 2012 and 2015.

The report explores a relatively new phenomenon–more wealthy and higher-educated people are choosing to rent–that partly accounts for this statistical shift to fewer rent-burdened households.

The income of the typical renter household increased along with overall incomes in the economic recovery period, but more of the renter households were highly educated, had higher incomes, and were employed. Therefore, not all of the measured increase in renter income was due to renters making more income per se; rather, part of it was due to a shift in who was choosing to rent.

It’s here that we might discover insight into how the two trends–a slower household formation growth due to less affordability in many places, and the slight improvement in the share of rent-burdened households.

It’s evidence vested and invested players in residential real estate development and construction are working in not one, but two, related but disconnected housing businesses.

In one part of the housing business, players are growing around their competence at asking people with means how it is they want to live in their homes and communities, and profitably developing, designing, engineering, building, and marketing neighborhoods that answer to those preferences profitably.


read more…


http://www.builderonline.com/money/affordability/a-tale-of-two-housing-economies_o?utm_source=newsletter&utm_content=Article&utm_medium=email&utm_campaign=BP_101217%20(1)&he=bd1fdc24fd8e2adb3989dffba484790dcdb46483

Trump’s Labor Department Pulls Obama-Era Guidance on Independent Subs | Cross River Real Estate

The Department of Labor announced today it has withdrawn informal guidance that was widely regarded as an Obama Administration crackdown on companies’ use of independent contractors and of workers who in effect are employed by two companies jointly.

Of those, the 2015 guidance on independent subcontractors raised the greatest concerns among remodelers because it could have forced companies to treat those subs as employees and thus pay payroll taxes, unemployment insurance, and related costs on those workers.

“Removal of the administrator interpretations does not change the legal responsibilities of employers under the Fair Labor Standards Act and the Migrant and Seasonal Agricultural Worker Protection Act, as reflected in the department’s long-standing regulations and case law,” the Labor Department’s statement said. “The department will continue to fully and fairly enforce all laws within its jurisdiction, including the Fair Labor Standards Act and the Migrant and Seasonal Agricultural Worker Protection Act.”

The July 15, 2015, administrator’s interpretation by the head of the Wage and Hour Division–which no longer is available on the department’s website–basically declared the government will be looking closer at a subcontractor’s economic independence when deciding whether that sub really ought to be regarded as an independent enterprise. That represented a shift from past practices in which government reviews appeared to focus on whether a company controlled a supposedly independent contractor by setting that person’s hours, providing tools, and requiring the contractor wear the company’s uniform.

“[N]o single factor, including control, should be over-emphasized,”  David Weil, administrator of DOL’s Wage and Hour Division, wrote in that now-removed administrator’s interpretation. “Instead, each factor should be considered in light of the ultimate determination of whether the worker is really in business for him or herself (and thus is an independent contractor) or is economically dependent on the employer (and thus is its employee). The factors should be used as guides to answer that ultimate question of economic dependence.”

The interpretation came out three months after the Labor Department announced it had secured consent judgments with 16 defendants in Utah and Arizona who had claimed more than 1,000 of their workers were independent contractors. In that case, which yielded $700,000 in back wages and penalties, the defendants were accused of requiring the workers to become member/owners of limited liability companies. “These construction workers were building houses in Utah and Arizona as employees one day and then the next day were performing the same work on the same job sites for the same companies but without the protection of federal and state wage and safety laws,” DOL’s announcement said. “The companies, in turn, avoided paying hundreds of thousands of dollars in payroll taxes.”

The joint employer rule basically involves whether one company effectively controls all the activities of another company and thus is responsible for what that second company does to its employees. The rule had multiple implications for cases in which contractors used subcontractors and companies related to franchises.

read more…

http://www.remodeling.hw.net/business/operations/trumps-labor-department-pulls-obama-era-guidance-on-independent-subs_o?utm_source=newsletter&utm_content=Article&utm_medium=email&utm_campaign=REM_060717%20(1)&he=bd1fdc24fd8e2adb3989dffba484790dcdb46483

New home sales plummet more than 11% in April | Cross River Real Estate

New home sales plummeted from last month, however the level of housing inventory showed improvement, according to a joint release from the U.S. Census Bureau and the U.S. Department of Housing and Urban Development.

Sales of new single-family homes in April came in at a seasonally adjusted rate of 569,000 sales, a decrease of 11.4% from last month’s 642,000 sales. However, this is up 0.5% from last year’s 566,000 sales.

Brent Nyitray, iServe Residential Lending director of capital markets, pointed out in his note to clients that new home sales are still lagging behind population growth.

Surprisingly, the median sales price dropped to $309,200, down from last month’s $315,100.

The seasonally adjusted estimate of new homes for sale at the end of April remained steady at 268,000 homes. But with the lower rate of sales, this represents a 5.7-month supply of homes, up from 5.4 months in March.

While falling home prices and an increase in inventory could show a cooling housing market, time will tell if this was a one-month drop or a new trend.

read more…

New home sales plummet more than 11% in April

Realtors: Homebuyers flooded housing market in first quarter | Cross River Real Estate

The first quarter of 2017 saw the strongest quarterly home sales pace in a decade, according to the latest quarterly report from the National Association of Realtors.

This increase in home sales put downward pressure on housing inventory levels and caused home prices growth to accelerate its rate of increase in the first quarter, the report states. In fact, metro home prices now accelerated for three consecutive quarters.

The national median home price increased to $232,100, up 6.9% from the first quarter of 2016. This represents the fastest rate of growth since the second quarter of 2015.

“Prospective buyers poured into the market to start the year, and while their increased presence led to a boost in sales, new listings failed to keep up and hovered around record lows all quarter,” NAR Chief Economist Lawrence Yun said. “Those able to successfully buy most likely had to outbid others, especially for those in the starter-home market, which in turn quickened price growth to the fastest quarterly pace in almost two years.”

Single family home prices increased in 85% of markets as 152 of 178 metropolitan statistical areas showed sales prices gains in the first quarter, the report states. However, in 14 MSAs, home prices decreased year-over-year.

“Several metro areas with the healthiest job gains in recent years continue to see a large upswing in buyer demand but lack the commensurate ramp up in new home construction,” Yun said. “This is why many of these areas, in particular several parts of the South and West, are seeing unhealthy price appreciation that far exceeds incomes.”

Total existing home sales, including single-family homes and condos, increased 1.4% in the first quarter to a seasonally adjusted rate of 5.62 million, the highest rate since the first quarter of 2007.  This is up from 5.55 million in the fourth quarter of 2016 and from 5.36 million in the first quarter of 2016.

Housing inventory, however, decreased 6.6% from 1.96 million homes for sale in the first quarter last year to 1.83 million this year. This average supply rested at 3.7 months in the first quarter, down from 4.2 months last year.

And while median income is increasing,, hitting a national average of $71,201, higher mortgage rates and home prices weakened affordability.

“Last quarter’s robust pace of sales was especially impressive considering the affordability sting buyers experienced from higher prices and mortgage rates,” Yun said. “High demand is poised to continue heading into the summer as long as job gains continue. However, many metro areas need to see a significant rise in new and existing inventory to meet this demand and cool down price growth.”


read more…


Realtors: Homebuyers flooded housing market in first quarter

Time to Build a Single-Family Home | Cross River Real Estate

With the end of 2016 approaching, NAHB’s Eye on Housing is reviewing the posts that attracted the most readers over the last year. In July, Na Zhao examined typical construction durations for various types of single-family homes and regions.


The 2015 Survey of Construction (SOC) from the Census Bureau shows that the average completion time of a single family home is around 7 months, which usually includes almost a month from authorization to start and another 6 months to finish the construction. The timeline from authorization to completion, however, is not consistent across the nation, depending on the housing category, the geographic location, and metropolitan status.

Among all the single-family houses completed in 2015, houses built for sale took the shortest time, 6 months to completion after obtaining building permits, while houses built by owners required the longest time, almost a year. Homes built for rent took 9 months from permit to completion, and those built by hired contractors normally needed around 8 months. A large proportion of single family homes for sale and on owners’ land built by contractors began construction within the same month after obtaining building authorizations. However, homes built for rent and built by owners had a one-month lag between permits and construction start in 2015.

Slide1

The average time from authorization to completion also varies across the nation. New England division had the longest time of 10 months, followed by the Middle Atlantic of 9.6 months, East South Central, East North Central, and Pacific of 8 months in 2014. These four divisions all had above average time from permit to completion. The shortest period, 6 months, happened in the Mountain division, which also had the shortest waiting period from permit to construction start.

permit_compper_start

The metropolitan status indicates how long it takes to build a single-family home. Houses in metropolitan areas, on average, took nearly 7.5 months to completion, which was 2 months shorter than those in non-metropolitan areas. This pattern was quite consistent across the nation, except for the Middle Atlantic division where the average month to completion in metropolitan areas was longer than in non-metropolitan areas in 2015.

Slide2

The SOC also collects sale information for houses built for sale, including the sale date when buyers sign the sale contracts or make a deposit. In 2015, the share of single-family sold while under construction was 66%, with 32% even sold before construction start and 12% sold during the same month of completion. The percent of single-family houses completed in 2015 stayed unsold at the first quarter of 2016 was only 6%.

read more…

http://eyeonhousing.org/2016/12/top-posts-of-2016-time-to-build-a-single-family-home-in-2015/

New Home Sales in September – Continuing Gains, Continuing Headwinds | Cross River Real Estate

The US Census Bureau and Department of Housing and Urban Development in a joint release reported that newly constructed single family homes sold at a seasonally adjusted annual pace of 593 thousand in September, up 3.1% from a downwardly revised August figure, and up 29.8% from September 2015. However, note the monthly data is volatile and September was the lowest point in 2015 and the second highest point in 2016. Year over year growth in the trend in sales was 9.4%. Downward revisions to the July and August figures in no way diminish the upward trend that continues with the September figures.

The inventory of new single family homes for sale was 235 thousand, essentially flat in recent months after modest gains earlier in the year. Prices for new homes rose 3.5% from August and 1.9% from last September. A flat inventory in an environment of rising sales has put upward pressure on prices but expanding inventory has been a challenge given shortages of developed lots and skilled labor (NAHB). Both sales and inventories remain depressed by historical standards but the level of inventory given the pace of sales is in line with historical norms as builders balance caution and available resources in their efforts to meet expanding demand.

blog-new-home-sales-2016_10


read more…


http://eyeonhousing.org/2016/10/new-home-sales-in-september-continuing-gains-continuing-headwinds/

Home prices increasing annually | Cross River Real Estate

Home prices continued their increasing trends continued to increase in July, but at a slower rate than before, according to the most recent report by S&P CoreLogic Case-Shiller Indices released by S&P Dow Jones Indices and CoreLogic.

“The S&P CoreLogic Case-Shiller National Index is within 0.6% of the record high set in July 2006,” said David Blitzer, S&P Dow Jones Indices managing director and chairman of the Index Committee. “Seven of the 20 cities have already set new record highs.”

“The 10-year, 20-year, and National indices have been rising at about 5% per year over the last 24 months,” Blitzer said. “Eight of the cities are seeing prices up 6% or more in the last year. Given that the overall inflation is a bit below 2%, the pace is probably not sustainable over the long term.”

Annually, the National Home Price index showed a gain of 5.1% in July. This is up slightly from June’s 5% annual gain. The 10-City Composite increased by 4.2% annually and the 20-City Composite increased by 5%. Each of these is down from June’s 4.3% and 5.1% for the respective composites.

Click to Enlarge

Case-SHiller

(Source: S&P Dow Jones Indices, CoreLogic)

“Both the housing sector and the economy continue to expand with home prices continuing to rise at about a 5% annual rate,” Blitzer said. “The statement issued last week by the Fed after its policy meeting confirms the central bank’s view that the economy will see further gains.”

While the Federal Open Market Committee did not raise rates at their last meeting, Janet Yellen, Federal Reserve System chair of the Board of Governors, explained, “Our decision does not reflect a lack of confidence in the economy.”

She explained the Fed preferred to take a more cautious approach to see if current growth would continue.

“Most analysts now expect the Fed to raise interest rates in December,” Blitzer said. “After such Fed action, mortgage rates would still be at historically low levels and would not be a major negative for house prices.”

Out of the 20 cities, Portland, Seattle and Denver reported the highest annual gains over the last six months. In July, Portland increased 12.4%, Seattle increased 11.2% and Denver increased 9.4%.

After seasonal price adjustment, the National Index increased by 0.4% monthly but the 10-City Composite decreased 0.1%. The 20-City Composite remained unchanged.


read more..


Case-Shiller results barely miss housing-boom high