Tag Archives: Chappaqua Real Estate

Chappaqua Real Estate

Bernanke Says Premature Tightening Would Endanger Recover | Chappaqua NY Homes

Federal Reserve Chairman Ben S. Bernanke said raising interest rates or reducing asset purchases too soon would endanger the recovery as the economy remains hampered by high unemployment and government spending cuts.

“A premature tightening of monetary policy could lead interest rates to rise temporarily but would also carry a substantial risk of slowing or ending the economic recovery and causing inflation to fall further,” Bernanke said today in testimony to the Joint Economic Committee of Congress in Washington.

Bernanke lamented the human and economic costs of anunemployment rate at 7.5 percent nearly four years into the recovery from the deepest recession since the Great Depression, and he said the Fed’s record easing is providing “significant benefits.” His comments echoed remarks by William C. Dudley, president of the Federal Reserve Bank of New York, who said in an interview that it would take three to four months before policy makers will know whether a sustainable recovery is in place.

Fed officials “need to see inflation expectations remain in a desired range, they need to see that the peak home-buying season goes as well as it can, and they need to see that we have absorbed the bulk of the huge fiscal consolidation” before they reduce the pace of purchases from $85 billion a month, said Lou Crandall, chief economist at Wrightson ICAP LLC inJersey CityNew Jersey.

Stocks erased an early rally and Treasuries fell after Bernanke said the Fed could “take a step down in our pace of purchases” in the “next few meetings.”

Brady Question

“We’re trying to make an assessment of whether or not we have seen real and sustainable progress in the labor market outlook,” Bernanke said in response to a question from Representative Kevin Brady, the Texas Republican who chairs the committee. “If we see continued improvement and we have confidence that that is going to be sustained, then we could in — in the next few meetings, we could take a step down in our pace of purchases.”

The Standard & Poor’s 500 Index fell 0.6 percent to 1,659.54 at 2:54 p.m. in New York. Yields on the U.S. 10-year note rose above 2 percent for the first time since March.

“The market reacts pretty wildly to any hint of exit,” said Michael Hanson, senior economist at Bank of America Corp. in New York. “It’s a small exit and a lot of people are trying to get out of it — like a rock concert.”

“The Fed is not looking to very quickly get out of this,” said Hanson, a former Fed economist. “There’s obviously a few members who want to wrap this up sooner than later, but Bernanke doesn’t seem eager to pull back on QE very soon. He wants to see more evidence that the economy really is moving on a forward path.”

More Progress

Many Fed officials said more progress in the labor market is needed before deciding to slow the pace of asset purchases, according to minutes of their last meeting released after Bernanke’s testimony.

“Most observed that the outlook for the labor market had shown progress” since the bond-buying program began in September, according to the record of the April 30-May 1 gathering released today in Washington. “But many of these participants indicated that continued progress, more confidence in the outlook, or diminished downside risks would be required before slowing the pace of purchases would become appropriate.”


Bernanke Says Premature Tightening Would Endanger Recover – Bloomberg.

Ratio of Sold to List Prices Shows Inventory Shortages Driving Price Hikes | Chappaqua NY Real Estate

The Sold-to-List Price Ratio, one of the leading market indicators for predicting home prices, is helping analysts predict home prices in markets with varying economic condition, shortages of available housing inventory and its impact on home prices. Pro Teck Valuation Services’ May Home Value Forecast (HVF) Update analyzes the Honolulu, Tucson, San Francisco, and Chicago metro areas to determine how the indicator has been useful from a historical perspective and in current market conditions.

“While many were predicting that REO and the ‘shadow inventory’ would keep real estate markets depressed, in reality the shortage of housing inventory has lead buyers to bid more competitively against one another leading to significant home price increases and tighter housing conditions,” said Tom O’Grady, CEO of Pro Teck Valuation Services. “Aside from anecdotal stories, Home Value Forecast shows that one of the most reliable leading indicators to support this theory is the Sold-To- List Price ratio.”

In May’s Home Value Forecast Update, the authors examine how the ratio of the sold price to the listing price (Sold-to-List Price Ratio) typically fluctuates between 92 percent and 98 percent, but in very hot markets can exceed 100 percent. The update takes a historical look (1978 to 2011) at the Honolulu metro Sold-to-List Price Ratio and the annual percent change in the median condominium sold price.

“The Sold-to-Listed Price Ratio has historically lead home prices by approximately six months over the past three real estate cycles and its turning points have been excellent signals for the same in condo prices,” added O’Grady.

In addition, the authors highlight quarterly value back to 1994 for the Tucson, AZ single family market and determine that the Sold-to-List Price Ratio exceeded 100 percent during the bubble period in 2006, which was indicative of a very frenzied market. The authors also demonstrate that the indicator moves directly with the market itself and can be a useful tool for determining if a market is “hot” as in San Francisco or in “normal” conditions as in Chicago, where the market could transition to heated conditions in the coming year.

This month’s Home Value Forecast update also includes a listing of the 10 best and 10 worst performing metros as ranked by its market condition ranking model. The rankings are run for the single family home markets in the top 200 CBSAs on a monthly basis to highlight the best and worst metros with regard to a number of leading real estate market indicators, including: sales/listing activity and prices, months of remaining inventory (MRI), days on market (DOM), sold-to-list price ratio and foreclosure and REO activity.

“Two of the top markets this month are in Nevada (Las Vegas-Paradise and Reno-Sparks), both of which had been very distressed since their respective market peaks in 2005 and 2006. Also, California continues to be well represented on the list by Los Angeles, Oakland, and Sacramento metros,” said Michael Sklarz, Principal of Collateral Analytics and contributing author to Home Value Forecast. “Nashville’s metro area is a new entrant this month. Although the market has a more shallow correction than many of the other markets in the recent recession, it appears to be experiencing improving overall economic conditions and one of the most affordable markets in the U.S. now.”

May’s top CBSAs include:

Nashville-Davidson-Murfreesboro-Franklin, TN

Sacramento-Arden-Arcade-Roseville, CA

Oakland-Fremont-Hayward, CA

Reno-Sparks, NV

Minneapolis-St. Paul-Bloomington, MN-WI

Las Vegas-Paradise, NV

Warren-Troy-Farmington Hills, MI

Salt Lake City, UT

Los Angeles-Long Beach-Glendale, CA

Dallas-Plano-Irving, TX

“The bottom ranked metros also represent an interesting mix around the U.S. While all have nine to thirteen Months of Remaining Inventory, many of the indicators are showing positive trends even for the bottom metros area this month,” added Sklarz.

The bottom CBSAs for May were:

El Paso, TX

Shreveport-Bossier City, LA

Akron, OH

Spokane, WA

Chattanooga, TN-GA

Dayton, OH

Peoria, IL

Baltimore-Towson, MD

Little Rock-North Little Rock-Conway, AR Rochester, NY

Clarksville, TN-KY

About HomeValueForecast.com


Ratio of Sold to List Prices Shows Inventory Shortages Driving Price Hikes | RealEstateEconomyWatch.com.

Monthly Inventory Rises for First Time in 33 Months | Chappaqua NY Real Estate

The number of homes for sale in April inched 1.6 percent higher than in March, the first month-over-month inventory increase since June 2010, according to the April RE/MAX National Housing Report.

The months supply of homes for sale at April’s pace of sales was just 3.6 months, the lowest supply since the RE/MAX report began in August 2008.   Closed transactions and median prices both remained 10 percent higher than last year’s levels, signs of a strong housing recovery in regions across the country.  Low inventories contribute to a limited growth in sales, preventing some buyers from closing on the home of their choice.

“April was exactly what we needed at this time in the housing recovery.  Home sales and prices continued to rise, while we started to see improvement in the number of homes for sale,” said Margaret Kelly, CEO of RE/MAX, LLC.  “It may take a few months, but as prices rise and more homeowners gain positive equity, we should see an increase in the inventory of homes for sale, resulting in a much better selection for potential homebuyers.”

The April RE/MAX Housing Report showed an 8.1 percent increase in closed transactions over March and a 10.5 percent increase over sales in April 2012, making April the 22nd month in a row experiencing higher sales than the same month in the previous year.  Real estate agents across the country are reporting increased traffic and expect the upcoming summer selling season to be even stronger than last summer. Of the 52 metro areas surveyed in April, 41 reported higher sales than April 2012, and 25 reported double-digit gains, including:  Honolulu, HI +53.2 percent, Burlington, VT +40.3 percent, Albuquerque, NM +40.2 percent, Charlotte, NC +39.4 percent, Raleigh & Durham, NC +38.1 percent and Chicago, IL +33.4 percent.

The Median Price for all homes sold in April was $177,200, which was 4.7 percent higher than the median price in March and 10.7 percent higher than the price in April 2012.  For 15 months in a row, the median price has been higher than in the same month of the previous year. Until the inventory balances, home prices should remain higher than those in the previous year. Of the 52 metro areas surveyed in April, four saw their median prices drop below last year’s price: Los Angeles, CA -9.1%, Albuquerque, NM -6.3 percent, Cleveland, OH -1.8 percent and Providence, RI -0.3 percent.

However, a total of 48 metros saw year-over-year price increases, with 21 reporting double-digit increases, including:  Detroit, MI +44.1 percent, San Francisco, CA +42.2 percent, Atlanta, GA +38.9 percent, Las Vegas, NV +31.6 percent, Orlando, FL +24.6 percent and Phoenix, AZ +23.8 percent.


RE/MAX: Monthly Inventory Rises for First Time in 33 Months | RealEstateEconomyWatch.com.

6 Tips to Grow Your Twitter Followers | Jeffbullas’s Blog | Chappaqua Realtor Reading


Twitter has been my number one social media platform for quite a long time. That was actually the first social network I embraced after I started my blog.
6 Tips to Grow Your Twitter Followers

Over the course of more than two years I dedicated a lot of my free time to not only expanding my Twitter network but to also to actually engage with  people who cared about what I shared and who enjoyed my content.
As much as you’d like to say that quantity doesn’t matter, well, it does.

The more people I “persuade” to follow me, the more visitors my blog ends up receiving. The traffic Twitter brings me is now significant with 5,500 visitors a month coming from the 140 character social network.

If you’d like to increase your Twitter traffic the way I did, here are six of the most effective ways to get more quality Twitter followers that I have discovered.

Anyway, let’s get started:

1. Start with the profile picture

When someone lands on your profile, the first thing to catch their eye is your profile picture.

Especially now with the new profiles, where the photo is at the center of the header, it can really give people a hint of whether or not they should click ‘follow’.

Twitter profile

So, when it comes to choosing a suitable avatar, there are three golden rules:

1. Make sure it’s a photo of “you”

When you follow someone you expect them to be a real person. And unfortunately when it comes to Twitter, there are literally millions of fake accounts. That is why you have to make sure to add a real photo and not one you found on the internet for instance. Additionally if you are a business then you are far better off creating an additional Twitter account instead of putting a business logo on your personal profile just to promote your business.

2. Make sure it’s big enough

A lot of people tend to click on the avatar to see a person’s profile picture in a bigger size. There are a lot of folks out there however, whose photo is just as big as the size of the frame. What I’d advice you is to re-size your photo to say 300 by 300 pixels, so that it actually becomes bigger once someone clicks on it. A small, blurry and pixellated picture says that you don’t pay attention to the small details and that isn’t a good start.

3. Make sure your face is recognizable

What many Twitter users do is to simply upload a picture of them in full-size. Consider how small the avatar is, if you put a whole-body picture, then end result will be hard to distinguish. So absolutely make sure that the photo is only of your upper-body.

2. Don’t forget about hashtags

Hashtags are kinda like when you use a specific keyword within an article to make it rank higher in the search engines. When you use them, you are targeting your tweet to the people using the words you’ve included in your hashtags.

Twitter hashtag

I used to have a problem with hashtags. In my eyes they just didn’t look good and were making some of the tweets look quite unreadable.

But you know what?

Hashtags aren’t the problem. Using them is a great way to guarantee your message gains more exposure with the right people.

The problem is how you use them.

The 3 “Don’ts” of Hashtags

1. Don’t include too many

Let’s assume you are sharing an article of yours on Twitter and decide to add some hashtags to improve its visibility. Since the title is short and doesn’t take much of your 160 characters limit, you decide to include five hashtags. Is that a good move? No. It just looks spammy… And no one likes that kind of obvious self-promotion. I’d say two or three hastags at most.

2. Don’t be too specific

Twitter unlike Google doesn’t have a huge search volume. This basically means that you can get your message seen even if you use a broader term. On the other hand if you are too specific, probably no one is going to see your tweet via Twitter search. I’ve found that including more general terms like #Marketing,#SocialMedia#Blogging or #Design results in the most retweets and favorites.


6 Tips to Grow Your Twitter Followers | Jeffbullas’s Blog.

Maine’s Real Estate Report | Chappaqua Real Estate

Today’s Real Estate Report – Maine
At Gay Realty Watch, we look for news to share with you about the gay real estate market – both lgbt real estate news and news specific to gay and lesbian real estate meccas. If you have a gay real estate story that you’d like to share with us, contact us at info@gayrealtynetwork.com.

Today, in our ongoing series about local real estate markets, we’ll take a look at home sales and trends in the Maine real estate market.

Overall, Maine home sales were up more than 8% in the first quarter of 2013 vs. 2012, the Bangor Daily News reports:

In Maine, home sales were up 8.3 percent in the first quarter of 2013 compared with the same quarter last year. During the same period, home sales in the Bangor metropolitan service area, which includes all of Penobscot County, were up 9.1 percent, while the Portland metropolitan service area — which is York, Cumberland and Sagadahoc counties — experienced an 8.6 percent rise in home sales, according to Nothaft.

Maine’s home prices have not seen a big spike, but then the market didn’t suffer as much during the recession as other states:

“You had a big run-up in home values, but it pales in comparison to what we saw in some of the real hot markets that are the poster childs for the boom and bust,” Nothaft said. “The decline in home values, while pretty substantive here in this market — 15 percent or so decline from the peak — is much more moderate compared to what we see in national indices and much more moderate relative to what we saw in the really distressed markets … like Las Vegas down 60 to 70 percent in value. So it’s a much more moderate boom and bust relative to other markets.”

Real estate business is up along Maine’s Midcoast as WCSH reports:

People in the real estate business in the Midcoast say they’ve seen a noticeable increase in business this year. Brokers say homes are selling in all price ranges, which is a change from the past few years, They also say that more people are looking at houses, apparently encouraged by a better economy and continuing low mortgage interest rates.

Up north, things aren’t going as well for The County. The St. John Valley Timesreports:

The number of existing, single-family homes sold (units) and volume (MSP) during the months of January, February and March of 2012 and 2013 for Aroostook County are as follows:

In this rolling quarter of 2012, 65 of the state’s 1,902 units were from The County. For this rolling quarter of 2013, 52 of the state’s 2,049 units were from The County. “Units Sold” therefore saw a decrease of 20 percent. MSP for this rolling quarter of 2012 was $79,000 in Aroostook County. MSP for this rolling quarter of 2013 was $74,500. “MSP” therefore saw a decrease of 5.7 percent. Aroostook County saw the largest percentage drop in Units Sold of all 16 Maine counties for this rolling quarter.


Gayapolis News – Today’s Real Estate Report – Maine.

Australian Properties start moving as real estate market returns to form | Chappaqua Real Estate

Estate agents yesterday said since the rate cut there had been a sharp increase in activity, with phones running hot the moment the cut was announced.

Zak Smith from LJ Hooker Everton Park said he had noticed an increase in buyer interest immediately after the RBA announced the cut.

“The moment the announcement was made my phone started ringing,” Mr Smith said. “I had three calls on the same property within three hours of interest rates dropping. It’s a great boost because normally this is when the market can slow down.”

Mr Smith said a home at 903 South Pine Rd, Everton Park, had received a lot of new interest since the announcement.

“It’s a brand-new, massive two-storey home, so there’s a lot to like about it,” he said. “It’s just been reduced to offers over $499,000, which is a great deal. The buyers are out there still and with the interest rates cut, they now have a lot more incentive.”

New figures from RP Data show the property market is now a lot more positive than last year.Home sellers in the northern suburb of Deagon faced a bleak prospect last year. Median house prices were down 17.8 per cent, and the time on market was a frustrating 132 days.

Newstead house


http://www.theaustralian.com.au

What $700K Can Buy You Around The Cape & Islands | Chappaqua Homes

↑ Kicking off in Provincetown with The Boathouse, a 1BR, 1BA condo directly on Cape Cod Bay. Built in 1900, the year-round 487 sq. ft. freestanding cottage has waterviews on three sides, an exclusive use deck and parking for one. The property last changed hands in 2005 for $685,000 and returned to the market in May 2011 asking $735,000. The listing was removed in October 2011 and reappeared last month with a $729,300 price tag.


http://capecod.curbed.com/archives


Drought Tolerant Perennials | Chappaqua Real Estate

In my neck of the woods precipitation comes one of two ways; either all at once or not at all. Spring sees ample showers, but as soon as the calendar turns to June the rain dries up. Unless there is an unusual weather pattern in play I can count on Arkansas’ summers to be hot and dry.

Rather than rely 100 percent on irrigation to carry the garden through, I choose drought tolerant plants that I know will survive extended periods without rain. By selecting the right plants for my dry climate I use less water and I don’t have to work as hard to keep the garden looking good during the dog days of summer.

To make things even easier I use a lot of drought tolerant perennials. Perennials will come back year after year without replanting and most are pretty low maintenance. Throw in drought tolerance and you’ve got something you can pretty much plant and forget.

Unlike annuals, many perennials bloom for a specific amount of time. Gardeners can create season-long interest by selecting spring, summer and fall flowering perennials and showy foliage plants.

Here’s a short list of drought tolerant perennials categorized by season.

Spring Flowering Drought Tolerant Perennials

Alyssum (Alyssum montanum)

Alyssum will form a dense mat of attractive foliage and spring blooms. Try River of Gold™ for its bright yellow flowers.

Zones 4 – 8; full sun; 6 to 8 inches tall with a 10-inch spread.

Proven Winners River of Gold Alyssum

Dead Nettle (Lamium maculatum)

Lamium is a low growing groundcover for either sun or shade. The variety Pink Chablis® has charming pale pink flower and frosty green and white variegated leaves.


Zones 4 – 8; full sun or shade; 8 – 12 inches tall with a 24-inch spread.

Proven Winners Pink Chablis Lamium

False Indigo (Baptisia hybrid)

Baptisia is a North American native plant that produces sweetpea-like blooms. Try one of the hybrids in theDecadence™ series for compact plant form and saturated color. Available cultivars include ‘Cherries Jubilee’ (maroon and yellow), ‘Blueberry Sundae’ (vibrant blue), ‘Dutch Chocolate’ (dark plum), and ‘Lemon Meringue’ (yellow).

Zones 4 – 9; full sun to partial shade; 30 – 26 inches tall.

Proven Winners Decadence Baptisia

Summer Flowering Drought Tolerant Perennials

Evening Primrose (Oenothera)

Oenothera has a loose, wildflower appearance that makes it right at home in cottage-style gardens. The cultivar Lemon Drop® produces fragrant, yellow blooms all summer. It is both drought tolerant and adaptable to poor soils. Because Lemon Drop® does not set seeds like some of its freewheeling cousins, it will stay put rather than pop up around the garden.

Zones 5 – 11, full sun; 8 – 12 inches tall.

Proven Winners Lemon Drop Oenothera

Perennial Sunflower (Heliopsis)

The bright yellow, daisy-like flowers of this North American native plant brighten the garden. The improved cultivar ‘Tuscan Sun’ boasts an extended blooming season and stays a manageable size.

Zones 3 – 9; full sun to partial shade; 12 – 20 inches tall.

Proven Winners Tuscan Sun Heliopsis

Butterfly Flower (Gaura lindheimeri)

This is one of my favorite “see through” plants. I like to position Gaura in the middle of a flower border so that the loose stems create a veil through which the background plants are seen. This creates a little mystery and added dimension. Stratosphere™ Pink Picotee and Stratosphere™ White will bloom May through September.

Zones 6 – 11; full sun; 12 – 24 inches tall.

Proven Winners Stratosphere Gaura

Fall Flowering Drought Tolerant Perennials

Sedum sp.

Sedums are a classic choice for low water gardens. There are both spreading and upright forms. The upright cultivar ‘Maestro’ puts on a spectacular autumn show with abundant bright purple bloom stalks and pink flowers.

Zones 3 – 9; full sun; 24 – 30 inches tall.

Proven Winners Maestro Sedum

Aster sp.

What would the fall garden be without asters? I’m particularly fond of the blue and purple varieties because the colors complement the red, orange and yellow of the season. ‘Sapphire Mist’ produces an abundance of large, lilac blooms on compact plants from late summer through fall.

Zones 4 – 8; full sun; 12 – 16 inches tall.

Proven Winners Sapphire Mist Aster

Bluebeard (Caryopteris sp.)

Caryopteris blooms are a splash of cool blue at the end of summer. Sunshine Blue® Caryopteris incana is one I grow. I love the color combination of the neon yellow foliage and periwinkle flowers.

Zones 5 – 11; full sun; 36 – 48 inches tall.

Proven Winners Sunshine Blue Caryopteris

Drought Tolerant Perennials Prized for their Foliage

Ornamental Grasses

Pair ornamental grasses with bold blooms or fleshy leaves to create an interesting texture combination. ‘Cheyenne Sky’ Red Switch Grass (Panicum) is part of my Proven Winners® Platinum Collection. It’s a chameleon that changes from blue-green to wine red over the course of the summer.

Zones 4 – 9; full sun; 30 – 36 inches tall.

Proven Winners Cheyenne Sky Switch Grass

Heuchera sp.

You’ll be amazed at the variety of color and pattern available with such an easy care plant. I’m a huge fan of the varieties in the Proven Winners® Dolce® Series, which range in color from chartreuse to almost black.


Zones 4 – 9; full sun to partial shade; 8 – 16 inches tall.

Proven Winners Dolce Heuchera

Wood Spurge (Euphorbia amygdaliodes)

This plant blooms in spring, but the foliage is its greatest asset. The cultivar ‘Helena’s Blush’ has variegated green and white leaves that develop bright pink highlights as the temperatures cool in autumn.

Zones 6 – 9; full sun; 16 – 20 inches tall and 20 inches wide.

Proven Winners Helena's Blush Euphorbia

Good to Know

Even drought tolerant plants need water just after planting, water your newly planted drought tolerant perennials weekly the first growing season.


http://www.pallensmith.com/articles

A Step-by-Step Guide to Building an Excel Graph [Quick Tip] | Chappaqua NY Realtor

Building graphs is part of most people’s jobs — they’re the best way to present information in a clear, easily digestible manner that can then serve to influence the decision-making process within an organization. But there are some people out there that get a little bit intimidated by the prospect of poking around in Excel. I, however, adore the thing (I work in Marketing Ops, so it’s pretty much a requirement).

So I thought I’d share some step-by-step instructions for anyone out there that cringes at the thought of sorting a spreadsheet full of data into a chart that actually, you know,means something. Here are the simple steps you need to build a graph in Excel.

Step 1: Get your data into Excel.

First, you need to input your data into Excel. This is the easy part! You may have exported the data from elsewhere, like a piece of marketing software or a survey tool. Or, you might be inputting it manually.

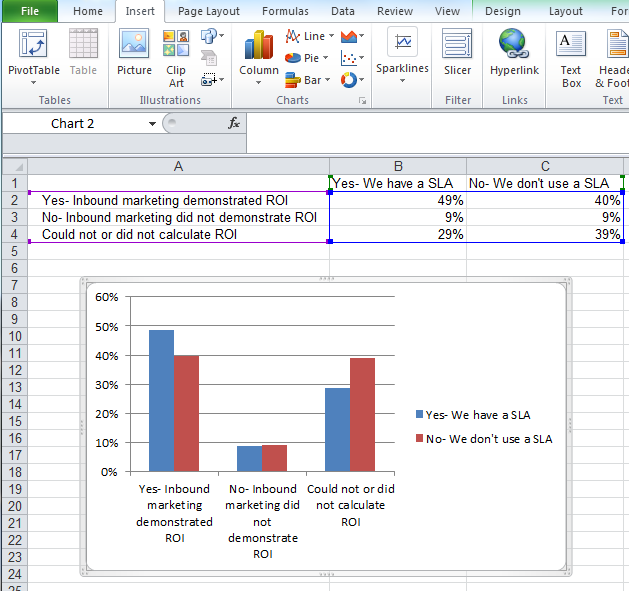
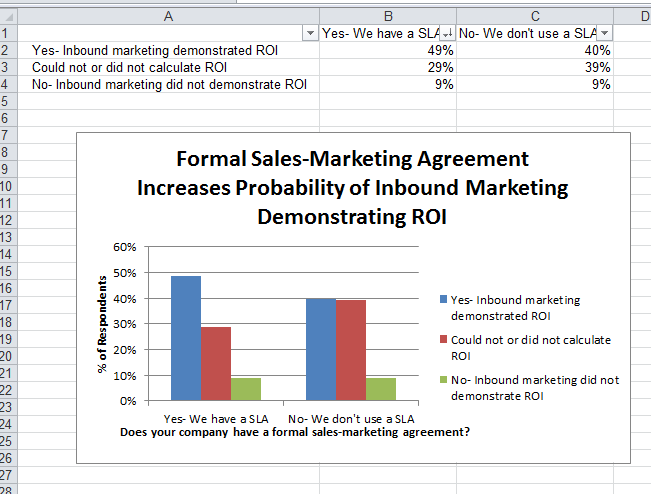
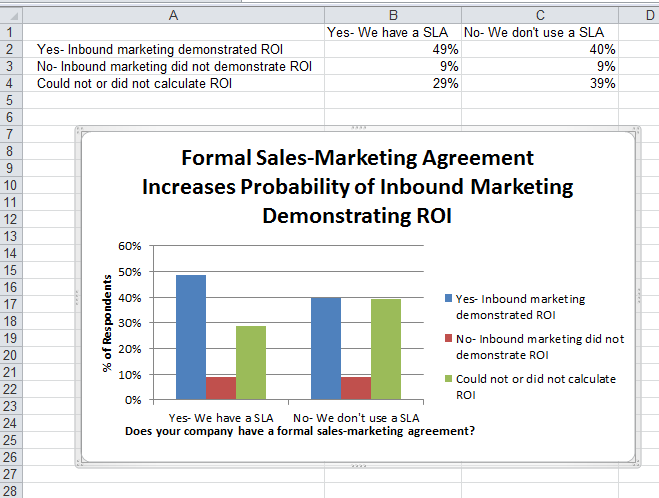
In the example below, in Column A, I have a list of the responses to the question “Did inbound marketing demonstrate ROI?”, and in Columns B,C, and D, I have the responses to the question “Does your company have a formal sales-marketing agreement?”. For example, Column C, Row 2 illustrates that 49% of people who have an SLA also say that inbound marketing demonstrated ROI.

excelgraphblogpostpicture1

Step 2: Choose a type of graph to create.

You have plenty of choices for charts and graphs to create. This data will look best in a bar graph, so let’s pursue making that one. To make a bar graph, highlight the data and include the titles of the X and Y axis. Go to the ‘Insert’ tab, click ‘Charts,’ click ‘Column,’ and choose the graph you wish (in this example I will be picking the first 2-D Column choice — just because I prefer it over the 3-D look).

finalgraphmay4blogstep2

Step 3: Switch axes, if necessary.

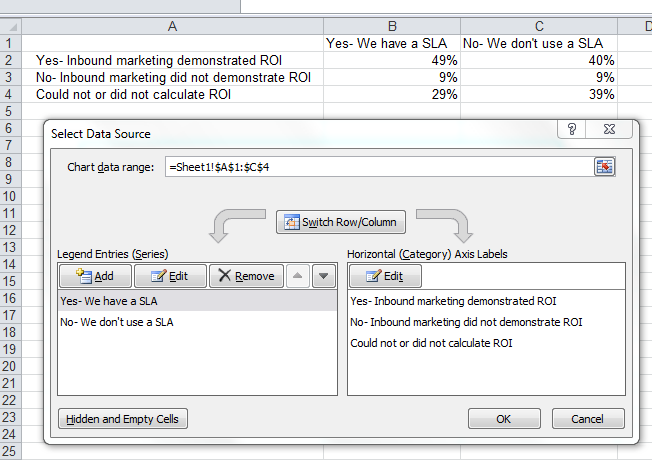
If you want to switch what appears on the X and Y axis, right click on the bar graph, click ‘Select Data,’ and click ‘Switch Row/Column.’

finalgraphmay4blogstep3

Step 4: Adjust your labels and legends, if desired.

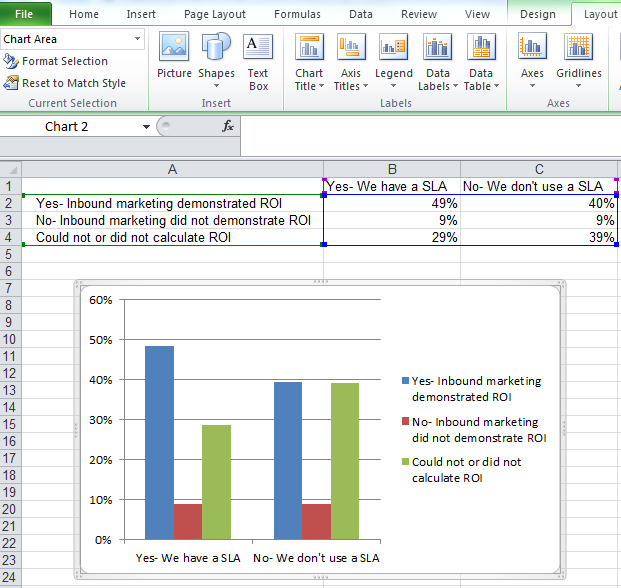
To change the layout of the labeling and legend, click on the bar graph, then click the ‘Layout’ tab. Here you can choose what layout you prefer for the chart title, axis titles, and legend.

In my example, I clicked on ‘Chart Title,’ and selected ‘Above Chart.’ To format the X axis title, I clicked on ‘Axis Titles’, clicked ‘Primary Horizontal Axis Title’, and clicked ‘Title Below Axis.’ To format the Y axis title, I clicked on ‘Axis Titles,’ clicked ‘Primary Vertical Axis Title,’ and chose ‘Rotated Title.’ To change the placement of the legend, click ‘Legend’ on the ‘Layout’ tab and choose your preferred location.

finalgraphmay4blogstep4

Step 5: Change the Y axis measurement options, if desired.

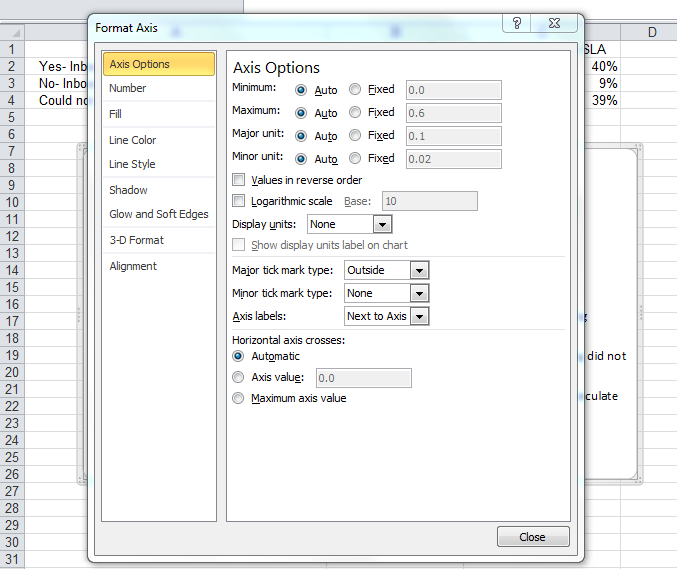
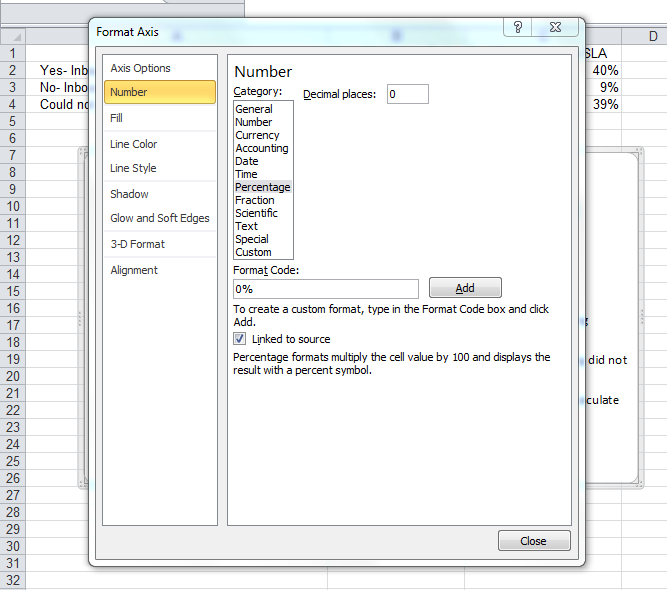
To change the type of measurement shown on the Y axis, right click on the Y axis percentages, and click ‘Format Axis.’ Here you can decide if you want to display units located on the Axis Options tab, or if you want to change whether the Y axis shows percentages to 2 decimal places or to 0 decimal places.

finalblogmay4step5p1

finalblogmay4step5p2

The resulting graph would be changed to look like this:

finalblogmay4step5p3

Step 6: Reorder data, if desired.

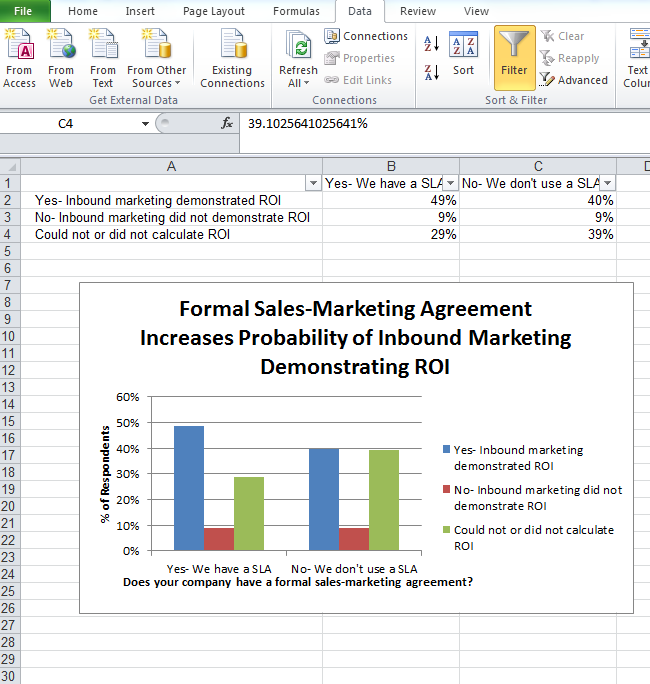
To sort the data so that the software choices appear in descending popularity order, click on the column that is most important to you (in this case I picked column B), click on the ‘Data’ tab, and click ‘Filter.’ Then go back to Column B and click the down arrow and click ‘Sort Largest to Smallest.’

finalblogmay4step7p1

If you click on the downward arrows located at B1 and C1, you can choose to sort based on smallest to largest or largest to smallest, depending on your preference. Here, I sorted largest to smallest on B1.

finalblogmay4step7p2-1

Pretty easy, right? What other Excel functions have you always wanted help with?


http://blog.hubspot.com/how-to-build-excel-graph

Hottest Digs of April 2013 – Zillow | Chappaqua Realtor

Rain clouds couldn’t dampen design fans’ spirits this April with these top-10 photos from Zillow Digsinspiring remodel dreams across the country. Check out what images you and your friends Dug the most this month:

No. 10

Zillow's Hottest Digs of April 2013 No. 10
Outdated no longer! A stale bathing unit gets a major overhaul with glass and marble, creating a modern look.

Zillow's Hottest Digs of April 2013 User No. 10

No. 9

Zillow's Hottest Digs of April 2013 No. 9
This kitchen mixes metal, wood and marble, adding interest to the space. This island’s dark wood stain is a bold, yet tasteful contrast with white cabinetry on the adjacent wall.

Zillow's Hottest Digs of April 2013 User No. 9

No. 8

Zillow's Hottest Digs of April 2013 No. 8
A staging counter allows home chefs to gather the exact items needed per recipe without making multiple trips.

Zillow's Hottest Digs of April 2013 User No. 8

No. 7

Zillow's Hottest Digs of April 2013 No. 7
Padded benches along the hearth offer extra seating options, while exposed brick and wood beams draw guests to the table.

Zillow's Hottest Digs of April 2013 User No. 7

No. 6

Zillow's Hottest Digs of April 2013 No. 6
Not yet outdone, these modern basins defend their title as the No. 6 Hottest Digs for the second month in a row.

Zillow's Hottest Digs of April 2013 User No. 6

No. 5

Zillow's Hottest Digs of April 2013 No. 5
Users may have been divided when it came to their favorite feature of this closet, but one thing they could all agree on — there’s no such thing as too many shoes!


http://www.zillowblog.com