Tag Archives: Chappaqua NY
Westchester Down to Earth Markets | Chappaqua NY Realtor
Westchester
Croton-on-Hudson Farmers Market
Closed for the season. Check back!
Market open Wednesdays, 1:30PM – 6:30PM, 05/30 – 11/21
Lot on Municipal Place – off Rt 9 exit (Map it »)Larchmont Farmers Market
Closed for the season. Check back!
Market open Saturdays, 8:30AM – 1:00PM, 05/26 – 12/15
Parking lot off Chatsworth Ave – enter Myrtle Blvd (Map it »)Mamaroneck Winter Farmers Market
Market open Saturdays, 9:00AM – 1:00PM, 01/05 – 05/18
St. Thomas’ Episcopal Church (Map it »)New Rochelle Farmers Market
Closed for the season. Check back!
Market open Fridays, 8:00AM – 3:00PM, 06/22 – 11/16
Library Green — Huguenot & Lawton Streets (Map it »)Ossining Farmers Market
Closed for the season. Check back!
Market open Saturdays, 8:30AM – 1:00PM, 05/26 – 12/15
Parking Lot on the corner of Spring & Main Streets (Map it »)Ossining Winter Farmers Market
Market open Saturdays, 9:00AM – 1:00PM, 01/05 – 05/18
Parking Lot on the corner of Spring & Main Streets (Map it »)Rye Farmers Market
Closed for the season. Check back!
Market open Sundays, 8:30AM – 2:00PM, 05/27 – 12/16
Parking lot behind Purchase St. stores (Map it »)Tarrytown Farmers Market
Closed for the season. Check back!
Market open Saturdays, 8:30AM – 1:00PM, 05/26 – 11/17
Patriot’s Park on N. Broadway (Rt. 9) (Map it »)
There goes the neighborhood: mansions in distress | Chappaqua Homes
Don’t Let These Tax Credits Go Down the Drain | Chappaqua Real Estate
Freddie Mac outlook: Housing activity remains stale | Chappaqua NY Real Estate
Chappaqua NY Weekly Real Estate Report | RobReportBlog
Chappaqua NY Weekly Real Estate Report
Homes for sale 92
Median Ask Price $1,182,500.00
Low Price $429,000.00
High Price $4,750,000.00
Average Size 4270
Average Price/foot $366.00
Average DOM 132
Average Ask Price $1,773,956.00
Pent-up demand fuels home sales: NAR | Chappaqua NY Real Estate
The national median home price saw the strongest year-over-year increase in seven years as a growing number of metropolitan areas posted higher median values in the fourth quarter of 2012, the National Association of Realtors said.
Favorable affordability conditions, increasing rent rates, demand for housing and job creation are some of the drivers leading to solid home price performance, said chief economist Lawrence Yun at NAR.
“Home sales are on a sustained uptrend, mortgage interest rates are hovering near record lows and unsold inventory is at the lowest level in 12 years,” he said. “Our population has been growing faster than overall housing stock, so supply and demand dynamics are very much at play.”
The median existing single-family home price rose in 133 out of 152 metropolitan statistical areas (MSAs) based on closings in 4Q12, compared with the previous year. Additionally, 19 areas had prices drop, NAR said.
The national median existing single-family home price hit $178,900, up 10% from last year. This is the strongest year-over-year price increase since the fourth quarter of 2005, when the median price rose 13.6%.
A contracting market share of lower priced homes continues to account for price growth.
For instance, distressed homes accounted for 23% of fourth quarter sales, down 30% from the previous year, according to NAR.
Relatively few fish die if NY nukes continue, feds say | Chappaqua Homes
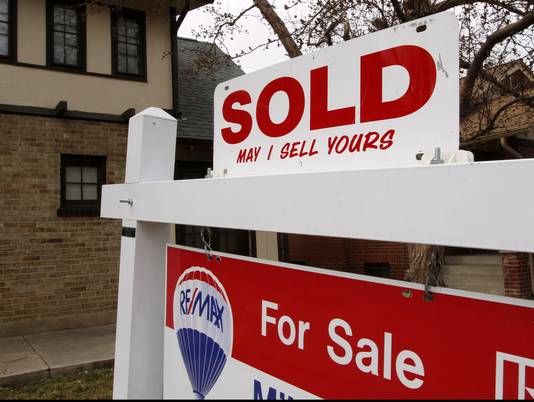
Home prices post biggest gains in over 6 years | Chappaqua Homes

Home sold in south Denver in March 2012.(Photo: David Zalubowski, AP)
U.S. home prices jumped by the most in 6½ years in December, spurred by a low supply of available homes and rising demand.
Home prices rose 8.3%in December compared with a year earlier, according to data Tuesday from CoreLogic, a real estate data provider. That is the biggest annual gain since May 2006. Prices rose last year in 46 of 50 states.
Home prices also rose 0.4%in December from the previous month. That’s a healthy increase given that sales usually slow over the winter months.
Steady increases in prices are helping fuel the housing recovery. They’re encouraging some people to sell homes and enticing some would-be buyers to purchase homes before prices rise further.
Higher prices can also make homeowners feel wealthier. That can encourage more consumer spending.
Most economists expect prices to keep rising this year. Sales of previously-occupied homes reached their highest level in five years in 2012 and will likely keep growing. Home builders, encouraged by rising interest from customers, broke ground on the most new homes and apartments in four years last year.
Ultra-low mortgage rates and steady job gains have fueled more demand for houses and apartments. More people are moving out into their own homes after doubling up with friends and relatives in the recession.
At the same time, the number of previously-occupied homes for sale has fallen to the lowest level in 11 years.
“All signals point to a continued improvement in the fundamentals underpinning the U.S. housing market recovery,” said Anand Nallathambi, CEO of CoreLogic.
The states with the biggest price gains were Arizona, Nevada, Idaho, California, and Hawaii. The four states were prices fell were Delaware, Illinois, New Jersey and Pennsylvania.
The housing recovery is also boosting job creation. Construction companies have added 98,000 jobs in the past four months, the best hiring spree since the bubble burst in 2006. Economists forecast even more could be added this year.
Housing has been a leading driver of past recoveries. But the bursting of the housing bubble pushed a flood of foreclosed homes on the market at low prices. That made it hard for builders to compete.
And a collapse in home prices left millions of homeowners owing more on their mortgages than their houses were worth. That made it difficult to sell.
Now, six years after the bubble burst, those barriers are fading. Some economists forecast that housing could add a point or more to economic growth this year.


