Homebuilder stocks continued to outperform last week with Keefe, Bruyette & Woods reporting that homebuilder stocks jumped 4.1% for the week ending Jan. 25.
That is up from the S&P 500’s 1.1% increase in the same week and the S&P 500 Financial Index’s 1.3% jump, KBW said.
“Building products companies and mortgage insurers were strong, while non-agency REITs and mortgage servicers were weak,” KBW noted when comparing builders to other parts of the housing industry.
Homebuilder stocks are up 10.9% month-to-date, compared to only a 5.3% increase for the S&P 500 and a 6% increase for the S&P 500 Financials Index.
“In 2012, homebuilder stocks were up 122.8% vs. +13.4% for the S&P 500 and +26.3% for the S&P Financials Index,” KBW analysts said. “Historically, homebuilders have outperformed the S&P 500 in January by 3.5-6.0%.”
Tag Archives: Bedford Hills Real Estate
Warren Group: Massachusetts housing market as ‘turned the corner’ | Bedford Hills Realtor
In another sign that the housing market may be on the mend, the median sale price of single-family homes in Massachusetts rose more than 12 percent in December to $300,000, the first time since August that median home prices have broken the $300,000 mark, the Warren Group said Thursday.
Looking at the entire year, the Warren Group added that single-family home sales in Massachusetts rose 18 percent in 2012, marking 12 consecutive months of year-over-year sales gains and the best year on record since 2006.
“I would characterize 2012 as the year of robust recovery in the real estate market,” Warren Group chief executive Timothy M. Warren Jr. said in a statement. “It is clear we have turned the corner and are gaining ground rapidly. I contrast the 18 percent gain last year with the decline of 6 percent in 2011.”
As for condo sales in December, they rose 5.4 percent to 1,402 units. The median condo price in December rose 8 percent to $275,000, the Warren Group said.
For 2012, condo sales were up more than 25 percent to 19,061 units.
The Massachusetts Association of Realtors issued a separate monthly report Thursday on the local housing market. The association uses a slightly different method to track real estate activity than the Warren Group does.
According to the association’s press release, 3,737 detached single-family homes sold in December, a 13 percent increase from the previous December. December 2012 was the 18th straight month of year-over-year increases.
The median selling price for single-family home in December was $303,500, which was up 10.4 percent from the price in December 2011.
In the Bay State, there were 1,434 condominiums sold this December, a 14.2 percent increase from the same time last year.
The median selling price for condominium in December was $282,750, which was up 8.7 percent from December 2011.
“December capped off a very active year in 2012 as the real estate market in Massachusetts made significant progress towards recovery,” association president Kimberly Allard-Moccia said in a statement. “With the ‘fiscal cliff’ averted for now and pending activity remaining strong, we anticipate a healthy start to 2013.”
Allard-Moccia suggested that there are some concerns about the short supply of homes on the market.
“2012 was the type of year the market needed to help it eventually recover,” said Allard-Moccia. “With inventory continuing to go down, we’re at risk for slipping back to where we were. A truly vibrant market has a good selection of homes at all price levels for all types of buyers.”
Tips for building trust with luxury international buyers | Bedford Hills Real Estate
Becoming a successful global luxury real estate agent is all about “relationships and reputation,” says The Corcoran Group’s Patricia Cliff, who estimates that 40 percent of her business is international.
Cliff, whose book, “The Art of Selling Luxury Real Estate,” was published this month, attributes her success not to heavy socializing, but to strategic relationships.
A senior vice president at Corcoran, Cliff shared more insight into the topic in a conversation with Corcoran CEO Pamela Liebman during a panel discussion at Real Estate Connect New York City.
Agents are the spark that bring transactions to life, Liebman said. That’s why Corcoran’s new website, launched in November, integrated social media so thoroughly into its design. “Our website has become a hub for online relationships,” she said.
When Cliff travels, looking to establish relationships or maintain the ones she has, she hosts no lavish parties, but instead focuses on cultivating trusted personal relationships. She picks out two to five of the most valuable contacts in a certain place and sets up meetings with them in advance.
Patricia CliffOr, if she doesn’t know some influential potential clients in a place, she looks to enter their spheres. For example, when she went looking for high-end clients in Hong Kong, Cliff went to a jeweler to see about buying pearl and diamond earrings in the hope of sparking a relationship with the jeweler. She employed the same strategy with a Rolls-Royce dealer and private bankers.
Cliff said she helped establish her reputation as a valuable expert for potential clients by writing a 28-page booklet describing the ins and outs of doing real estate transaction in New York City, distributing it to clients early on in a relationship. The booklet also made her life easier, she said — she didn’t have to repeat herself with the same detailed explanations of how to navigate the New York City real estate world over and over again.
When hosting a potential client in the U.S., Cliff said, it’s important to cast a “net” around them and provide an attentive, high level of service, in order to prevent other agents or brokers from swooping in to represent them. And try not to leave clients until a contract is signed. If they’re visiting New York City, for example, the excitement of being in the city and the agent’s enthusiasm creates the ideal atmosphere to close the deal, she said.
Pamela LiebmanLiebman said that sometimes agents will say “you won’t see me for a couple of days,” because they have a client coming into town, and their every waking hour will be committed to taking care of their needs and providing the exceptional, top-level service that many luxury real estate buyers and sellers expect and are accustomed to.
But before getting too caught up in their zeal to capture high-end clients — and a big pay day — it’s important that agents know who they’re dealing with. Potential clients may not have accessible assets in U.S. banks, and since 9/11 moving money into the U.S. has become much more difficult, Cliff said.
Banks are beholden to a “Know Your Customer” provision of 2001’s U.S. Patriot Act that requires banks and financial institutions to add measures to restrict funds associated with terrorist financing and money laundering, which can hamstring otherwise promising deals, Cliff said.
In fact, Cliff said, at one point the FBI had placed her under investigation because of a relationship with a former client, though she knew him only through intermediaries.
At the end of the day, Liebman said, agents who want to deal in luxury real estate can do themselves some good by being in New York City, and knowing a little about its architecture, history and the real estate conversations that happen around the world.
LinkedIn Removes its Best Feature | Bedford Hills Real Estate
I was beyond dismayed to receive an email this morning from LinkedIn, indicating that they are retiring their (in my opinion) best feature: LinkedIn Answers.
LinkedIn Answers is (was) a Quora-type question and answer forum, where business people could ask for advice in a variety of topical categories. In turn, professionals could answer questions in their area of expertise, which in my experience, was THE best lead-generating activity one could do on LinkedIn.
Why LinkedIn Answers was the Best
LinkedIn Answers was better than any question and answer forum on the web for several reasons:
1) Credibility: Nowhere else on the web can you get an answer to a question and immediately click through to review the person’s entire professional history. This provided an instantaneous and thorough way to evaluate the credibility of the advice given.
LinkedIn Answers also helped professionals add credibility to their LinkedIn profiles. The act of answering a question generated an activity item on one’s profile, which also showed up in the news feed of their connections. Additionally, after answering enough questions in a category, one could earn “Expert” status and be featured on the Answers homepage and in those categories.
2) Focus: The questions and answers being traded on LinkedIn Answers were about business. Although other question and answer sites have categories for business, there are none that are as business-focused and as widely used by business professionals in the world. Because of LinkedIn’s enormous worldwide presence, one could find an expert to answer even the most obscure/niche business questions through LinkedIn Answers.
3) Organization: Today’s LinkedIn email suggests asking questions in groups and via polls. This is highly ineffective for two reasons. First, groups are incredibly noisy places where people constantly try to promote themselves. In my experience, very little “real” discussion occurs in groups. Secondly, Polls have no categorization and are only viewed by connections. In LinkedIn Answers, I could ask my question in a specific category and get an answer from an expert in that category, regardless of whether I was connected to them or not.
4) Lead Generation: In the experience of my colleagues, clients, and myself, LinkedIn Answers was hands-down THE best lead generation tool on the site – perhaps even on the entire web. The psychological concept of reciprocity never failed me when I was answering questions on LinkedIn Answers. If I took the time to give a very thorough and helpful answer, the asker would nearly always write me back a personal message of thanks, and would often either ask to have a further discussion (hello, LEAD!), connect with me and follow me elsewhere (increasing my exposure to their network), and/or share my content with others (because it helped them so much). The “pay it forward” and “give to get” concepts that go along with answering questions on LinkedIn Answers never failed to get me leads and enhance my business presence on the web.
Irreplaceable Value
Where can I go for all of that now? Nowhere.
How LinkedIn Killed its Best Feature
LinkedIn greatly diminished the potential of its Answers feature by hiding it. It didn’t even have it’s own menu item in the site’s main navigation. One had to click on the “More” menu item at the far right to find it.
I kid you not, just last night I gave a presentation about LinkedIn to 27 business professionals, of whom nearly all were members of LinkedIn. When I asked who had heard of LinkedIn Answers, not a single hand went up. I then proceeded to tell them about the feature and show them examples of how it had produced leads for me. Many were beyond excited to try it.
I now have to message them all and tell them that LinkedIn decided to remove this incredibly valuable lead-generating tool, and that there is nothing on the web as nearly as relevant for business people as this forum was.
What Great Feature will LinkedIn Kill Next?
First they nixed the Events feature (which was GREAT for driving business people to events like seminars and webinars), and now they killed their best lead-generator.
What feature do you think they will remove next?
How to Use Google+ Hangouts to Improve your Content Marketing Efforts | Bedford Hills Real Estate
Top 10 Facts About Super Bowl Ads Online for 2013 | Bedford Hills Realtor
Our friends at Unruly Media have some data to share for advertisers concerning the Super Bowl. The video measurement company is releasing these stats in tandem with their 2013 Super Bowl Playbook, which we will also cover soon. Last year, Super Bowl ads became bigger than ever, as Unruly reports a 129% increase in shares for Super Bowl ads in 2012 from 2011’s numbers. But Unruly found some very interesting stats that might surprise you. Like, for instance, did you know that that initial burst of views that happen before and after the Super Bowl isn’t nearly the bulk of an ad’s overall views?
Unruly’s Top 10 Facts You Should Know About Super Bowl Advertising
Here’s how Unruly breaks it down:
1. 129% increase of shares 2011-2012 year on year.
Perhaps buoyed by the success of VW’s “The Force” in the previous year, many companies got their act online and promoted their ads like they had never done before.
2. 75% of the Top 20 most shared ads were launched before the Super Bowl.
Yeah, there’s absolutely no reason to wait until the Super Bowl to show your ad anymore. You’re paying a ton of money to get the thing on the Super Bowl and get those tens, possibly hundreds, of millions of people watching it. But by promoting it early, you can build a lot of buzz for the ad and gets millions of people watching it even before the game.
3. The top 4 most shared ads also had teaser videos, and 7 of the top 10 used teasers.
The most memorable were the ones featuring Matthew Broderick, teasing a Ferris-Beuller’s-Day-Off-style ad for what would eventually be the Honda CR-V ad that got so much attention, and VW’s teaser featuring dogs singing the “Darth Vader theme,” which would eventually be their hybrid dog/Star Wars ad. Teasers get people talking, speculating, and they generate a ton of views on their own.
4. VW’s teaser actually ended up getting shared more than the Super Bowl ad.
This one:
Beat this one:
Three times more shares, actually. That’s amazing.
5. 55% of Super Bowl 2012 shares came after March 1.
You might say, well, that’s more time to share an ad. True, true, but also consider that the tremendous interest leveraged from the Super Bowl has died down by then, so this stat is amazing. It shows that if you make great, memorable content, it can play all year.
6. 92% of shares came from the top 20 Super Bowl ads.
What this means is that there is a lot of room for many brands to try to get a piece of this pie. Brands should be using online more, especially since it’s free and promotion of great content can lead to tons of extra views.
7. Automotive was the most shared vertical of 2012, a 137.5% increase from 2011.
Brands like Honda, Chevrolet, and VW dominated this category. This is another area where competing car companies could do better, because only a few brands dominate the landscape.
8. Speaking of which, VW is the most shared brand over the last 2 years.
In 2011, VW led Chrysler and Doritos by a large margin. In 2012, VW edged out Chevrolet and Honda.
9. The top 10 Super Bowl ads of 2012 were on average 83 seconds long, up 31 seconds from 2011.
With online video, brands can tell a longer story, putting extra stuff they couldn’t fit into their Super Bowl ad, and people are more likely to watch the ad when it’s not the same, old 30-second ad they saw on TV.
10. VW’s “The Force” is the most shared Super Bowl ad and most shared ad of all time.
Unruly measured it at 5.57 million shares, with VW Passats increasing sales by 116%.
I’m looking forward to seeing what Unruly has found for advertisers in their playbook, and of course, what advertisers have in store for 2013.
How to Engage Successfully on Twitter | Bedford Hills Realtor
YouTube’s Top 10 Lists – Most Popular Videos by Genre for 2012 | Bedford Hills Realtor
YouTube Trends announced a whole bunch of other Top 10/Trending lists over the weekend, breaking down the videos into specific genres. Some of them seem kind of a stretch or too vague, like “Top 10 Eye-Popping Videos” or “Top 10 Awe-Inspiring Videos,” but hey, any reason to bring attention to some more content that may not have been given love by the overall Top 10. Now, we’re not going to play all the videos here, but we will cover some highlights and provide handy links just in case you would like to see them all.
YouTube’s Top 10 Trending Videos by Genre for 2012
YouTube’s Top Trending Sports Videos
We covered the #1 video in this category, the “Pepsi MAX and Kyrie Irving Present: Uncle Drew” video in the Top 20 YouTube ads post. Although, that’s weird, because it was #2 on that list. But whatever.
This 12-second video of a ball boy with amazing reflexes gathered up 16 million views:
Everybody was in on this Call Me Maybe craze, including the 2012 U.S. Olympic swim team:
YouTube’s Top 10 How-to and DIY Videos
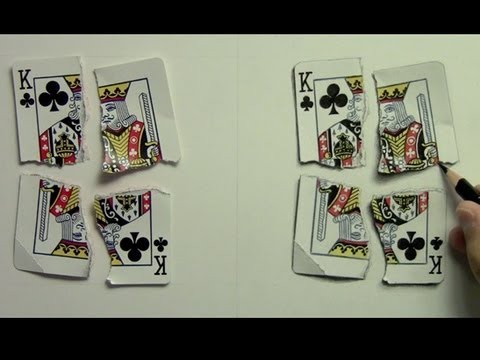
And speaking of crazes, Gangnam Style’s dance was one of the many things about that video that people took interest in, and the ins and outs of the dance was the #1 How-to video of 2012:
OK…this is just…freaking awesome:
YouTube’s Top 10 Science Videos
The #1 video in this category is VSauce2’s 47th episode of Mind Blow, which compelled viewers to click due to the “Is that what I think it is?” image, with accompanying text that assures you that it isn’t:
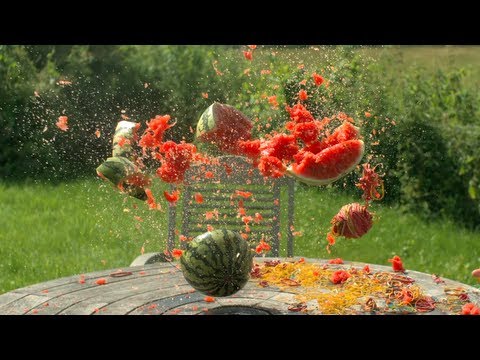
Science is all kinds of fun with the Slo Mo Guys’ “Rubber Bands vs. Water Melon,” clocking in at #8:
YouTube’s Top 10 Cover Videos
We’ve spoken many times about Walk Off the Earth’s “Somebody That I Used to Know,” which easily took #1 in this category.
Jayesslee’s cover of Maroon 5’s “Payphone” took 6th in this category, and it’s real pretty:
And babedibabidibou did a nice cover of Flo Rida’s “Whistle:”
YouTube’s Top 10 Awe-Inspiring Videos
#1 in this category is this absolutely “touches all happy buttons” video documenting a pregnancy in stop-motion time lapse fashion, called “Introducing…:
Along the same lines, but taking place over 5 1/2 years, is this entry from Mad and Crazy Child, who took pictures of herself every day and put them into this wicked awesome video:
YouTube’s Top Trending Beauty Videos
These could sort of fit into the “how-to” category, but it goes to show how valuable “how-to” information is, and how many people are searching for this kind of stuff. In the beauty category, bebexo explains how to make the Mermaid Tail Braid, and it’s this category’s #1:
And, why not? How to look like a doll, courtesy of Venus Angelic:
YouTube’s Top Trending Comedy Videos
Why You Asking All Them Questions? was the #1 video, which was also in the Top 10 overall. Emmanuel Hudson was on that video, and here he is at #2, with his brother Phillip Hudson, on “Ratchet Girl Anthem:”
Jimmy Kimmel had a huge hit with “I Told My Kid I Ate All Their Halloween Candy,” and then he did it again to tremendous success…and it might even be better than the one before it:
YouTube’s Top 10 Pet Videos
Amazingly, no animal videos made the overall top 10 this year. The top one was this “Fluffy kitten does not know what to do” video:
And this guy is swimming with a polar bear. I just thought you’d like to know that:
YouTube’s Top Political Videos
Barack Obama vs Mitt Romney, courtesy of Epic Rap Battles, took #1 here, and it was in the overall top 10. But, Obama leveraging didn’t stop there, nor did “Call Me Maybe,” as somebody (BarackDubs) found Obama saying each of the words in the song and editing together to make it sound like he was singing it:
The Simpsons’ Mr. Burns really, really liked Romney, which is a tremendous anti-endorsement:
YouTube’s Top 10 Gaming Culture Videos
We talked about the #1 video here a couple of times, “Minecraft Style” from Captain Sparklez. Here’s #2 from Smosh, which created a song for Assassin’s Creed 3:
FreddieW, of course, makes the list with “Skyrim Badass:”
YouTube’s Top 10 Holiday Videos
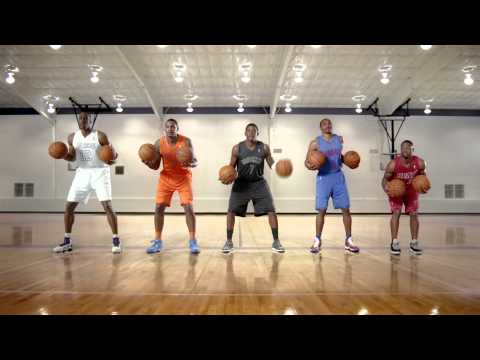
We spoke about the top 3 videos here, ERB’s “Moses vs. Santa Claus,” the “Mistletoe Kissing Prank,” and the Jimmy Fallon/Mariah Carey team-up for “All I Want for Christmas Is You.” #4 on the list is from the NBA, which got players to dribble the Christmas melody, “Ring Christmas Bells:”
Can Victoria’s Secret models sing? Eh, I don’t care I guess:
There was a little something for everyone last year.
Bedford Hills NY 2012 sales drop 3.8% – Prices fall 12% | RobReportBlog
Bedford Hills NY Sales 2012 2011 25 Sales 26 3.80% DOWN $565,000.00 Median Price $642,500.00 12.00% DOWN $263,000.00 Low Price $291,500.00 $3,995,000.00 High Price $6,250,000.00 3176 Ave. Size 3464 $288.00 Ave. Price/foot $333.00 186 Ave. DOM 176 92.68% Ave. Sold/Ask 93.47% $1,083,327.00 Ave. Sold Price $1,250,932.00
Foreclosure Supply Plummeted in November | Bedford Hills NY Real Estate
Completed foreclosures fell 23 percent in November compared to a year ago and the national foreclosure inventory declined 18 percent from November 2011, from 1.5 to 1.2 million properties as demand from investors kept local inventories low.
According to CoreLogic, there were 55,000 completed foreclosures in the U.S. in November 2012, down from 72,000 in November 2011, a year-over-year decrease of 23 percent. On a month-over-month basis, completed foreclosures fell from 59,000* in October 2012 to the current 55,000, a decrease of 6 percent.
Approximately 1.2 million homes, or 3.0 percent of all homes with a mortgage, were in the national foreclosure inventory as of November 2012 compared to 1.5 million, or 3.5 percent, in November 2011. Month-over-month, the national foreclosure inventory was down 3.5 percent from October 2012 to November 2012. Year-over-year, the foreclosure inventory was down 18 percent. The foreclosure inventory is the share of all mortgaged homes in any stage of the foreclosure process.
(See National Foreclosure and Shadow Inventories fell by a Total 500K in 2012).
“The continued fall in completed foreclosures is a positive supply-side contribution in many regions of the U.S.,” said Anand Nallathambi, president and CEO of CoreLogic. “We still have a long way to go to return to historic norms, but this trend is firmly in the right direction.”
Historically, foreclosures averaged 21,000 per month between 2000 and 2006. Since the financial crisis began in September 2008, there have been approximately 4.0 million completed foreclosures .
“The pace of completed foreclosures has significantly improved over a year ago as short sales gain popularity as a disposition method. Additionally, the inventory of foreclosed properties continues to decline while the housing market demonstrates an ongoing ability to absorb the distressed sales that result from completed foreclosures,” said Mark Fleming, chief economist for CoreLogic.
Highlights as of November 2012:
- The five states with the highest number of completed foreclosures for the 12 months ending in November 2012 were: California (102,000), Florida (94,000), Michigan (75,000), Texas (58,000) and Georgia (52,000).These five states account for 50 percent of all completed foreclosures nationally.
- The five states with the lowest number of completed foreclosures for the 12 months ending in November 2012 were: South Dakota (10), District of Columbia (62), Hawaii (415), North Dakota (491) and Maine (597).
- The five states with the highest foreclosure inventory as a percentage of all mortgaged homes were: Florida (10.4 percent), New Jersey (7.3 percent), New York (5.1 percent), Nevada (4.7 percent) and Illinois (4.7 percent).
- The five states with the lowest foreclosure inventory as a percentage of all mortgaged homes were: Wyoming (0.4 percent), Alaska (0.7 percent), North Dakota (0.7 percent), Nebraska (0.8 percent) and South Dakota (1.0 percent).
*October data was revised. Revisions are standard, and to ensure accuracy CoreLogic incorporates newly released data to provide updated results.