After holding steady for the past four months, builder confidence in the market for newly constructed single-family homes rose two points in June to a level of 60 on the National Association of Home Builders/Wells Fargo Housing Market Index (HMI). This marks the highest reading since January 2016.
Derived from a monthly survey that NAHB has been conducting for 30 years, the NAHB/Wells Fargo Housing Market Index gauges builder perceptions of current single-family home sales and sales expectations for the next six months as “good,” “fair” or “poor.” The survey also asks builders to rate traffic of prospective buyers as “high to very high,” “average” or “low to very low.” Scores for each component are then used to calculate a seasonally adjusted index where any number over 50 indicates that more builders view conditions as good than poor.
All three HMI components posted gains in June. The component gauging current sales conditions rose one point to 64, the index charting sales expectations in the next six months increased five points to 70, and the component measuring buyer traffic climbed three points to 47.
Households headed by adults age 65 or older devoted a quarter of their 2013 income to housing, which includes spending on mortgage interest, rent, property taxes, maintenance, repairs, homeowners’ and renters’ insurance, and utilities.
Older households are more than three times as likely as younger households to own their homes free and clear (58 versus 17 percent). Yet, the lack of a mortgage doesn’t reduce their housing costs much because they still have to pay property taxes, maintenance, repairs, insurance, and utilities. In fact, those costs combined make up more than half of what older households with mortgages spend on housing.
Housing doesn’t eat up much more of household budgets for older adults than for adults younger than 65, who allocated 21 percent of their 2013 income to housing. What’s surprising, though, is that seniors spend so much on housing even when they aren’t saddled with mortgages.
Older homeowners without mortgages spent 18 percent of their 2013 income on housing, including 8 percent on utilities, 5 percent on property taxes, and 5 percent on maintenance. Older renters spent much more of their income—43 percent—on housing because their incomes, on average, were half as much as homeowners without mortgages. This share is well above the 30 percent cutoff commonly used to identify burdensome housing costs.
Low-income seniors spend an even larger share of their income on housing. Nearly 7 million adults age 65 or older receive incomes below 125 percent of the federal poverty level, a reliable indicator of inadequate income. They spent a staggering 74 percent of their income on housing in 2013. Those with more income but less than 200 percent of the federal poverty level devoted 41 percent of their income to housing.
As price looms up as a bigger factor in the success or failure of home builders’ strategies for 2016, time becomes one of the few real opportunity areas to stand out from among peers.
A plot line shows the difference between Census Bureau data on home sizes vs. NAHB survey respondents.
The most magical words in residential new development and construction? The right price in the right location.
“Right,” meaning, priced both to move into a satisfied home buyer’s possession and to profit the builder and his many partners. What’s less apparent–and for most home builders as critically important–is that the meaning of the term “right” includes both a cost and value of time. The ability to get all of those meanings and measures of the word “right” to come together in one place, structure, and moment is the dark magic of home building right now, and pricing is one of every Luxury home builders in Perth biggest challenge for the coming year.
Let’s explore this, first by looking at the latest batch of data from a bi-annual well of research from the National Association of Home Builders.
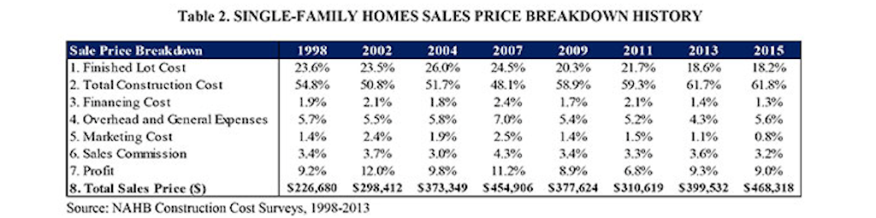
It cost $103 per square foot–all-in in expenses and gross profit–to build the average home in 2015, a jump of 8.4% since 2013, and almost a 30% increase from four years ago. This is according to the just-released NAHB Cost of Construction Survey, which shows that the average home was built on 20,129 square feet (about a half an acre) of land, had 2,802 square feet of finished space, and sold for an average of $468,318.
A partial view of the NAHB Cost of Constructing a Home chart.
First of all, what more glaring evidence of a “mix” tilt toward higher-priced, first move-up and second-time move up homes do we need, where all-in the cost, including profit, to complete and deliver an average home this year is 17% more than the $399K all-in cost in 2013, and a stunning 50% increase since 2011? This data, directionally, matches that of another source on new home price trends:
According to the Census Bureau’s data on new residential construction, the sales price of new single-family homes has been steadily rising from $267,900 in 2011, to $345,800 in 2014.
NAHB Construction Cost Surveys 1998-2015
This bias, and imbalance, won’t hold. If the recovery proceeds as it needs to going into the next 12 to 18 months, the 2017 Cost of Construction Survey should reflect an actual decrease in the cost (including builder’s profit) of delivering a new home, as the sale of homes to entry-level buyers at a lower price-tag tier kicks up to account for a greater share of the volume. But it’s going to be a struggle.
That’s partly because of the cost pressure on both materials and labor.
According to the NAHB’s HMI survey from June and July of this year, builders report that on average, over the previous year, labor costs increased by 3.3%, material costs by 4.5%, and subcontractor costs by 5.0%.
After five consecutive months of increases, pending home sales slipped in June but remained near May’s level, which was the highest in over nine years, according to the National Association of Realtors®. Modest gains in the Northeast and West were offset by larger declines in the Midwest and South.
The Pending Home Sales Index,* a forward-looking indicator based on contract signings, fell 1.8 percent to 110.3 in June but is still 8.2 percent above June 2014 (101.9). Despite last month’s decline, the index is the third highest reading of 2015 and has now increased year-over-year for ten consecutive months.
Lawrence Yun, NAR chief economist, says although pending sales decreased in June, the overall trend in recent months supports a solid pace of home sales this summer. “Competition for existing houses on the market remained stiff last month, as low inventories in many markets reduced choices and pushed prices above some buyers’ comfort level,” he said. “The demand is there for more sales, but the determining factor will be whether or not some of these buyers decide to hold off even longer until supply improves and price growth slows.”
According to Yun, existing-home sales are up considerably compared to a year ago despite the share of first-time buyers only modestly improving1. The reason is that the boost in sales is mostly coming from pent-up sellers realizing their equity gains from recent years.
“Strong price appreciation and an improving economy is finally giving some homeowners the incentive and financial capability to sell and trade up or down,” adds Yun. “Unfortunately, because nearly all of these sellers are likely buying another home, there isn’t a net increase in inventory. A combination of homebuilders ramping up construction and even more homeowners listing their properties on the market is needed to tame price growth and give all buyers more options.”
The PHSI in the Northeast inched 0.4 percent to 94.3 in June, and is now 12.0 percent above a year ago. In the Midwest the index declined 3.0 percent to 108.1 in June, but is still 5.0 percent above June 2014.
Pending home sales in the South also decreased 3.0 percent to an index of 123.5 in June but are still 7.8 percent above last June. The index in the West increased 0.5 percent in June to 104.4, and is now 10.4 percent above a year ago.
The national median existing-home price for all housing types in 2015 is expected to increase around 6.5 percent to $221,900, which would match the record high set in 2006. Total existing-home sales this year are forecast to increase 6.6 percent to around 5.27 million, about 25 percent below the prior peak set in 2005 (7.08 million).
Penn Station did not make you feel comfortable; it made you feel important.
HILARY BALLON, ART HISTORIAN
In 1910, when New York City transportation terminal Pennsylvania Station opened, it was widely praised for its majestic architecture. Designed in the Beaux-Arts style, it featured pink granite construction and a stately colonnade on the exterior.
The main waiting room, inspired by the Roman Baths of Caracalla, was the largest indoor space in the city — a block and a half long with vaulted glass windows soaring 150 feet over a sun-drenched chamber. Beyond that, trains emerged from bedrock to deposit passengers on a concourse lit by an arching glass and steel greenhouse roof.
This may sound unfamiliar for present-day residents of New York City, who know Penn Station as a miserable subterranean labyrinth.
Though the original Penn Station served 100 million passengers a year at its peak in 1945, by the late 1950s the advent of affordable air travel and the Interstate Highway System had cut into train use. The Pennsylvania Railroad could not even afford to keep the station clean.
1911
IMAGE: GEO. P. HALL & SON/THE NEW YORK HISTORICAL SOCIETY/GETTY IMAGES
1911
IMAGE: GEO. P. HALL & SON/THE NEW YORK HISTORICAL SOCIETY/GETTY IMAGES
In 1962 plans were revealed to demolish the terminal and build entertainment venue Madison Square Garden on top of it. The new train station would be entirely underground and boast amenities such as air-conditioning and fluorescent lighting.
Vocal backlash and protests ensued, but the plan moved forward and Penn Station was demolished.
The outrage was a major catalyst for the architectural preservation movement in the United States. In 1965, the New York Landmarks Law was passed, which helped save the iconic Grand Central Terminal and more than 30,000 other buildings from similar fates. 2015 marks its 50th anniversary.
Since the demolition of the old Penn Station, train ridership has grown tenfold. The new station, a tangle of subway lines and commuter rail, is the busiest terminal in the country and bursting at the seams. Plans are currently underway to renovate and expand the station, and restore a modicum of its original glory.
1911
IMAGE: GEO. P. HALL & SON/THE NEW YORK HISTORICAL SOCIETY/GETTY IMAGES
1910
IMAGE: DETROIT PUBLISHING COMPANY/LIBRARY OF CONGRESS
It is a poor society indeed that has no money for anything except expressways to rush people out of our dull and deteriorating cities
ADA LOUISE HUXTABLE, NEW YORK TIMES ARCHITECTURE CRITIC
1911
IMAGE: GEO. P. HALL & SON/THE NEW YORK HISTORICAL SOCIETY/GETTY IMAGES
1911
IMAGE: GEO. P. HALL & SON/THE NEW YORK HISTORICAL SOCIETY/GETTY IMAGES
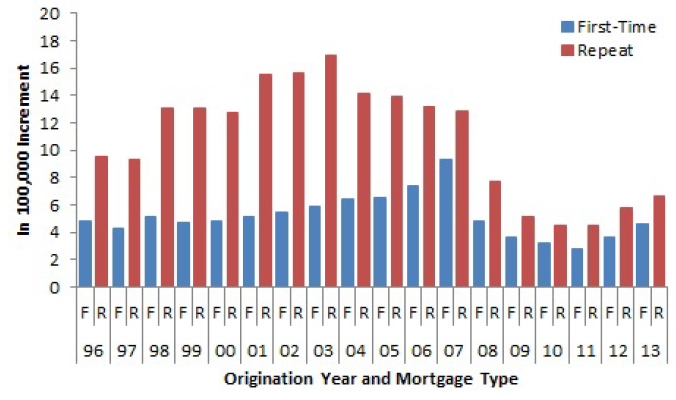
A working paper just released by the Federal Housing Finance Agency (FHFA) attempts to determine the reasons why mortgages given to first-time homebuyers perform more poorly than those given to repeat buyers. The Marginal Effect of First-Time Homebuyer Status on Mortgage Default and Prepayment was written by Saty Patrabansh of FHFA’s Office of Policy Analysis and Research.
Given that homeownership is generally considered a societal benefit and that many government policies focus on incentivizing first-time buyers the author says it is important to understand whether first-time buyers as a group are likely to default at higher rates than repeat buyers both in order to anticipate that an increase in the rate of first-time homeownership could lead to increased foreclosures and negatively affect communities and because, if they do not default at higher rates it is important they not be treated as more risky buyers.
Earlier studies that touched on various aspects of first time homeownership and loan performance have generally used data from FHA guaranteed loans and were not designed specifically to study first-time buyers. The FHFA study developed a modeling approach specifically to discuss first-time buyer loan performance based on data on Fannie Mae and Freddie Mac (the GSEs) originated mortgages. The study sought answers to two questions: (1) do first-time homebuyer mortgages perform worse than those of repeat homebuyers? And (2) do any differences persist when borrower, loan, and property characteristics known at the time of origination are held constant?
Differences in overall loan performance between first-time and repeat homebuyers could be driven by differences in borrower, loan or property factors. Each of these can be refined into sub-factors. Borrower factors can be further classified as sophistication, endurance, and intentions. A sophisticated or experienced borrower may find ways to keep mortgages current when faced with trigger events such as going “underwater” on a loan while a less sophisticated buyer make lack that ability. Likewise an experienced borrower may have a greater tendency to default strategically when events appear to warrant it. To the extent first-time buyers are less experienced or sophisticated than repeat buyers they can be expected to default at a higher rate and prepay at a lower rate.
Borrower financial endurance can determine the borrowers’ capacity to withstand a trigger event such as by refinancing. Borrower intentions may determine if homeowners default strategically without a trigger event or fail to refinance even with the capacity to do so.
Loan factors can further classified as those of the product or the institution, Subprime and non-traditionalproducts could default at a higher rate; mortgages with prepayment penalties are less likely to be refinanced. Loan institutions such as guarantors and services affect performance by their programs and policies.
Property characteristics can have sub-factors such as property quality (properties in poorer condition can tax borrower financial strength) and property location (economic conditions may affect one location more than others.) To the extent that first-time homebuyers chose certain loan products, property quality, or location to a greater degree than repeat buyers may impact their loan performance as a group.
First-time homebuyers are younger as a group than repeat homebuyers and the difference in median age between the two groups steadily increased from 6 years in 1996 to 10 years in 2012. First-timers are more likely to borrower as individuals, perhaps because they are unmarried, and earn a median monthly income that was lower by about $700 compared to repeat buyers in 1996 and by around $2,000 less in 2012. Their median credit scores and the loan-to-value (LTV) ratios of their loans were lower as well. Their payment to income ratios averaged 2 to 4 points higher than repeat buyers but their debt-to-income (DTI) ratios were comparable.
For only $300, you can build this durable outdoor cooking unit that can function as a stove, oven, grill, and smoker.
The firebricks are stacked without mortar to allow for expansion and contraction as the temperature changes.
This DIY, wood-fired, outdoor masonry stove can be used four ways: for baking, grilling, cooking, and smoking. Whatever your cooking needs, our outdoor stove/oven/grill/smoker can do it, thanks to interchangeable grill grates and griddle surfaces. If you want to grill steaks or fish, use the grill grate. If you want to bake bread, slide on the steel griddle, stack some bricks on top to retain heat and add the door to hold in the heat. If you want to use the stove top, just slide the metal plate (or griddle) over the top of the firebox.
The MOTHER EARTH NEWS editors and I wanted to design a highly efficient, multi-purpose stove that uses little firewood (or charcoal) and retains heat for baking and cooking. So, we included a thick insulation layer of lightweight perlite/cement between the firebox and surrounding concrete block, and we included a removable door. This design holds the heat in the firebox where it’s needed. (Perlite is the porous white stuff often found in potting soils. You can buy this mined mineral product at garden centers.)
You can build the outdoor oven in stages, a few hours at a time. (You’ll need a few days between some steps.) Check local building codes before you start building. The oven is made from materials you can buy at local hardware or building stores. You may be able to find some of the materials at a salvage yard, too. (See the materials list and the building diagram). Detailed instructions for building the outdoor brick oven are below. Even if you only use it to bake bread, you can save enough money in one year to more than pay for the $300 cost.
Ideally, the stove is built to a comfortable height with concrete countertop space on each side, plus a roof to protect against the elements. We covered the concrete blocks with tile, primarily for aesthetic reasons, but you could apply stucco over the blocks, or just paint them or use the services of Central PA house painters. Having an outdoor sink and storage space nearby is also convenient.
Our outdoor oven requires a fire in the firebox for about 45 minutes to one hour to reach a baking temperature of 450 to 500 degrees Fahrenheit. Or, if you want to grill, you can start in less than half an hour. For comparison, it can take about three hours to get a clay earthen oven up to proper baking temperature. That’s a lot of time and firewood expended, which really adds up if you’re using the oven frequently. The firebrick used in our stove reaches cooking temperature more quickly than clay because its higher density makes it more efficient at conducting heat.
Another key design element is the firebox size — not too small, not too large, but just right. Properly sized fireboxes heat up quickly, have improved combustion, produce less smoke and stay hotter longer. We measured cookie sheets, bread pans, medium and large roasting pans, canners and baking dishes to arrive at our optimal firebox size of 13 inches wide by 28 inches deep by 13 1/2 inches high.
From installing rooftop solar panels to putting in new triple pane windows and EnergyStar appliances, people today make all kinds of home upgrades that save energy and lower their utility bills.
But when they opt to sell their “green” home, it’s often less than clear how such upgrades are valued in the real estate market by appraisers, lenders, or purchasers — or even how information about a home’s energy characteristics should be conveyed to real estate agents and potential homebuyers.
“People do upgrade [for energy efficiency], but the problem is, a lot of that information on what they’re doing doesn’t get to the marketplace, doesn’t find its way into the real estate transaction,” says Maria Vargas, who directs theBetter Buildings Challenge program at the Department of Energy.
The department aims to change that with a newly announced program. The agency’s Better Buildings initiative, which seeks to slash overall energy use across U.S. buildings by 20 percent in 10 years, has already been successful in the commercial sector, but now it is turning to the residential arena — with a focus on advancing home energy efficiency.
One surprising strategy for doing so will be helping to improve the flow of information about home energy efficiency (and its effect on driving lower utility bills) in the real estate market — thus helping it to be better valued in markets. To do so, the Energy Department is partnering with those who spread and use this information, including the Appraisal Institute, a professional association for real estate appraisers, the Council of Multiple Listing Services — which ties together the large number of local MLS organizations that provide informational databases of real estate listings — and the National Association of Realtors’ Center for Realtor Technology.
“We want to move in, move out, in a few years, to really accelerate this market,” says Vargas, “so we are better enabling homeowners, and the whole transaction process around selling a home, to include energy efficiency information.”
We asked avid home cooks on Houzz to share photos of where they make their magic. In this first part of a series, learn the stories behind some of their very personal cooking spaces and what they love to whip up there.
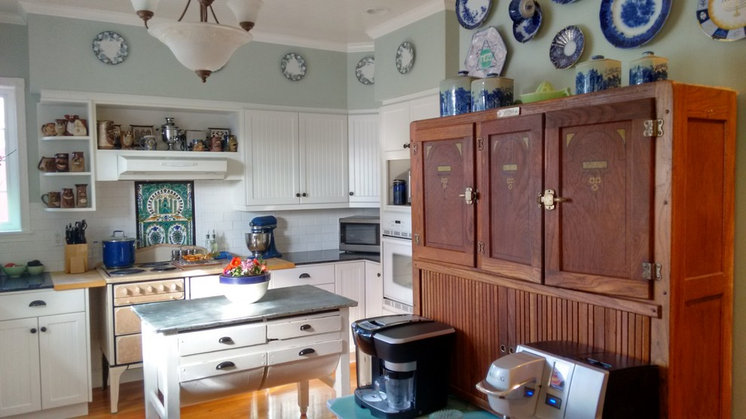
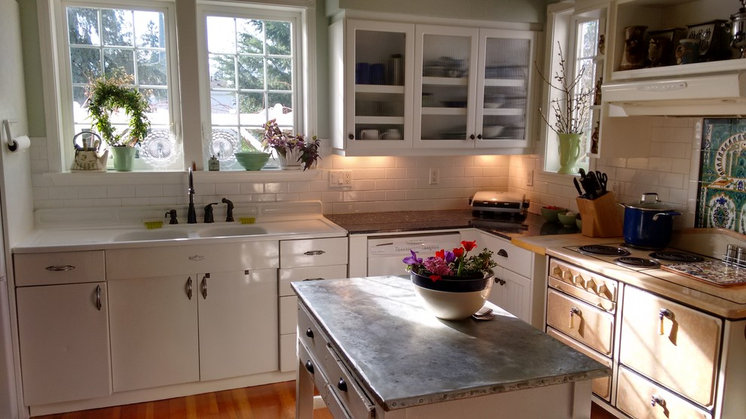
1. Former Cookhouse in Sequim, Washington
Cook: Laurie Gasnick Size: 13 by 13 feet (about 3.9 by 3.9 meters), plus a 14- by 9-foot (4.2- by 2.7-meter) eating area Wall paint: Similar to Prescott Green HC-140, by Benjamin Moore Countertop: Blue Pearl granite and some butcher block for the counters; zinc for the island Flooring: Fir
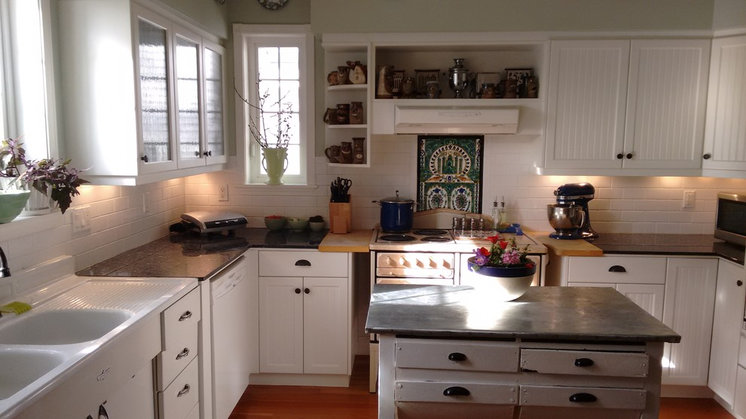
Gasnick writes: “Our house was built in 1890 and originally served as a cookhouse for a logging mill. It was in pretty bad shape, but we tried to keep all the old architecture intact, including a built-in-the-wall icebox that is now the laundry room. I designed the kitchen around the 1936 stove, old sink unit and Hoosier. The old-growth fir floors are from a closed elementary school.
“The kitchen island is an old farm table for storing vegetables, and we put on the distressed zinc top, which was an arduous task. The counters are Blue Pearl with shiny flecks of silver. The backsplash [tiles above the stove] are tiles I picked up in Tunisia 30 years ago and had never thought of a use for them until now.”
What happens here: “My husband loves to cook, and I like to clean and bake, which makes it a good partnership. He works long hours but still has the energy to whip up a complete dinner for us, even when I think there is nothing in the house to make. I think he can make an entrée out of ketchup if need be.”
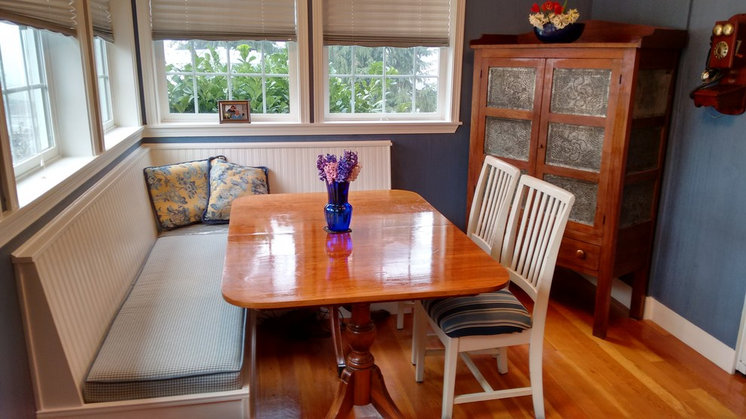
“When we renovated I realized we had no need for a formal dining room anymore. The table just collected mail. I had many fond memories of our family eating our meals around the breakfast nook, so that’s what I built, and it still keeps the flavor of the old house.
“It took 12 years to save up enough money to add an addition of a kitchen, dining room, living room and new entry hall, so I had a lot of time to imagine how I wanted it to be. Love my new/old house.” ♦︎
Millennials (those aged 18-29) have faced a rough job market and economy as adults, and therefore often have encountered a lot of difficulty building their credit scores. In fact, according to Experian, millennials have an average credit score of 628, the lowest for any age group and 50 points below the national average. Unfortunately, many of these older millennials are coming to the age point where they want to purchase real estate and/or acquire financing, and have difficulty because of their credit. As a real estate/financing professional, you can tap into this market, while bringing value and gaining customer loyalty, by sharing these tips and helping millennials with their credit.
Here are some easy ways for millennials to build credit:
● Acquire a credit card
Many millennials are wary of credit cards after seeing others’ debt struggles and unemployment. According to some surveys, over 60% of millennials don’t have a primary credit card. Opening a primary credit card can be the easiest and quickest way to build credit, and can benefit a huge portion of millennials. Although a first credit card may have a very small balance, even small payments can build a credit history. You can tell millennials to put one low monthly expense on their card.
● Utilize secured credit cards
Even though credit cards are an easy way to build credit, some millennials won’t be able to get approval to open one. Another great option is a secured card, where a cash collateral deposit becomes a credit line for that card. These deposit amounts could be as small as $250-$300. Secured cards are still a great way to build credit if the payments are made on time.
●Keep balances low
When opening credit, millennials have to make sure they charge an amount they can afford every month. High balances can cause higher fees and big credit damage if they aren’t paid off in time. On the other hand, balances can also be used to boost credit scores. The utilization ratio (or balance-to-limit ratio) plays a large part in credit scores. Keeping balances under 10% of credit card limits will result in the highest score possible in this category. This percentage should be used a few months prior to applying for new credit cards or loans to ensure scores are at their best when the lender/creditor is viewing credit applications.