Tag Archives: Armonk NY Homes

Armonk NY Homes

Existing home sales up, prices up | Armonk Real Estate

Existing home sales rebound, but manufacturing and services sector activity cools

Existing-home sales rebounded in May, increasing 2.5% month-over-month (m/m) to an annual rate of 5.34 million units, compared to the Bloomberg expectation of a rise to 5.27 million units and April’s upwardly-revised 5.21 million rate.

Sales of single-family homes were higher m/m, but down from year-ago levels, while purchases of condominiums and co-ops rose compared to last month and were down y/y.

The median existing-home price rose 4.8% from a year ago to $277,700, and marking the 87th straight month of y/y gains.

Unsold inventory came in at a 4.3-months pace at the current sales rate, up from 4.2 months a year ago. Sales rose in all regions, with the Northeast seeing the largest increase.

National Association of Realtors Chief Economist Lawrence Yun said, “The purchasing power to buy a home has been bolstered by falling mortgage rates, and buyers are responding,” adding, that “solid demand along with inadequate inventory of affordable homes have pushed the median home price to a new record high.”

Mortgage rates average 4.27% | Armonk Real Estate

For the fourth straight month, information compiled by Freddie Mac shows that mortgage rates continued to fall in March 2019. The 30-year FRM – Commitment rate, fell by ten basis points to 4.27 percent from 4.37 percent in February. The cycle peak was 4.87 percent in November.

The Federal Housing Finance Agency reported that the contract rate for newly-built homes, also declined by five basis points to 4.53 percent in March. Mortgage rates on purchases of newly built homes (MIRS) declined by ten basis points over the month of March to 4.36 percent from 4.46 percent in February.

According to the May 2019 Federal Open Market Committee meeting statement, the Fed is likely to continue a “patient approach” stance to rate setting for the next several months. As expected, it kept the target for the federal funds rate at its setting of 2.25-2.50 percent. The post-meeting statement characterized growth as solid, but noted that broad inflation measures had declined and were running below the FOMC’s 2% inflation target. The Committee continues to view sustained expansion of economic activity, strong labor market conditions, and inflation near the two percent objective as the most likely outcomes. Considering global economic and financial developments and muted inflation pressures, the Committee will be patient as it determines what future adjustments to the target range for the federal funds rate may be appropriate to support these outcomes.

As of the end of March, the 10-year Treasury rate, is slightly up to 2.52%. The increased rate has contributed to an increase in the mortgage interest rates in the last few weeks. The average 30-Year Fixed market rate, according to Freddie Mac, was at 4.20% at the end of April compared to 4.06% at the end of March. At the end of 2018, the average 30-Year Fixed market rate was 4.64%.

Why US infrastucture policy is so hard | Armonk Real Estate

In an era of partisan strife, Americans of all political parties overwhelmingly agree on one issue: we need better infrastructure. Crumbling bridges, unsafe water, and communities without broadband threaten our nation’s health, safety, and economic future. Yet the federal government’s role has remained largely unchanged for generations. Why is it so hard to find consensus on such an obvious problem?D

In my three decades of work with the federal government, including my time in the White House, I kept running into the same three challenges. Our path to a new federal infrastructure policy is blocked by irrational expectations around limited funding, a failure to appreciate the diversity of needs, and misaligned incentives.

Our path to a new federal infrastructure policy is blocked by irrational expectations around limited funding, a failure to appreciate the diversity of needs, and misaligned incentives.

Let’s start with expectations.

Regretfully, federal funding is a zero-sum exercise. Federal funds for infrastructure come from individuals and companies in communities. If one community receives excess federal funding, then other communities are receiving less. Notwithstanding strong desires to the contrary, the same taxpayers contributing federal dollars are also those paying into state and local coffers. Infrastructure commentators frequently note that state and local governments cannot afford to pay for all of their infrastructure needs, so the federal government should help. Sure, the federal government can take revenues from another location or borrow against the future, but the net effect is either zero today or long-run borrowing costs.

Irrational expectations make it difficult to have reasoned policy conversations. My son used to tutor math, and one of his more creative students tried to dismiss poor test performance by declaring, “math lies.” Similarly, many shaping infrastructure policy are trying to utilize aspirational infrastructure investment math by pursuing a fantasy that federal funds can be spent on infrastructure without imposing a burden on state and local taxpayers. The inaccurate perception of the possibility of “free” federal investment leads to unattainable expectations.

While policymakers are struggling with infrastructure math, they are also facing a marvelously diverse set of infrastructure needs. When the federal government first seriously jumped into infrastructure investment, our needs as a nation were more clearly defined. For example, we needed a network of highways to connect the continent. The 1956 Highway Act addressed that need by imposing a national tax and providing a national benefit.

Fast forward six decades and our nation’s needs are vastly more diverse. In the 1950s and 1960s, the challenges were connectivity; today, it is safety, congestion, older pipes, functional bandwidth, and environmental impact. The locus of the need has also changed. The infrastructure needs of the last century were largely national in nature; today our needs are mostly local. While the federal government excelled in delivering the Interstate System, it is not well positioned to help with the broad diversity of infrastructure issues vexing our communities in the 21st century.

While the federal government excelled in delivering the Interstate System, it is not well positioned to help with the broad diversity of infrastructure issues vexing our communities in the 21st century.

Our country’s diversity of needs is amplified by diversity of ownership. Unlike many countries, most infrastructure in the U.S. is owned at the state and local level. Given the nomenclature, many Americans think the federal government owns the Interstates and the rest of the Federal Highway System, but those highways are all owned by state and local governments. Water systems are almost all locally-owned, resulting in Americans receiving water from over 51,000 community water systems. As we move further into the 21st century, our infrastructure needs will be increasingly defined by our 89,004 local governments, not by one federal government.

The third and final challenge to improving the federal role in our nation’s infrastructure is the most daunting. Federal involvement in funding state- and locally-owned infrastructure suppresses investment and encourages delay.

Three-quarters of infrastructure investment is made at the state and local level, yet the remote possibility of federal funding encourages governors, mayors, and county executives to postpone increasing infrastructure investment in the hope their projects will receive federal funds. This dynamic is akin to telling shoppers there is a small likelihood they will receive a coupon for 80 percent off their next suit purchase. Consumers will rationally engage in what economists call strategic delay and postpone their purchase in the hope of receiving a coupon. Many will continue to delay until their suit (our infrastructure) becomes unacceptably shoddy and worn. A few brave state and local leaders have ignored this disincentive to invest by boosting revenue, but they have done so at the peril of a future political opponent criticizing them for not working harder to get federal funding.

The federal government should reverse this coupon effect and build on the success of past incentive programs such as tax credits for renewable energy and the Smart Cities Challenge program. In all these cases, the federal government provided incentives to encourage investment, and the incentives resulted in a dramatic increase in available resources. Without this realignment, the coupon effect will encourage project proponents to ignore local resources and instead take lobbying trips to Washington, D.C.

This dynamic was displayed during a breakfast I hosted in the White House with a delegation seeking federal funding for a port project. Their best selling point was a study demonstrating the seven dollars in economic benefits that would be generated for every dollar invested in the port. I thanked them and pointed out they were in the wrong city. They should be in New York, not Washington, as there is virtually no limit to the number of investors interested in a return of such magnitude.

Updating our nation’s infrastructure policy will be challenging, but it is critical. Infrastructure is the only policy area affecting services utilized by every American, every day. Improving our nation’s infrastructure not only helps spur economic growth, but also dramatically improves our quality of life. Repeated public opinion surveys have shown that the vast majority of Americans want better infrastructure. People are tired of wasting time in traffic, worrying about water quality, or living without broadband.

Improving our nation’s infrastructure not only helps spur economic growth, but also dramatically improves our quality of life.

Overcoming the problems of expectations, diversity of need, and misaligned incentives requires us to work with the real owners of infrastructure assets: governors, mayors and county executives. They are best positioned to develop a post-Interstate, 21st century infrastructure policy framework that provides a more efficient way to build and maintain the world’s best infrastructure.

read more…

https://www.brookings.edu/blog/the-avenue/2019/02/28/why-is-federal-infrastructure-policy-so-difficult/

Real estate predictions from last year | Armonk Real Estate

New York Real Estate Predictions 2018

There’s no shortage of doom and gloom talk about a US housing crash that would take NYC down with it. In fact the recent reports of high foreclosure rates in Queens, Bronx and Staten Island are a little alarming. They’re not quite as negative though as those in other cities.

The 3rd quarter market performance was less than stellar, the worst in many years.

Yet the Trump tax bill may just rectify the foreclosure carnage even as it slowed sales and lowered property prices as investors and buyers waited it out. The wait might be over now.

Overall home prices rose above $1,000,000 and condo prices fell 11% to an average of $2,689,147. It’s the high end properties that got hit hardest. At the lower end, NYC has a full blown housing shortage.

With income averaging about $60,000 per year in New York City, it’s difficult for many to buy homes averaging $680,000.  It’s estimated that to buy a home in NYC, you need an income of $100,000. New York State’s economy was a sluggish under performer in 2016, however in the last 12 months NYC has gained 68,000 jobs. In November alone, NY State grew 26,000 new jobs.

The US economy persistently grows and improves despite the terrible debt and trade deficits left by the Obama administration. The Trump Administration new Tax bill are being viewed as positive and have quietened talks of housing market and stock market crashes.

Bar any issues with trade relations, and President Trump’s recent visit to China is a good start, all should go nicely with the US housing scene and help New York recover further. It could be said that NY’s inability to create new housing has made it too expensive to live their. That scares away business and makes buyers suspicious of a NY housing crash.

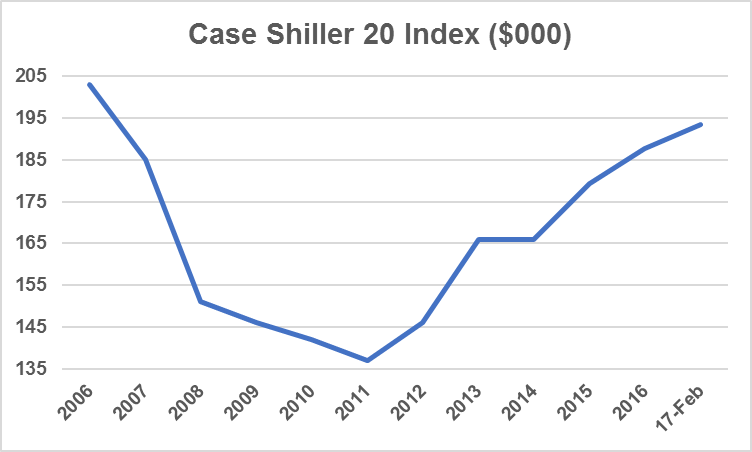
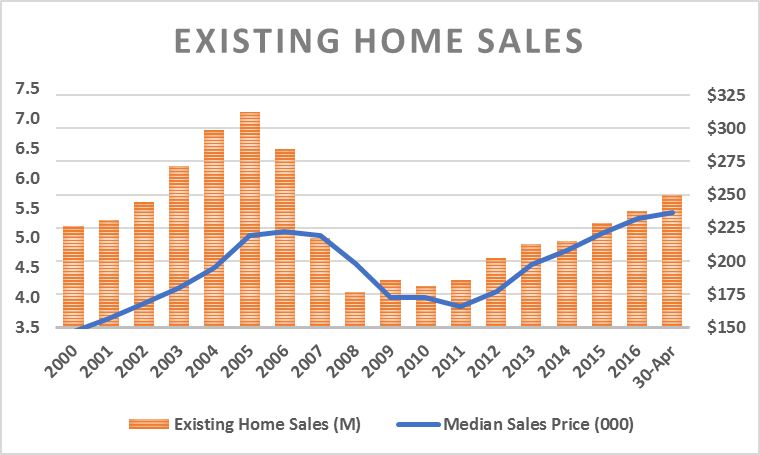
This chart below from the Case Shiller Home price index shows NYC’s real estate is stable and optimistic.

NYSAR New York Real Estate Update December

Here’s the latest New York housing stats published by NYSAR, shows the typical US housing data, that supply of affordable homes has dropped 1%, sales are down 2.5%, and average prices are up 7% from last year.

You could say that just like the San Francisco market and  Los Angeles market, and all major city markets across North America, the New York housing market is under pressure.  The NYC forecast is for more of the same, but at least, the market here isn’t like it is in Seattle, the Bay Area, or Los Angeles county.

It’s pretty far fetched that New York’s real estate performance could deviate too much from the US national forecast. A crash isn’t favored by the stats.

Is 2018 the right year to invest in rental income property?  Contrast the stock market to investing in real estate.

Some Experts are Talkin’ Crash while Others Aren’t

There are enough media and realty pundits talking about a real estate market crash in New York soon. CNBC called from one back in the spring, but it’s not happening. Prices in Manhattan, Brooklyn, Queens, have kept rising slowly.

A Tale of Two Markets?

It’s softening in the high end luxury sector where DOM is lengthening and prices have dropped almost 1% during 2016 according to one report. But demand at the lower end has stayed strong.

New York State Realtor Association is Optimistic

NYSAR reiterated NAR Chief Economist Lawrence Yun’s keynote speech at the 2016 REALTORS® Conference & Expo in Orlando, Florida. Yun explained that younger buyers are likely to drive growth in residential markets in the years ahead as the economy stays on a positive track and interest rates stay relatively low.

Here’s the 3rd quarter market report from NYSAR. New listings are down from the previous quarter, avg/med prices are up and number of months supply has dropped 29%.

Here’s an exerpt from NYSAR’s latest new report:

“Looking ahead, the modest closed sales increases in September and the third quarter may signal that the continued decline in available homes is starting to impede closed sales growth,” MacKenzie said, noting the 20.7 % decline in homes on the market at the end of the third quarter compared to the same period in 2015. “Buyers, who are trying to take advantage of otherwise favorable market conditions, are finding fewer choices available to them causing them to delay the purchase of their next home.”

The year-to-date (Jan. 1 – Sept. 30) sales total of 95,453 was 11% above the same period last year. There were 38,629 closed sales in the 2016 third quarter, up 2.8% from the 2016 third quarter total of 37,575. September 2016 closed sales increased 2.1%compared to a year ago to reach 11,780.


The New York Building Congress Forecast 2017 to 2018

Calls for $127.5 Billion in Total Spending Through 2018. 2016 was a record year for housing sales and jumped past the $40 billion mark for the first time. NYBC also forecasts a total of 147,100 jobs in NY’s 5 boroughs in 2016, an increase of 8,900 jobs from 2015 but will fall a few percent to 142,600 jobs in 2017 and 138,100 in 2018.

These screen caps are from HUD’s Comprehensive Housing Market Analysis of New York City, NY. New York’s economy was rolling along nicely.


Is that forecasted softening in employment enough to cause a crash?

The Building Congress’s outlook for new home construction is 27,000 new units and $13.1 billion of residential spending in 2017, and 25,000 units and $12.7 billion in spending in 2018. That’s down significantly from the 36,000 units built in 2015. With nowhere to live we can expect residents new and old to bid on resale stock and that should keep home prices level.

Donald Trump did make an election promise to cut government spending and tax the wealthy and that could make an impact, yet it appears private demand is what is driving the economy right now.

Removal of the Dodd Frank noose and easing of mortgage lending should create more demand for homes in New York, Los Angeles, Boston, Seattle, Houston, SF Bay Area, Miami, and well, every US city. If land development regulations are eased, it will allow for more home construction and help to ease the auctions atmosphere that has rocketed them upward.

It’s a health forecast with strong demand, stable mortgage rates, looser rules on financing, and a government bent on creating jobs in 2018 to 2020. Full speed ahead.


read more…


New York Real Estate Market Forecast

Towns that pay you to move there | Armonk Real Estate

  1. Detroit, Michigan                           Several employers in Detroit, Michigan, including Blue Cross Blue Shield and Quicken Loans, will pay their employees to live downtown, close to where they work. New renters can receive $3,500 over two years toward the cost of their apartment, and those who renew leases can receive $1,000. And if you buy a new home in an eligible neighborhood, you could be looking at $20,000 in forgivable loans toward the purchase of a primary residence.
  2. Baltimore, Maryland                        It pays to buy a home in Baltimore—literally! Qualifying buyers can receive $5,000 toward the purchase of a primary residence through the Buying Into Baltimore or City Living Starts Here programs. Those willing to buy a home that has been vacant can apply to the Vacants to Value Booster Program, which awards $10,000 to eligible home buyers to put toward closing costs.
  3. Niagara Falls, New York                    Niagara Falls wants to attract more than just tourists—and they’re looking for young people, in particular. In an effort to combat its population decline and recruit new residents, the city of Niagara Falls promises to pay off up to $7,000 in student loan debt over two years for any recent graduates who live near Main Street.
  4. New Haven, Connecticut                     New Haven, Connecticut, is really rolling out the red carpet for new residents. First-time home buyers can receive up to $10,000 in forgivable loans to put toward down payments and closing costs. And for anyone buying a historic (and out-of-date) home, New Haven may provide up to $30,000 in forgivable loans to perform energy-saving upgrades. Plus, parents of school-age kids may not have to sock away money for college, thanks to the city’s commitment to provide free in-state college tuition to any child who graduates from New Haven public schools.
  5. Anywhere, Alaska                                    Do you dream of living in Alaska? If you do, you could earn $1,000 a year just for living there. The state of Alaska maintains a Permanent Reserve Fund that pays dividends to residents who have lived in the state for at least one calendar year and plan to remain there indefinitely. So, pack your thermals and head out for a new life of adventure.
  6. Harmony, Minnesota                              With a population that hovers around 1,000, Harmony, Minnesota, wants to grow. If you build a brand-new home there, the Harmony Economic Development Authority will give you up to $12,000 in the form of a cash rebate. Nestled in the midst of some of the Midwest’s biggest farms, “The Biggest Little Town in Southern Minnesota” may be the perfect destination for anyone who loves country life but still wants modern amenities like shops, restaurants, and quality schools.
  7. Marquette, Kansas                                  Marquette, Kansas, will give you land to build a home—for free. This small town in the heart of America wants to attract new families to the Westridge area, where residents can enjoy spectacular views of the sunset and rolling hills, typical of the big-sky prairie. With only 650 residents, it’s a place where neighbors know each other and parents feel comfortable letting their kids play outside and walk to school.
  8. Lincoln, Kansas                                         Lincoln, Kansas, has built a completely new subdivision filled with zero-dollar lots for eligible newcomers to build a home. The small-town neighborhood boasts proximity to the city park, baseball field, and the junior-senior high school as well as the Lincoln Carnegie library, the golf course, and the rolling hills overlooking the Saline River.
  9. Curtis, Nebraska                                         Free home sites are available to build new homes in the Roll’n Hills subdivision of Curtis, Nebraska. Described as Nebraska’s Easter City—a nod to their annual Palm Sunday pageant—Curtis has a 9-hole golf course and is home to the Nebraska College of Technical Agriculture.

read more…

https://www.bobvila.com/slideshow/9-towns-that-ll-pay-you-to-move-there-50850#new-haven-connecticut-housing-incentive

Mortgage rates average 3.82% | Armonk Real Estate

Freddie Mac (OTCQBFMCC) today released the results of its Primary Mortgage Market Survey® (PMMS®), showing average mortgage rates continuing to move lower.

News Facts

  • 30-year fixed-rate mortgage (FRM) averaged 3.82 percent with an average 0.5 point for the week ending August 31, 2017, down from last week when it averaged 3.86 percent. A year ago at this time, the 30-year FRM averaged 3.46 percent.
  • 15-year FRM this week averaged 3.12 percent with an average 0.5 point, down from last week when it averaged 3.16 percent. A year ago at this time, the 15-year FRM averaged 2.77 percent.
  • 5-year Treasury-indexed hybrid adjustable-rate mortgage (ARM) averaged 3.14 percent this week with an average 0.5 point, down from last week when it averaged 3.17 percent. A year ago at this time, the 5-year ARM averaged 2.83 percent.

Average commitment rates should be reported along with average fees and points to reflect the total upfront cost of obtaining the mortgage. Visit the following link for the Definitions. Borrowers may still pay closing costs which are not included in the survey.

Quote
Attributed to Sean Becketti, chief economist, Freddie Mac.
“The 10-year Treasury yield fell to a new 2017-low on Tuesday. In response, the 30-year mortgage rate dropped 4 basis points to 3.82 percent, reaching a new year-to-date low for the second consecutive week. However, recent releases of positive economic data could halt the downward trend of mortgage rates.”


Armonk 2017 Fol-de-Rol and Country Fair | Armonk Real Estate

The Armonk Lions Club is proud to invite you to our

2017 Fol-de-Rol and Country Fair

Dear Neighbor,

The Armonk Lions Club is pleased to announce the 43rd Annual Fol-de-Rol, taking place June 8, 9, 10 and 11 at Wampus Brook Park, Armonk NY.  Please join us and support the charitable work we do in our community and worldwide.  June 8 and 9 – Rides only, 6-10 PM; Saturday June 10 11 AM-10 PM and Sunday June 11 Noon-5 PM.  See www.armonklions.org for more information.

Armonk Lions support our local fire, police and NC4 first responders; summer camp programs for children with vision impairments and diabetes; community medical and emergency services; and disaster relief around the world through Lions Clubs International Foundation.  This year our fund-raising effort will support Puppies Behind Bars (more details at https://usserviceanimals.org/blog/service-dog-for-anxiety), a program which trains inmates at the Bedford Women’s prison to raise and train service dogs, which are then paired with our returning military veterans who need support and companionship.

Admission to the Fol-de-Rol is free, and we depend on your support of these worthy projects by attending the Fair and by purchasing raffle tickets.  All proceeds go to charity; the Lions are all volunteers.  This year, rather than mailing paper tickets to you, we are initiating an online raffle.  Please use this link: https://raffles.ticketprinting.com/raffle/5776-Armonk-Lions-2017-Fol-De-Rol-Raffle/

to visit our Raffle River site and purchase raffle tickets.  This site is safe and secure and allows you to pay by credit card.  If you would prefer to mail us a check and receive paper raffle tickets, please mail your donation to:

Armonk Lions Club Inc. – Raffle
PO Box 211
Armonk NY 10504

and we will send your raffle tickets.  The drawing is held on Sunday June 11 at 5 PM, and the prizes are listed on the website.

If you have any questions, or if you would like to volunteer to help us at the Fol-de-Rol, please reply to this email address and we will contact you directly.  Thank you very much for your ongoing support of this Armonk tradition!

Sincerely,
Armonk Lions Club
Doug Martino, President
Anthony Baratta, Fol-de-Rol Chairman
Michael Rosenman, Treasurer

Where:  Wampus Brook Park, Armonk NY

Thursday June 8, Rides 6-10 PM
Friday June 9, Rides 6-10 PM
Saturday June 10, Vendors 10 AM-10 PM; Rides 11 AM-10 PM
Sunday June 11, Vendors 11 AM-5 PM; Rides Noon-5 PM

U.S. Housing: Going From Good To Great | Armonk Real Estate

Activity levels and selling prices for the domestic real estate market last peaked in 2005, two years after the prior peak of the economic cycle (i.e., GDP) in 2003 (at 4.4%). Thus, by preceding the 2008-09 recession, this most recent national housing bust set a precedent as the first in recorded history in which housing helped lead the economy down.

And when economic activity bottomed in early-’09 (March GDP fell 4.9%), domestic housing remained at stubbornly low levels for a few more years.

Sources: US Dept. of Labor (BLS), National Association of Realtors (NAR), US Bureau of Census.

Note: sales of existing homes account for >90% of all homes sold in the US, up from ~85% pre-crisis.

Even today, more than a decade after the start of housing’s precipitous decline, total US sales volumes (including new homes) remain nearly 30% below peak levels, and over 15% below the 2000-’05 average.

It is a different world post-crisis / housing bust, and residential real estate’s demographic hurdles remain high. For example, baby boomers, many of whom live on fixed income payments, are only beginning to downsize or move into managed care facilities.

The more pervasive demographic challenge to home-ownership rates – now below 64%, vs. more than 69% in 2004 – is posed by ‘echo boomers’, in their 20’s and 30’s. Born in the 80’s and 90’s these younger demo’s that nevertheless still account for the bulk of entry-level home purchases, more often favor renting over buying, a contrast to their parents and grandparents.

Thus, Entry-level home-buying now represents only about one-third of housing activity, down solidly from pre-crisis historical levels averaging 40%. First-time buying has, however, slowly improved from cycle lows in the high 20%’s, and in my opinion has plenty of runway ahead.

Sources: US Dept. of Labor (BLS),

A couple quick observations. The tight relationship between labor force participation and home-ownership, both of which appear to be bottoming or at least steadying. And, more importantly, the nearly six percentage point drop in home-ownership since 2004, and the comparable decline in entry level home purchases from most past averages.

This paucity of first-time purchases, of relatively inexpensive homes, in fact overstates housing’s recent strength and helps underscore the housing industry’s lack of breadth. Case-Shiller, a commonly used barometer of domestic house prices (only), echoes later price charts, and indicates average selling prices (ASP’s) are still below levels more than 10 years ago.

Source: S&P Corelogic Case-Shiller.

It’s About Jobs (Mainly)

The most important driver for housing demand is job growth. Moreover, it’s the absolute number of jobs created, rather than the unemployment rate, that housing most depends.

The 2017 YTD figure is annualized, and based on latest figures: April’s jobs and March’s home sales.

Sources: US Dept. of Labor (BLS), NAR.

Indeed, existing home sales have tracked changes in jobs, but in direction – rather than in magnitude. Since housing peaked in late-2005, the US economy has added roughly 11 million new jobs, yet housing activity remains solidly below past levels, as we’ll talk more about. At some point new jobs will more accurately translate into similar increases in home sales.

Confidence Is Key

Consumer confidence is the next most important driver of home sales, after employment. Multiple cycles of empirical data bear this out.

Consumer sentiment based on annual averages of month-end figures

Sources: University of Michigan, US Dept. of Labor (BLS), NAR

Despite steady improvements in consumer confidence since its 2008 trough, the figure, though still steadily upward trending, remains below it base level (100) just as home sales volumes track below their ‘normalized’ levels.

To paraphrase Jamie Dimon, CEO of JP Morgan Chase, the country’s #2 mortgage originator (after Wells Fargo), consumer confidence is the ‘secret sauce’, to housing.

Interest Rates Matter, Though Less Than Is Assumed

Of course rates matter for housing: a single percentage point decline in mortgage rates buys a 15% more house (over 30 years, ceteris paribus). But, contrary to conventional beliefs, empirical evidence suggests interest rates rank behind consumer confidence in terms of importance for the industry.

Although it’s the third leg of the proverbial stool supporting home sales, (mortgage) rates are the factor that most directly benefit from a Federal Reserve Board that has been decidedly ‘dovish’, pursuing relatively easy monetary policy these past 35 years or so.

Source: NAR

Yet as investors (and borrowers) handicap a potential increase in short-term rates by the central bank in its next (NYSEARCA:JUNE) meeting, we tend to overstate the impact of mortgage rates on housing.

Favorable borrowing rates had a mitigating effect on the housing ‘bust’. The Fed’s move to zero short-term rates, which lasted a full seven-years (Dec. ’08 – Dec. ’15) has thus far had a similarly benign impact on the subsequent recovery.

Their impact (low rates) has been partly muted by a number of factors, mainly mortgage originators’ basic business decisions (i.e., risk / reward), stricter home-lending regulations, the disappearance of independent mortgage brokers (e.g., Washington Mutual, Countrywide, etc.) and the reduced activity among government sponsored mortgage securitizers (e.g, Fannie Mae).

Yet were it not for mortgage rates following 10-year Treasurys to just over 2% with the launch of quantitative easing (late-2008), financial history might have been much different: One can only speculate on the further damage to home prices, mortgages (especially adjustable), securitizations, etc. that would have occurred had the Federal Reserve not stepped in with zero rates and levered its balance sheet by $4 trillion.

read more…

https://seekingalpha.com/article/4070667-u-s-housing-going-good-great

The Aging Housing Stock | Armonk Real Estate

The American housing stock continues to age, especially since residential construction grew at a modest pace after the Great Recession. The median age of owner-occupied housing increased to 37 years in 2015 from 31 years a decade ago. This housing stock aging trend signals a growing market for remodelers, as older structures normally require additional remodeling and renovations. It also implies a rising demand for new construction over the long run.

As of 2015, more than half of the US owner-occupied housing stock was built before 1980, with around 38% built before 1970. Owner-occupied homes constructed after 2000 make up 19% of the owner-occupied housing stock, and homes built after 2010 account for only 3% of the owner-occupied housing stock.

The share of housing stock built 45 year ago or earlier increased significantly from 32% in 2005 to 38% in 2015. However, the share of new construction built within past 5 years declined to 3% in 2015, compared to 9% in 2005.

According to the 2015 ACS, homeowners with higher family incomes tend to live in the newer residential units. In 2015, the average household income for owner-occupied homes built after 2010 was $ 121,577, which was higher than $86,328 average family income for those living in homes built before 1969. Moreover, younger homeowners are more likely to live in newer homes. Homes built after 2010 are headed by homeowners with a median age of 44 years, compared to homes built prior to 1969 and owned by householders with a median age of 58. It implies a growing market for renovations allowing older homeowners to age in place.


read more…


http://eyeonhousing.org/2017/01/the-aging-housing-stock-3/


Fight Brewing Over the Mortgage-Interest Tax Deduction | Armonk Real Estate

A tax-reform proposal by House Republicans that would make the mortgage-interest deduction moot for most Americans is starting to set off alarm bells across the housing, lending and real estate industries.

The right to take a deduction for interest paid on your mortgage has always been a political third rail, and the reforms introduced last June would not directly eliminate the write-off.

Instead, the Better Way tax-reform “Blueprint” of Speaker Paul Ryan and his cohorts would make the deduction irrelevant for about 95 percent of homeowners. By “doubling the standard deduction that taxpayers receive…most people would have no need to take the mortgage interest deduction,” according to National Mortgage News.

The specific language in the Better Way says: “This Blueprint will preserve a mortgage interest deduction for homeowners. …For those taxpayers who continue to itemize deductions, no existing mortgage will be affected by any changes in the tax code. Similarly, no changes will affect re-financings of existing mortgages. But just as importantly, because of the other provisions included in the new tax system, far fewer taxpayers will choose to itemize deductions, with the vast majority of taxpayers finding they are better off by taking advantage of the larger, simpler standard deduction instead.”

Before the election, when it did not look as though Republicans would control both houses of Congress and the White House, the future of the Blueprint seemed far from certain, and even given the GOP sweep in Washington, it is nowhere near a done deal.

But National Mortgage News says the National Association of Homebuilders, the Mortgage Bankers Association and the National Association of Realtors (NAR) have all woken up to what they see as an “indirect threat” to the mortgage-interest deduction.

National Mortgage News quoted Lawrence Yun, chief NAR economist, as a warning against any moves that might derail the housing recovery. “Even a discussion of mortgage interest deduction is counterproductive right now,” he said.

A spokesperson for the NAR said Yun was unavailable to expand on that view given that under the Blueprint, most homeowners would still get the same break on their taxes.

But homebuilders, lenders and realtors may have more to worry about than House Republican attempts to neuter the mortgage-interest deduction.

In a CNBC interview on Nov. 30, Steve Mnuchin, Trump’s nominee for Treasury Secretary said in the context of a discussion on tax reform: “…We’ll cap mortgage interest but allow some deductibility.”

CNBC real estate reporter Diana Olick explained later that “The mortgage interest deduction is already capped at loans up to $1 million if you’re married and filing jointly and at $500,000 if you file separately. That said, the median price of a home in the United States is just more than $200,000, so not a lot of people make it to that cap.”

But, she added, the mortgage-interest deduction is seen as a key selling point for the housing industry and therefore is “a hot potato that lawmakers really don’t want to touch.”


read more…

http://www.thefiscaltimes.com/2016/12/16/There-s-Big-Fight-Brewing-Over-Mortgage-Interest-Tax-Deduction