Tag Archives: Armonk Luxury Real Estate

Armonk Luxury Real Estate

Rents Cooled in the Third Quarter | Armonk Real Estate

Record levels of new multi-family construction are meeting demand in the nation’s hottest market, cutting in half the pace of rent increases nationwide and driving down median rents in more markets during the third quarter, according to rental analytics firm Axiometrics.

Nationally, rents rose only 3% for the third quarter of 2016, more than 2 percentage points below the robust 5.2% rent growth of one year ago. This marked the fourth straight quarter in which the annual rent growth rate decreased.  The average effective rent nationwide was $1,289 per unit per month, compared to $1,251 in the third quarter of 2015.

“While the national apartment market is still performing above the long-term average, the moderation from the unsustainable levels of 2014 and 2015 has come, as Axiometrics predicted,” said Jay Denton, Axiometrics Senior Vice President of Analytics. “In particular, rent growth has declined precipitously in markets with the highest rents in the country, such as New York and the San Francisco Bay Area.”

Rent levels declined year over year in the three major markets with the highest rents — San Francisco, New York and San Jose — and increased by less than 2% in the fourth highest rent-growth metro, Oakland. Although Houston isn’t a high-rent market, its -2.8% rent growth in the third quarter also helped weigh down the national rate.  Hartford, Birmingham and Oklahoma City also experienced negative annual rent growth.

Third-Quarter 2016 Rent, Rent Growth in Highest-Priced Markets

Market

Average Effective Rent

Annual Effective Rent Growth

San Francisco

$3,292

-0.5%

New York

$3,036

-0.2%

San Jose

$2,817

-0.8%

Oakland

$2,413

1.8%


“Urban cores in general are showing slowing performance,” Denton said. “The market is feeling the effects of the concentrated new supply in these submarkets. Nationwide, however, supply is just keeping up with the demand.”

The slower performance of high-priced markets is somewhat counteracted by robust fundamentals in secondary markets. For example, annual effective rent growth in Sacramento; Riverside, CA; Salt Lake City; Las Vegas; Fort Worth; Tampa-St. Petersburg; and Nashville are among the 10 highest in major markets.

Other Third-Quarter Highlights

•             Effective rents increased 1.2% in the third quarter over the second quarter. The rent-growth rates for the past four quarters have been lower than the previous corresponding quarters.

•             Occupancy was 95.1% in the third quarter, compared to 95.2% in the second quarter and 95.4% in the third quarter of 2015.


  • 95.4% in the third quarter of 2015.

Top 25 Markets for Rent Growth and Occupancy

The top 25 Metropolitan Statistical Areas or Metropolitan Divisions — among Axiometrics’ top 50 markets with the most apartments — in various third-quarter 2016 categories:

Top 25 Markets by Annual Effective Rent Growth for 3Q16

MSA/Metropolitan Division

Annual Effective Rent Growth

Sacramento-Roseville-Arden-Arcade, CA

11.9%

Riverside-San Bernardino-Ontario, CA

7.9%

Seattle-Bellevue-Everett, WA

6.7%

Salt Lake City, UT

6.7%

Phoenix-Mesa-Scottsdale, AZ

6.4%

Las Vegas-Henderson-Paradise, NV

5.7%

Fort Worth-Arlington, TX

5.6%

Tampa-St. Petersburg-Clearwater, FL

5.5%

Nashville-Davidson-Murfreesboro-Franklin, TN

5.4%

Atlanta-Sandy Springs-Roswell, GA

5.4%

San Diego-Carlsbad, CA

5.3%

Anaheim-Santa Ana-Irvine, CA

4.9%

Orlando-Kissimmee-Sanford, FL

4.9%

Dallas-Plano-Irving, TX

4.6%

Charleston-North Charleston, SC

4.4%

Memphis, TN-MS-AR

4.3%

Warren-Troy-Farmington Hills, MI

4.2%

Portland-Vancouver-Hillsboro, OR-WA

4.1%

Los Angeles-Long Beach-Glendale, CA

4.0%

Charlotte-Concord-Gastonia, NC-SC

4.0%

Raleigh, NC

3.7%

Minneapolis-St. Paul-Bloomington, MN-WI

3.7%

Indianapolis-Carmel-Anderson, IN

3.5%

Boston-Cambridge-Newton, MA-NH

3.5%

West Palm Beach-Boca Raton-Delray Beach, FL

3.3%

National

3.0%

Top 25 Markets by Quarterly Effective Rent Growth for 3Q16

MSA/Metropolitan Division

Quarterly Effective Rent Growth

Sacramento-Roseville-Arden-Arcade, CA

4.2%

Salt Lake City, UT

3.0%

San Francisco-Redwood City-South San Francisco, CA

2.6%

Boston-Cambridge-Newton, MA-NH

2.5%

Atlanta-Sandy Springs-Roswell, GA

2.4%

San Diego-Carlsbad, CA

2.3%

Seattle-Bellevue-Everett, WA

2.1%

Orlando-Kissimmee-Sanford, FL

2.0%

Warren-Troy-Farmington Hills, MI

2.0%

Charleston-North Charleston, SC

2.0%

Los Angeles-Long Beach-Glendale, CA

1.9%

Raleigh, NC

1.9%

San Antonio-New Braunfels, TX

1.9%

Portland-Vancouver-Hillsboro, OR-WA

1.9%

Riverside-San Bernardino-Ontario, CA

1.8%

Silver Spring-Frederick-Rockville, MD

1.8%

Fort Worth-Arlington, TX

1.7%

Anaheim-Santa Ana-Irvine, CA

1.7%

Denver-Aurora-Lakewood, CO

1.5%

Charlotte-Concord-Gastonia, NC-SC

1.5%

Nashville-Davidson-Murfreesboro-Franklin, TN

1.4%

Dallas-Plano-Irving, TX

1.4%

Tampa-St. Petersburg-Clearwater, FL

1.3%

Memphis, TN-MS-AR

1.2%

Washington-Arlington-Alexandria, DC-VA-MD-WV

1.2%

National

1.2%


read more…


http://www.realestateeconomywatch.com/2016/09/rents-cooled-in-the-third-quarter/

Small wall mounted guest bath sinks | Armonk Real Estate

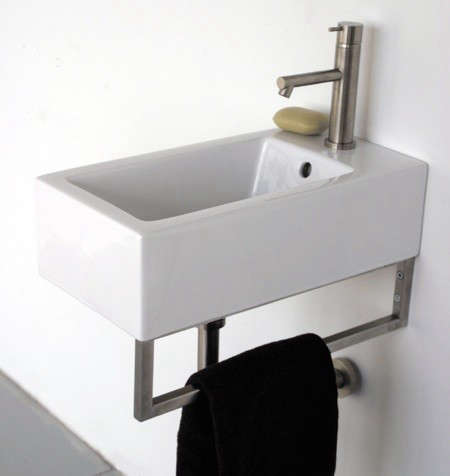
When washroom space is limited, small-profile sinks are essential: Here are ten tiny wall-mounted sinks for the guest bathroom.

Above: Lacava’s 5074 Aquamedia Washbasin in white porcelain measures 10.25 by 19.75 by 7 inches; the wall-mounted version includes a towel bar; $390 at Faucet Farm.

Above: Duravit’s Happy D. Hand Rinse Basin in white porcelain measures about 20 inches wide and 10 inches deep; $180 at Every Faucet.

Above: The wall-mounted Round Ann Sink measures 15.75-inches wide and deep; $79.99 at Ikea.

Above: Kohler’s Taunton Cast-Iron White Wall-Mount Lavatory measures 14 by 16 inches; $337.99 at Plumbers Surplus.

Above: The Scarabeo Thin-Line Ceramic Washbasin measures 11.7 inches square; $350 at eFaucets.

Above: The Whitehaus Wall-Mounted Basin measures approximately 20 by 10 by 5 inches and is available with a chrome towel bar; $258.75 at eFaucets.

Above: Lacava’s Alia Wall Mounted Porcelain Lavatory SInk is 22 inches wide and 11 inches deep; $375 at Lacava.

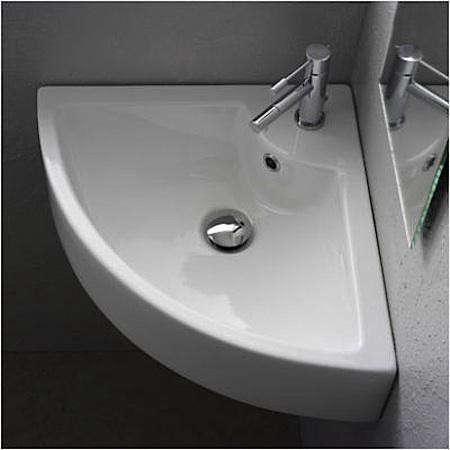
Above: A space-saving corner sink, the white porcelain Scarabeo Square Wall-Mounted Corner Sinkby Nameeks measures 18.5 inches wide and deep; $486.50 at Every Faucet.

Above: The Duravit Architec Series Hand-Rinse Basin measures a tiny 14 inches; $241.50 through Amazon.

Above: Duravit’s Vero Basins are a modern European classic and are available in several sizes and configurations, including the approximately 10-by-18 inch Vero Handrinse Basin; $296.25 at eFaucets.


read more…


http://www.remodelista.com/posts/10-easy-pieces-wall-mounted-guest-bath-sinks/

Freddie Mac real estate outlook | Armonk Real Estate

Freddie Mac (OTCQB: FMCC) released today its monthly Outlook for October showing that housing remains a bright spot in the face of a marginally improving U.S. economy and tight inventories of for-sale homes. However, mortgage activity, which has benefited greatly from low mortgage rates post-Brexit, is starting to see a slowdown in refinance activity that will persist into next year as the mortgage market transitions to a purchase-dominated mix.

Outlook Highlights

  • Continued strength in consumer spending and a reduction in the drag from inventory spending should boost second half growth, resulting in full-year 2016 GDP growth of 1.6 percent. The economy should do modestly better in 2017, posting 1.9 percent year-over-year growth.
  • A mature expansion operating near full employment only needs to generate enough jobs to keep the unemployment rate steady. Expect the unemployment rate to decline slightly over the next year-and-a-half, ending 2017 at 4.7 percent.
  • Even if worldwide bond yields recover to the pre-Brexit status quo, mortgage interest rates are likely to remain low for an extended period. Expect a gradual rise in rates throughout the remainder of 2016 and into 2017, with the 30-year fixed-rate mortgage averaging 3.9 percent in the fourth quarter of 2017.
  • Don’t expect much increase in total home sales going forward with a slight decline in seasonally-adjusted sales in the fourth quarter. Next year, rising new home sales driven by increases in new single-family housing construction will push total home sales slightly higher, to 6.16 million in 2017 compared to 6.04 million in 2016.
  • Forecasting house prices will grow at a 5.6 percent annual rate in 2016, moderating to 4.7 percent in 2017.

Quote: Attributed to Sean Becketti, Chief Economist, Freddie Mac.

“The economy and labor markets are looking better. We’re even seeing modest wage gains. And Fed watchers are increasingly predicting a December rate hike as things improve. However, worldwide economic growth is weak and its prospects have gotten worse. This may all sound familiar because we’ve been here before… last year.

“As the economy sputters along a little bit faster than stall speed, the U.S. housing market continues to be a bright spot, though there’s less room to run than in the prior few years. Unlike new home sales, existing home sales have nearly recovered back to pre-recession norms. Regardless, we see new home sales improving some next year driven by increases in new single-family housing construction which will push total home sales slightly higher.”


Home builder confidence surged in September | Armonk Real Estate

Home builder confidence surged in September to match its highest reading in a decade, an industry group said Monday.

The National Association of Home Builders’ index jumped six points to 65 in September. That was the highest since last October, which was the highest since the height of the housing boom. Economists surveyed by MarketWatch had forecast a 60 reading.

The gauge of current sales conditions soared 6 points to a cycle high of 71 and the index of future sales jumped 5 points, also touching 71. The index that tracks buyer traffic rose four points to 48. It hasn’t topped the neutral 50 mark since mid-2005.

In a release, NAHB noted that builder sentiment is being bolstered by the presence of “more serious buyers.”


read more…


http://www.marketwatch.com/story/home-builder-confidence-roars-to-a-cycle-high-in-september-nahb-says-2016-09-19?siteid=bnbh

Babe Ruth’s NYC apartment for sale | Armonk Real Estate

The home that Ruth built is for sale for just under $1.6 million on the Upper West Side.

Babe Ruth’s former two-bedroom, three-bathroom co-op at 345 W. 88th St. — where he lived at the end of his historic New York career — drew about 50 prospective buyers to its open house Sunday.

“My fondest memories [of the apartment] are of me and Father listening to ‘The Green Hornet’ on the radio and looking out to Riverside Park,’’ the Yankees legend’s daughter, Julia Ruth Stevens, 98, told The Post from her home in Conway, New Hampshire.
“Mom and Dad loved to entertain there,’’ Stevens said. “We had a maid and cook, and Dad would always invite Yankees who had been traded and were in town with other teams. He knew they wanted a home-cooked meal [while on the road].”
The Douglas Elliman listing touts the home’s location and amenities such as a live-in super and storage space. But, amazingly, the fact that Ruth once called it home is the last sentence of the pitch.

“Well run, pet friendly. Has a part-time doorman, live-in super, bike room and storage bins. In a terrific UWS location. Babe Ruth lived in this very apartment,” the listing reads.
But for those thinking that the pad’s $1.595 million price is a complete steal, there is also a $2,864-a-month fee for maintenance and common charges.

A plaque outside the building notes that the Sultan of Swat moved into the apartment in 1929 and resided there “for several years.”

The Bambino, his second wife, Claire Merritt Ruth, and their daughter lived in the home from 1929 to 1940, Stevens said.
Ruth’s 15-season career in New York, from 1920 to 1934, marked the beginning of the Yankee Dynasty. Ruth’s Yankees won the franchises’ first seven American League pennants and four World Series titles.

Ruth, widely regarded as the greatest Yankee ever, was just 53 when he died in 1948.

During their time on 88th Street, the Ruths had the entire 11-room seventh floor before it was divided into two units at some point after they moved to 173 Riverside Drive. The apartment currently up for grabs is one of those units.


http://www.marketwatch.com/story/babe-ruths-apartment-for-sale-for-16-million-2015-09-01

Obama calls Westchester County housing racist | Armonk Real Estate

The Obama administration’s heavy-handed attempts at social engineering just moved to a disturbing new level — right in Westchester.

The Justice Department wants the county held in contempt of court, fined $60,000 a month and forced to set up an escrow account of $1.65 million — in a move growing out of its longstanding claim that the county’s housing policies are racist.

It’s a preposterous claim, of course. And Friday, County Executive Rob Astorino holds a press conference to decry it.

Good for him. Because the move is based on a technicality, and it actually says more about Team Obama’s overreach than about anything the county has or hasn’t done.

The Justice Department’s claim focuses on 28 units of “affordable” housing that are to be built in downtown Chappaqua, home of Hillary Clinton. Under a 2009 consent decree, Westchester agreed to build 750 units in wealthy, largely white towns and to “market them aggressively” to non-whites. Financing for the first 450 units was to have been approved by the end of last year.

Westchester actually met that deadline — but the feds disqualified the Chappaqua project anyway, because the town hadn’t yet issued all required permits by Dec. 31. And because Astorino’s office, the feds say, didn’t ride roughshod over the town and bully it into submission.

Let’s be honest: For years, the administration has been trying to, as one official put it, “remove zip codes in the quality of life in America.” Meaning anyone should be able to live anywhere, even if they can’t afford it.

Its legal case is based on the dubious notion of “disparate impact” — statistical differences by race without any specific proof of actual discrimination.

Want more evidence Justice’s act is politically motivated? Note, then, that it filed its motion despite the fact that the Chappaqua housing project was recently fast-tracked.


read more…


http://nypost.com/2015/07/23/team-obama-claims-westchester-is-racist-in-latest-overreach/

Cleaning Up Armonk | Armonk Real Estate

To The Residents of North Castle…………………….


            On July 3, 2015 I wrote a letter to the Town Board (see below). The issue at hand relates to the irresponsible and hazardous stockpiling of asphalt millings or RAP (Recycled Asphalt Pavement) within the Highway Department’s property off Bedford Road and within its yard on Middle Patent Road.  There is great concern that the stockpiling of asphalt millings can cause serious human health and environmental problems.  Dust particles containing high concentration of pollutants can be wind swept into the air off of stockpiles and rainfall can cause these same pollutants to leach out into the soil and eventually find their way into our water supply.


I am very concerned that the Town maybe stockpiling this material without the proper permits required from the New York State Department of Conservation (DEC) nor are they abiding by the New York State Environmental Quality Review Act or SEQR.  To read more information about the SEQR process visit the NYS DEC website atwww.dec.gov.ny/permits/357.html


Last April I fought with the Town unsuccessfully to have stockpiles of asphalt millings removed from the Town yard at Middle Patent Road, an area which is in close proximity to State regulated wetlands. The Middle Patent yard is boarded by the Mianus River watercourse which has tributaries that lead into the Mianus Gorge, which in turn provides drinking water to certain areas of Connecticut.  Also, the yard is located in close proximity to the wells that provide drinking water to the residents of Windmill. Is our town acting environmentally responsible? Does it fully understand the potential problems we face as taxpayers without going through the SEQR process?


I plan on attending tomorrow night’s Town Board meeting to discuss these issues.  The meeting will be held at the North White Plains Community Center, 10 Clove Road, North White Plains, New York 10603 at 7:30 pm.


Sincerely,


Michael Fareri


July 3, 2015


Supervisor Michael J. Schiliro & Members of the Town Board

Town of North Castle

Town Hall

15 Bedford Road

Armonk, New York 10504


Re: Town Dump


Dear Supervisor Schiliro & Members of the Town Board:

It is with great displeasure that once again I have to report to you the foolish and irresponsible actions undertaken by the Town Administrator and the Towns Highway General Forman. After all the weeks of aggravation I was put through last April in an effort to have the stockpile of asphalt millings removed from the Towns property across from my office building at 333 Main Street, approximately 4000 cubic yards of milling were once again delivered to the Towns property and stockpiled.
I spoke to the Town Attorney and the Town Engineer and they assured me that they knew nothing about this situation and I believe them because surely, they would not allow the Town to be exposed to such a potentially damaging liability.  As I stated on numerous occasions in the past, not only is this aesthetically unpleasing where located, the stockpiling of asphalt millings has the potential to pose human health and environmental concerns (see links & photos below).  Asphalt millings, also known as RAP (Recycled Asphalt Paving) contain a high concentration of Polycyclic Aromatic Hydocarbons (PAHs) which are compounds specified as pollutants by the U.S. Environmental Protection Agency (USEPA).  When rainfall or wind infiltrate these stockpiles, especially in the condition they are in which is one without any form of protection whatsoever, they will leach off contaminates into the soil and from there a potential migration of contaminates into our water supply.
 Has everyone already forgotten Westwood and the $500,000 cost to the taxpayer? Trust me, the stockpiling of these millings could bring about even greater environmental problems.  That is why I am demanding that you have these millings removed from Town property immediately.  If they are not removed immediately I will take whatever legal action necessary to see that it is done while holding this Town Board, the Highway Department and the Town Administrator responsible and accountable. 

 Sincerely,


Michael E. Fareri

Click on the link below, or copy and paste the URL link into your web browser address box


All About Armonk – Read Michelle Boyle’s article regarding Fareri’s letter and the stockpiling of millings

http://allaboutarmonk.com/ 


Leaching Characteristics of Asphalt Road Waste by Timothy G Townsend, June 1998

http://www.beyondroads.com/visual_assets/RAP_Leachability_Study.PDF


Asphalt Pavements and the Environment by Dr. Gerhard J.A. Kennepohl, P.Eng.

http://asphalt.org/downloads/2008-Pavt-Environment-GJAK.pdf


Life Cycle Environmental and Economic Assessment of Using Recycled Materials for Asphalt Pavements by Arpad Horvath

http://www.uctc.net/papers/683.pdf


 Recycled Asphalt Pavement and Asphalt Millings (RAP) Reuse Guide by NJDEP

http://www.nj.gov/dep/dshw/rrtp/asphaltguidance.pdf

Middle Patent Yard
Mianus Watercourse
Highway Dept. Property


Is this a home buyer, seller or #flipper market? | Armonk Real Estate

Pending home sales rose 3.4% in April to the highest level since May 2006. The home builder sentiment bounced back after dipping in March and housing starts jumped 20% in April from March. Home prices also rose more than expected in March; the S&P/Case-Shiller index gained 5% year-over-year in 20 cities.

Housing’s brightening outlook is welcome news, not just for homeowners but also for home flippers, said Nav Athwal, the CEO of Realty Shares, an online real estate investment marketplace. “Markets like Tampa, Miami, Jacksonville and Orlando present opportunities in terms of both available supply for flipping and also large returns…and we’ll see this trend continue,” said Athwal.

According to RealtyTrac, 4% of all single family home sales in this country in the first quarter were flips. Florida dominated the list for top markets for home flipping. But when it came to making a profit, flippers in the Baltimore area saw a whopping 94% return. “Markets like Baltimore have less supply, thus profit margins push up. Another similar market is Memphis, there’s not a lot of supply in the market, so the home flippers that successfully acquire the supply are better able to flip a profit better,” said Athwal.

But with home price appreciation slowing, is this a better time for buy-and-hold investors than flippers? Athwal pointed back to the old adage that what matters most in real estate is location. “The strategy that’s going to lead to the most success, profit, depends on what city, what zip code you’re focused on,” he said. “If you look at markets like Florida and Detroit, because there’s still ability to buy ‘right’, which is key to a successful flip, they’re great markets for flipping but if you turn to other markets, where profit potential for flips isn’t as high but where you can buy a house for cheap and rent it for $1,000, $1,500 and get a double-digit yield, then you have to turn to a buy and hold strategy.”

This formula for flipping makes Florida unique in Athwal’s assessment. “In markets like Tampa, Jacksonville, you can be successful both with the ‘buy and hold’ as well as the flip strategies but it’s really going to depend on the market’s economics to determine what the best strategy is there,” he said.


read more…


http://finance.yahoo.com/news/is-this-a-home-buyer–seller-or-flipper-market–160145337.html


Nearly 80 Percent of Top 100 U.S. Housing Markets Improving | #Armonk Real Estate

Freddie Mac today released its updated Multi-Indicator Market Index® (MiMi®) showing the U.S. housing market continuing to stabilize with the most improving metro markets seeing stronger demand for home sales this spring homebuying season. Despite strong house price appreciation, low mortgage rates are keeping payment-to-incomes affordable for the typical family in most markets.

News Facts:

  • The national MiMi value stands at 75.4, indicating a weak housing market overall but showing an improvement (+0.69%) from February to March and a three-month improvement of (+1.24%). On a year-over-year basis, the national MiMi value has improved (+3.11%). The nation’s all-time MiMi high of 121.7 was April 2006; its low was 57.4 in October 2010, when the housing market was at its weakest. Since that time, the national MiMi value has made a 31.3 percent rebound.
  • Seventeen of the 50 states plus the District of Columbia have MiMi values in a stable range, with North Dakota (95.8), the District of Columbia (95.6), Hawaii (90.5), Montana (90), and Wyoming (85.7) ranking in the top five.
  • Twenty-five of the 100 metro areas have MiMi values in a stable range, with Honolulu (91.8), Fresno (90.5), Austin (88.8), Los Angeles (86.8) and McAllen, TX (86.4) ranking in the top five.
  • The most improving states month-over-month were Washington (+2.37%), Oregon (+2.26%), Arizona (+1.76%), Tennessee (+1.39%) and Michigan (+1.26%). On a year-over-year basis, the most improving states were Nevada (+9.87%), Oregon (+9.86%), Colorado (9.34%), Florida (+8.23%), and Michigan (+7.60%).
  • The most improving metro areas month-over-month were Portland (+2.68%), Riverside (+2.22%), San Jose (+2.13%), Nashville (+2.10%) and Baton Rouge (+1.99%). On a year-over-year basis, the most improving metro areas were Stockton (+12.01%), Detroit (+11.63%), Denver (+11.41%), Las Vegas (+10.73%), and Palm Bay, FL (+10.23%).
  • In March, 36 of the 50 states and 77 of the 100 metros were showing an improving three month trend. The same time last year, 40 states plus the District of Columbia, and 82 of the top 100 metro areas were showing an improving three-month trend.

Quote attributable to Freddie Mac Deputy Chief Economist Len Kiefer:

“The nation’s housing markets are getting back on track. Better employment prospects, rising home values and increased purchase activity are all driving improvements in housing markets across the country. In this month’s MiMi three more states and seven metro areas moved within range of their benchmark level of activity. However, as we’ve mentioned before, we’re likely to see bouts of affordability shock with mortgage rate swings for the remainder of this year as market participants try to anticipate Fed timing around rising short term interest rates and expectations for global growth wax and wane.”

“The West and Southwest areas of the country are showing some of the strongest housing activity, especially markets like Portland, Denver, Dallas, San Jose and Los Angeles. Many markets in the South and Midwest, while improving, are still plagued by high rates of mortgage delinquencies, which are holding back these markets from recovering faster. The exception to this would be the Nashville-area market. It more closely resembles the housing markets in the West, such as those in Utah. These markets are experiencing double-digit annual growth rates in purchase applications and showing some of the strongest homebuying demand in the country.”

The 2015 MiMi release calendar is available online.

MiMi monitors and measures the stability of the nation’s housing market, as well as the housing markets of all 50 states, the District of Columbia, and the top 100 metro markets. MiMi combines proprietary Freddie Mac data with current local market data to assess where each single-family housing market is relative to its own long-term stable range by looking at home purchase applications, payment-to-income ratios (changes in home purchasing power based on house prices, mortgage rates and household income), proportion of on-time mortgage payments in each market, and the local employment picture. The four indicators are combined to create a composite MiMi value for each market. Monthly, MiMi uses this data to show, at a glance, where each market stands relative to its own stable range of housing activity. MiMi also indicates how each market is trending, whether it is moving closer to, or further away from, its stable range. A market can fall outside its stable range by being too weak to generate enough demand for a well-balanced housing market or by overheating to an unsustainable level of activity.

Recent Homeownership Developments in the U.K. | Armonk Real Estate

Declines in homeownership rates are not just a concern in the U.S. In fact, homeownership declines in the U.K. have been relatively larger for younger households than the impacts experienced here.

In the U.S., the homeownership rate for 25 to 34 year olds fell from 42.2% at the end of 2003 to 35.8% at the end of 2014, according to data from the Census Bureau’s Current Population Survey/Housing Vacancy Survey.  In the UK, homeownership declines have been even more dramatic. Among households aged 25 to 34, the homeownership rate fell from 59% in 2003 to 36% in 2014 according to the data reported in the Economist magazine.

For the population as a whole, the U.S. homeownership rate declined from 68.3% in 2003 to 64.5% in 2014. Again, the decline in the UK for the total population has been more significant. According to The Economist, the U.K. homeownership rate has fallen from a peak of 71% in 2003 to 63% in 2014.

Consequently, for the first time in the U.K., a larger share of households owned their homes mortgage-free (33%) compared to those holding a mortgage (31%). In the U.S., approximately 20% of total households (approximately one-third of homeowners) own their homes free-and-clear of a mortgage.

In the U.S., tight credit requirements continue to make obtaining a mortgage difficult for first-time buyers. In the U.K., the challenge for first-time buyers has generated an ambitious plan to build cut-price “starter homes.”And the British government has proposed a tax benefit linked to saving for a downpayment on certain home purchases. Under the proposal, the government will match monthly savings for a first-time home purchase by 25%, up to 3,000 pounds of tax benefits.  The bonus will be available on home purchases of up to 450,000 pounds in London and up to 250,000 pounds outside of London. The consensus to date is that there has been little impact so far from these help-to-buy plans for first-time buyers.

It is also worth noting that the U.K. phased out its version of the mortgage interest deduction over a number of years, ending in 2000.

However, it is always important to remember that international comparisons of housing variables, like homeownership, are made difficult by not just differences in tax and finance policy, but also more fundamental differences in demographics, property law, and even cultural preferences.


read more…


http://eyeonhousing.org/2015/04/recent-homeownership-developments-in-the-u-k/