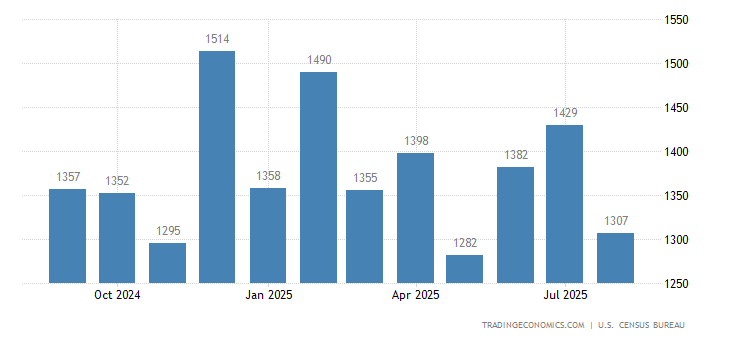
Housing starts in the United States jumped 3.2 percent from a month earlier to an annualized rate of 1,256 thousand in November of 2018, beating market forecasts of a 0.2 percent drop. Starts went up in the Northeast and the South but slumped in the Midwest and the West. Housing Starts in the United States averaged 1432.19 Thousand units from 1959 until 2018, reaching an all time high of 2494 Thousand units in January of 1972 and a record low of 478 Thousand units in April of 2009.

| Calendar | GMT | Actual | Previous | Consensus | TEForecast | |||
|---|---|---|---|---|---|---|---|---|
| 2018-09-19 | 12:30 PM | Housing Starts | 1.282M | 1.174M | 1.235M | 1.171M | ||
| 2018-10-17 | 12:30 PM | Housing Starts | 1.201M | 1.268M | 1.22M | 1.25M | ||
| 2018-11-20 | 01:30 PM | Housing Starts | 1.228M | 1.21M | 1.23M | 1.22M | ||
| 2018-12-18 | 01:30 PM | Housing Starts | 1.256M | 1.217M | 1.225M | 1.22M | ||
| 2019-01-17 | 01:30 PM | Housing Starts | 1.256M | 1330 | ||||
| 2019-02-20 | 01:30 PM | Housing Starts | ||||||
| 2019-03-19 | 12:30 PM | Housing Starts | ||||||
US Housing Starts Beat Forecasts
Housing starts in the United States jumped 3.2 percent from a month earlier to an annualized rate of 1,256 thousand in October of 2018, beating market forecasts of a 0.2 percent drop. Starts went up in the Northeast and the South but slumped in the Midwest and the West.
Starts for the volatile multi-family housing segment jumped 24.9 percent to a rate of 417 thousand. On the other hand, single-family homebuilding, which accounts for the largest share of the housing market, went down 4.6 percent to a rate of 824 thousand units, the third straight monthly fall and the the lowest level since May 2017. Starts increased in the South (15.1 percent to 687 thousand) and the Northeast (37.8 percent to 134 thousand) but fell in the West (-14.2 percent to 289 thousand) and the Midwest (-19.2 percent to 156 thousand). Starts for October were revised to 1,217 thousand from 1,228 thousand.
Building permits rose 5 percent from the previous month to a seasonally adjusted annual rate of 1,328 thousand, compared to market expectations of a 0.4 percent fall. Single-family authorizations edged up 0.1 percent to 848 thousand and multi-family permits advanced 14.8 percent to 480 thousand. Across regions, permits went up in the South (10.5 percent to 708 thousand) and the West (1.6 percent to 323 thousand) while in the Northeast permits were unchanged (at 120 thousand) and in the Midwest dropped (-4.8 percent to 177 thousand).
Year-on-year, housing starts fell 3.6 percent and building permits edged up 0.4 percent.
read more…
https://tradingeconomics.com/united-states/housing-starts
