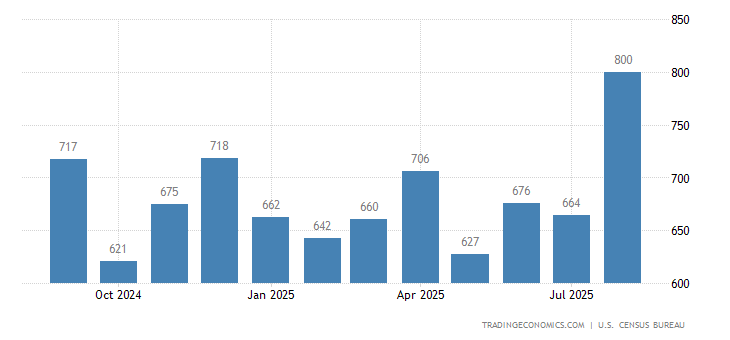
Sales of new single-family houses in the United States dropped 5.5 percent from the previous month to a seasonally adjusted annual rate of 553 thousand in September of 2018, following a downwardly revised 3.0 percent decline in August. August. It is the lowest rate since December 2016, worse than market expectations of 625 thousand. Sales in the Northeast went down to its lowest level since April 2015. Also, sales decreased in the West and in the South. New Home Sales in the United States averaged 650.36 Thousand from 1963 until 2018, reaching an all time high of 1389 Thousand in July of 2005 and a record low of 270 Thousand in February of 2011.

US New Home Sales Lowest Since 2016
Sales of new single-family houses in the United States dropped 5.5 percent from the previous month to a seasonally adjusted annual rate of 553 thousand in September of 2018, following a downwardly revised 3.0 percent decline in August. It is the lowest rate since December 2016, worse than market expectations of 625 thousand. Sales in the Northeast went down to its lowest level since April 2015. Also, sales decreased in the West and in the South.
Sales declined in the Northeast (-40.6 percent to 19 thousand), its lowest level since April 2015; the West (-12 percent to 139 thousand) and in the South (-1.5 percent to 318 thousand). On the other hand, sales rose 6.9 percent to 77 in the Midwest.
The median sales price of new houses sold was USD 320,000 below USD 331,500 in the same month of the previous year. The average sales price fell to USD 377,200 in September from USD 379,300 a year ago.
The stock of new houses for sale went up 2.8 percent to 327 thousand. This represents a supply of 7.1 months at the current sales rate, up from 6.5 months in August.
Year-on-year, new home sales decreased 13.2 percent.
read more…
