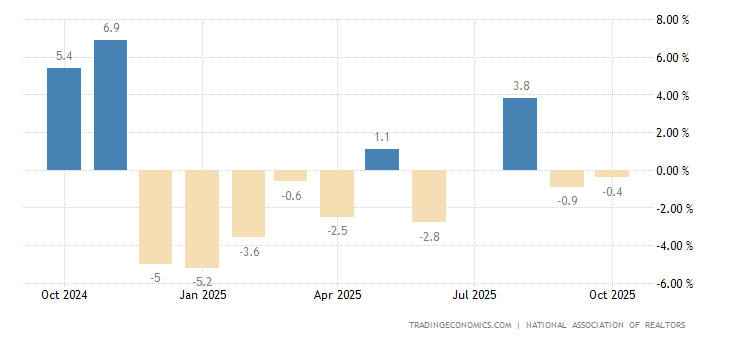
Contracts to buy previously owned homes in the United States shrank 4.1 percent year-on-year in February of 2018, following an upwardly revised 4 percent drop in January. It is the biggest decline since June of 2014 as contracts fell in all main regions: Northeast (-5.1 percent), Midwest (-9.5 percent), South (-1.5 percent) and the West (-2.2 percent). Compared to the previous month, pending home sales increased 3.1 percent, rebounding from an upwardly revised 5 percent fall in January and beating forecasts of a 2.1 percent gain. Pending Home Sales in the United States averaged 1.03 percent from 2002 until 2018, reaching an all time high of 30.90 percent in October of 2009 and a record low of -24.30 percent in April of 2011.
| Calendar | GMT | Actual | Previous | Consensus | TEForecast | |
|---|---|---|---|---|---|---|
| 2018-01-31 | 03:00 PM | Pending Home Sales YoY | 0.5% | 0.8% | -0.2% | -0.3% |
| 2018-02-28 | 03:00 PM | Pending Home Sales YoY | -3.8% | 0.4% | 0.4% | |
| 2018-03-28 | 02:00 PM | Pending Home Sales YoY | -4.1% | -4% | -0.2% | 0.5% |
| 2018-04-30 | 02:00 PM | Pending Home Sales YoY | -4.1% | -2.11% | ||
| 2018-05-31 | 02:00 PM | Pending Home Sales YoY | -1.60% | |||
| 2018-06-27 | 02:00 PM | Pending Home Sales YoY | -1.35% |
read more…
https://tradingeconomics.com/united-states/pending-home-sales#alerts

