Category Archives: Westchester NY

Low Mortgage Rates Sustain Improving Housing Markets | Chappaqua Real Estate

Freddie Mac released its Multi-Indicator Market Index® (MiMi®), showing two additional metro areas — Indianapolis, Indiana, and Columbus, Ohio — entering their historic benchmark levels of housing activity.

The national MiMi value stands at 85.1, largely unchanged from last month, indicating a housing market that’s on the outer range of its historic benchmark level of housing activity with a +0.14 percent improvement from June to July and a three-month improvement of +1.24 percent. On a year-over-year basis, the national MiMi value improved +4.70 percent. Since its all-time low in October 2010, the national MiMi has rebounded 43 percent, but remains significantly off its high of 121.7.

News Facts:

  • Thirty-eight of the 50 states plus the District of Columbia have MiMi values within range of their benchmark averages, with Utah (97.5), Hawaii (96.6), Montana (96.5), Colorado (96) and Oregon (95.8) ranking in the top five with scores closest to their historical benchmark index levels of 100.
  • Seventy-nine of the 100 metro areas have MiMi values within range, with Los Angeles, CA (99.5), Salt Lake City, UT (100.6), Provo, UT (98.9), Honolulu, HI (98.7) and Nashville, TN (101.6) ranking in the top five with scores closest to their historical benchmark index levels of 100.
  • The most improving states month over month were Illinois (+1.72%), Nevada (+1.36%), Florida (+1.20%), Alabama (+1.14%) and South Carolina (+1.00%). On a year-over-year basis, the most improving states were Florida (+10.03%), Oregon (+9.49%), Colorado (+9.09%), New Jersey (+8.64%) and Tennessee (+8.54%).
  • The most improving metro areas month over month were Lakeland, FL (+2.13%), Youngstown, OH (+1.92%), Chicago, IL (+1.73%), Orlando, FL (+1.63%) and Las Vegas, NV (+1.61%). On a year-over-year basis, the most improving metro areas were Orlando, FL (+16.20%), Tampa, FL (+13.03%), Lakeland, FL (+13.02%), Chattanooga, TN (+12.89%) and Palm Bay, FL (+12.47).
  • In July, 32 of the 50 states and 75 of the top 100 metros were showing an improving three-month trend. The same time last year, all 50 states and the top 100 metro areas were showing an improving three-month trend.

Quote attributable to Freddie Mac Deputy Chief Economist Len Kiefer:

“Nationally, MiMi in July was largely unchanged for the third consecutive month at 85.1, yet marking a 4.7 percent year-over-year increase. Despite rising house prices, the majority of housing markets have sustained their momentum due in large part to low mortgage rates. For example, purchase applications, as measured by MiMi, were up more than 17 percent year over year in July and remaining at their highest level since December 2007.”

The 2016 MiMi release calendar is available online.

MiMi monitors and measures the stability of the nation’s housing market, as well as the housing markets of all 50 states, the District of Columbia, and the top 100 metro markets. MiMi combines proprietary Freddie Mac data with current local market data to assess where each single-family housing market is relative to its own long-term stable range by looking at home purchase applications, payment-to-income ratios (changes in home purchasing power based on house prices, mortgage rates and household income), proportion of on-time mortgage payments in each market, and the local employment picture. The four indicators are combined to create a composite MiMi value for each market. Monthly, MiMi uses this data to show, at a glance, where each market stands relative to its own stable range of housing activity. MiMi also indicates how each market is trending, whether it is moving closer to, or further away from, its stable range. A market can fall outside its stable range by being too weak to generate enough demand for a well-balanced housing market or by overheating to an unsustainable level of activity.

Mortgage rates average 3.52% | Waccabuc Real Estate

Freddie Mac (OTCQB: FMCC) today released the results of its Primary Mortgage Market Survey® (PMMS®), showing average fixed mortgage rates moving higher for the second week in a row and marking the first time the 30-year fixed-rate mortgage has risen above 3.5 percent since June.

News Facts

  • 30-year fixed-rate mortgage (FRM) averaged 3.52 percent with an average 0.5 point for the week ending October 20, 2016, up from last week when they averaged 3.47 percent. A year ago at this time, the 30-year FRM averaged 3.79 percent.
  • 15-year FRM this week averaged 2.79 percent with an average 0.5 point, up from last week when they averaged 2.76 percent. A year ago at this time, the 15-year FRM averaged 2.98 percent.
  • 5-year Treasury-indexed hybrid adjustable-rate mortgage (ARM) averaged 2.85 percent this week with an average 0.4 point, up from last week when it averaged 2.82 percent. A year ago, the 5-year ARM averaged 2.89 percent.

Average commitment rates should be reported along with average fees and points to reflect the total upfront cost of obtaining the mortgage. Visit the following link for the Definitions. Borrowers may still pay closing costs which are not included in the survey.

Quote
Attributed to Sean Becketti, chief economist, Freddie Mac.

“The 30-year fixed-rate mortgage moved a solid 5 basis points to 3.52 percent while the 10-year Treasury yield remained relatively flat. This is the first week in over 4 months that rates have risen above 3.50 percent. This month, mortgage rates seem to be catching up to Treasury yields and returning to pre-Brexit levels.”

Shortage of appraisers causing home sales delays | Mt Kisco Real Estate

Housing demand is rising rapidly, but a key cog in the wheel to homeownership is in deep trouble. The people most needed to close the deal are disappearing. Appraisers, the men and women who value homes and whom mortgage lenders depend upon, are shrinking in numbers. Learn about the value of your property with a palm beach county property appraiser to ensure you get money’s worth.

That is causing growing delays in closings, costing buyers and sellers money and in some cases even scuttling deals.

The share of on-time closings has dropped from 77 percent last April to 64 percent today for loans backed by Fannie Mae and Freddie Mac, according to Campbell/Inside Mortgage Finance. Appraisal-related issues in these delays jumped by 50 percent in that time.

“The appraisal shortage is massive. You’re seeing significant delays, you’re seeing cost increases, you’re seeing rate [locks] expire,” said Brian Coester, CEO of Rockville, Maryland-based CoesterVMS, a national appraisal management company.

Since 2007, when the U.S. housing market came crashing down, the number of appraisers has shrunk by 22 percent, according to the Appraisal Institute, an industry association. With so few new cadets, the current population of appraisers is aging. More than 60 percent are over the age of 50.

Ironically, the decline in new appraisers is largely due to new regulations designed to safeguard both banks and borrowers. They were put in place at the end of 2008 by Fannie Mae, Freddie Mac and the FHA, as the entire mortgage banking community was under strict scrutiny after the financial crisis. They changed the rules that would allow appraiser apprentices to do full appraisals and instead require the licensed appraiser to be on-site for the inspection.

The result is that appraisers no longer see a need to pay apprentices, but at the same time, licensing requirements to become an appraiser include 2,500 hours of appraisal experience to be completed in two years as an apprentice.

“The typical appraiser, he’s going to do approximately 10-15 appraisals a week. For him to be able to take a trainee, he needs the ability for the trainee to go ahead and inspect the property for him,” said Coester. “The rules have changed now, and you cannot do what you used to be able to do 10 years ago, which is hire three to four trainees and really have them go and inspect the properties, go and do work for you and really function as an apprentice. That market has been completely eliminated.”

At 1 p.m. on a Monday in Frederick, Maryland, appraiser Joyce Smith has already valued three homes and is walking into the fourth. A 23-year veteran of the business, she said she has never been this busy.

“I get calls five, six, seven, eight times a day. I used to go far away to do appraisals, but there are so many, I don’t have to go very far anymore,” said Smith.

In some of the nation’s hottest housing markets, where sales are up double digits compared to a year ago, the shortage means searching far and wide for an appraiser.

“We’ve been hearing from our agents in Colorado about significant delays in getting appraisals done,” said Alina Ptaszynski, a spokesperson for Redfin. “Our Denver market manager said for one deal, the appraiser came in from Cheyenne, Wyoming. She reported it taking up to seven weeks to get an appraisal done. Valuations aren’t the concern as much as the delays.”

Valuations are, however, becoming increasingly important, as home price gains accelerate, and competition in the market heats up. Prices could change in the course of two months, the delay time it is now taking in some markets to have an appraisal done. Mortgage rates are also starting to move in a wider range, and that makes rate-locks ever more important. It can cost significant cash to extend a rate lock.

read more…

http://www.cnbc.com/2016/09/27/massive-shortage-in-appraisers-causing-home-sales-delays.html?__source=newsletter%7Ceveningbrief

September Housing Starts Decline on Multifamily Weakness | North Salem Real Estate

The September pace of total housing starts decreased 9% due a substantial decline in multifamily production. Single-family construction continues, as expected, along a positive trend.

According to estimates from the Census Bureau and the Department of Housing and Urban Development, single-family starts increased 8.1% to a 783,000 seasonally adjusted annual rate in September. Year-to-date, single-family housing starts are running almost 10% higher than the year-to-date total for September of 2015.

Single-family permit growth points to additional growth. On a year-to-date basis, single-family permits from January to September of 2016 are more than 8% higher than this time in 2015.

Multifamily starts (units in 2+ properties) posted a large decline in September after a few months of strength. Apartment construction starts declined 38% in September to a seasonally adjusted annual rate of 264,000. Multifamily permits on a year-to-date basis are about 11% lower than this time in 2015.

Taken together, these trends are consistent with the NAHB forecast, which sees gathering strength for single-family construction and a leveling off of multifamily production as the market finds a balance between housing demand and supply.

sf-starts

Regionally, single-family starts showed strength in the Northeast, increasing 20%% on a monthly basis. Gains for single-family starts were also realized in the South (12%) and Midwest (6%). The West posted a slight drop of 2% after a strong August.

On a year-to-date basis, however, all regions have posted gains. Single-family starts are up 12% in the Northeast, 12% in the Midwest, 8% in the South and 6% in the West when comparing the September 2016 year-to-date total relative to the comparable September 2015 year-to-date totals.

construction

Taking the long view, an examination of the count of homes currently under construction provides the degree of market mix and momentum of the recovery in home construction. As of September, 58% of units under construction in the nation were multifamily (605,000). The count of 605,000 is a 13% gain over a year earlier.


read more…


http://eyeonhousing.org/2016/10/september-housing-starts-decline-on-multifamily-weakness/

National Home Prices Re-accelerated | South Salem Real Estate

S&P Dow Jones Indices released the Case-Shiller (CS) National Home Price Index for July. The index rose at a seasonally adjusted annual growth rate of 5.0%, faster than the 2.1% in June. House prices have decelerated since the beginning of 2016 due to the sharp decline in existing home sales at the end of 2015. But, home prices started to accelerate in May and home price appreciation increased to 5.0% in July.

The Home Price Index from the Federal Housing Finance Agency (FHFA) rose at a seasonally adjusted annual rate of 5.8% in July, following 3.4% in June, confirming the reacceleration in home prices.

figure1_jul16

However, local housing markets varied greatly. Figure 2 shows home price appreciation for 20 major U.S. metropolitan areas in July.

Twelve out of the 20 metro areas had positive home price appreciation. The highest one in the list was Portland, OR with an annual rate of 8.2%, followed by Denver with an annual rate of 6.6%. Phoenix placed third with an annual rate of 5.9%.

Home price appreciation in the remaining eight metro areas was negative. They are San Francisco, Washington, DC, Atlanta, Chicago, Boston, Detroit, Minneapolis, and New York. Home price appreciation in Chicago was -5.9%, the lowest among 20 metro areas.

figure2_jul16


read more…


http://eyeonhousing.org/2016/09/national-home-prices-reaccelerated-local-home-prices-varied-in-july/

Mortgage rates at 3.47% | South Salem Real Estate

Oct 13, 2016) – Freddie Mac (OTCQB: FMCC) today released the results of its Primary Mortgage Market Survey® (PMMS®), showing average fixed mortgage rates following Treasury yields and moving higher.

News Facts

  • 30-year fixed-rate mortgage (FRM) averaged 3.47 percent with an average 0.6 point for the week ending October 13, 2016, up from last week when they averaged 3.42 percent. A year ago at this time, the 30-year FRM averaged 3.82 percent.
  • 15-year FRM this week averaged 2.76 percent with an average 0.6 point, up from last week when they averaged 2.72 percent. A year ago at this time, the 15-year FRM averaged 3.03 percent.
  • 5-year Treasury-indexed hybrid adjustable-rate mortgage (ARM) averaged 2.82 percent this week with an average 0.4 point, up from last week when it averaged 2.80 percent. A year ago, the 5-year ARM averaged 2.88 percent.

Average commitment rates should be reported along with average fees and points to reflect the total upfront cost of obtaining the mortgage. Visit the following link for the Definitions. Borrowers may still pay closing costs which are not included in the survey.

Quote
Attributed to Sean Becketti, chief economist, Freddie Mac.

“This week the 10-year Treasury yield continued its climb as an increasing number of financial market participants foresee a December rate hike after a series of positive economic data releases. The 30-year fixed-rate mortgage moved up 5 basis points to 3.47 percent in this week’s survey, the first increase in one month. Even though we’ve seen economic activity pick up, consumer price inflation and implied inflation expectations remain below the Federal Reserve’s 2 percent target.”

Builder Confidence Surges in September | Chappaqua Real Estate

Builder confidence in the market for newly built, single-family homes in September jumped six points to 65 from a downwardly revised August reading of 59 on the National Association of Home Builders/Wells Fargo Housing Market Index (HMI). This marks the highest HMI level since October 2015.

With the inventory of new and existing homes remaining tight, builders are confident of positive market conditions for new construction. Solid job creation and low interest rates are also fueling demand, while builders continue to be hampered by supply-side constraints that include shortages of labor and building lots.

hmi-sept

As household incomes rise, builders in many markets across the nation are reporting they are seeing more serious buyers, a positive sign that the housing market continues to move forward. The single-family market continues to make gradual gains and we expect this upward momentum will build throughout the remainder of the year and into 2017.

Derived from a monthly survey that NAHB has been conducting for 30 years, the NAHB/Wells Fargo Housing Market Index gauges builder perceptions of current single-family home sales and sales expectations for the next six months as “good,” “fair” or “poor.” The survey also asks builders to rate traffic of prospective buyers as “high to very high,” “average” or “low to very low.” Scores for each component are then used to calculate a seasonally adjusted index where any number over 50 indicates that more builders view conditions as good than poor.


read more…


http://eyeonhousing.org/2016/09/builder-confidence-surges-in-september/

House Prices to Median Household Income | Armonk Real Estate

The Census Bureau released the Income, Poverty and Health Insurance Coverage in the United States: 2015 this morning. The report showed a significant increase in the real median household income and a decline in poverty.  For an overview, see from Nick Timiraos and Janet Adamy at the WSJ: U.S. Household Incomes Surged 5.2% in 2015, First Gain Since 2007 and from Jason Furman, Sandra Black, and Matt Fiedler at the CEA: Income, Poverty, and Health Insurance in the United States in 2015

One of the metrics to follow is a ratio of house prices to incomes.   The following graphs use annual averages of house prices indexes – Case-Shiller and CoreLogic – and the nominal median household income (and the mean for the fourth fifth income) through 2015.

Note: Most reporting today is on the REAL median household income (adjusted for inflation over time).  These graphs use nominal income since we are comparing to nominal house prices.

House Prices and Median Household IncomeClick on graph for larger image.

This graph shows the ratio of house price indexes divided by the Median Household Income through 2015 (the HPI is first multiplied by 1000).

This uses the annual average CoreLogic and the National Case-Shiller index since 1976.

As of 2015, house prices were above the median historical ratio – but far below the bubble peak.

The second graph is similar but uses the mean of the fourth fifth household income (if we separate households into fifths, this is the second highest income group).

House Prices and WagesThese are key households since they are more likely to be homeowners (and home buyers).

Using this group, prices are well below the bubble peak.

Going forward, I think it would be a positive if incomes outpaced house prices, or at least kept pace with house prices increases for a few years.


read more…


http://www.calculatedriskblog.com/

Growing number of firms offering energy-efficient modular design | North Salem Real Estate

The Alfreds' net-zero residence, in Cumberland, Maine, is a modular design by BrightBuilt Home.
James R. SalomonThe Alfreds’ net-zero residence, in Cumberland, Maine, is a modular design by BrightBuilt Home.

When Shaun Alfreds and his wife decided to build a house for their family of five in Cumberland, Maine, they didn’t know if a high-performance project would be within their budget. “We aren’t wealthy by any stretch of the imagination, but we wanted an energy-efficient home,” says Alfreds, a chief operating officer at HealthInfoNet, a local health information technology company.

After some research, however, the couple realized that they achieve their dream for a nominal additional investment over the cost of a conventional house if they opted for a modular high-performance house. They chose a two-story, Cape Cod–style design from Portland, Maine–based BrightBuilt Home, and moved in last December.

At more than 3,000 square feet, the house is spacious, but its full sun exposure and a 10-kilowatt solar array of 39 photovoltaic (PV) panels should cover its energy consumption year-round. Alfreds says the house cost “almost exactly what other [builders] were bidding” for a standard, code-compliant project that was custom designed. And their small additional investment goes to building equity in the house, rather than to paying utilities.

BrightBuilt, a sister company of local firm Kaplan Thomson Architects (KTA), joins an increasing number of design companies that are expanding the market for high-performance residential projects. While KTA has custom-designed many energy-efficient houses, principal Phil Kaplan, AIA, says the firm also wanted to offer an off-the-shelf product. In 2015, it launched BrightBuilt with nine design templates. Starting at $175 to $180 per square foot, the houses bring net-zero energy to a price more people can afford. “We’re definitely seeing a lot of demand,” Kaplan says.

But some architects and builders have found ways to lower the price of net-zero housing even more.

De Verneil residence, by Deltec Homes (Ridgeline model)
Marie de VerneilDe Verneil residence, by Deltec Homes (Ridgeline model)

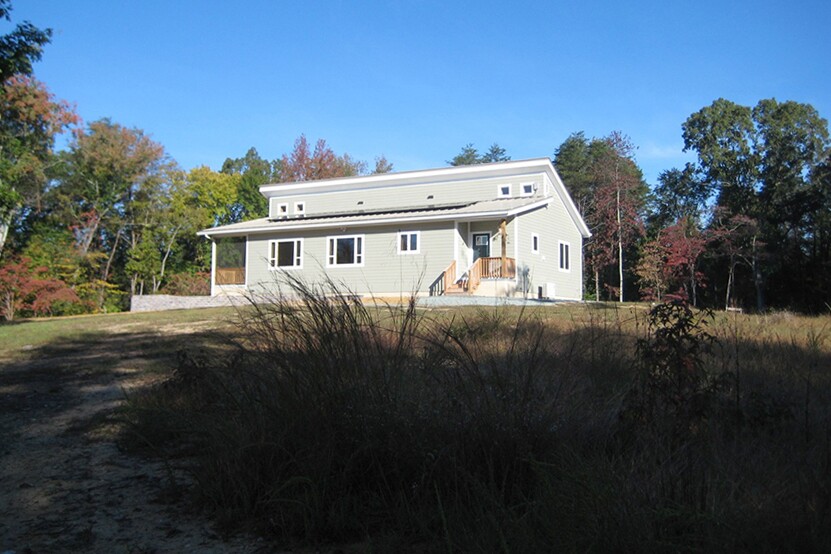
Marie de Verneil dreamed of building a retirement home on land she owned in central Virginia. “To me, green was very important,” she says. However, her savings from teaching French and international relations at the University of Maryland, Baltimore County, didn’t seem like enough. “It’s kind of discouraging for someone like me,” she says.

Kitchen, de Verneil residence
Marie de VerneilKitchen, de Verneil residence

Then de Verneil heard about Deltec Homes, in Asheville, N.C. The company—known for its distinctly round, prefabricated, and hurricane-resistant houses—recently launched Renew, a collection of models that use about two-thirds the energy of a conventional house and can include a PV array. De Verneil estimates she spent $250,000 on her 1,600-square-foot house (less than $160 per square foot), which includes a roof-mounted solar array. Her monthly electric bill is $30, the base fee for taxes and distribution. And when she is retired and living on a fixed income, she knows she’ll never have to say, “I can’t put the heat on.”

For those wanting to build a passive or net-zero energy house, right-sizing expectations is a crucial step to meeting one’s budget. And, as Deltec president Steve Linton adds, every project—modular or not—must be tailored to the particular site and climate. The company’s design team also conducts an energy model to evaluate site variables, solar energy capacity, building-shell size, features, and cost trade-offs.

Much of the market for high-performance housing is around single-family units in the suburbs, but the past few years have seen an uptick for multifamily dwellings and affordable housing projects in cities, including Washington, D.C., New York, and Philadelphia.

For low- and middle-income residents, in particular, an energy-efficient house can provide substantial benefits, says Orlando Velez, director of Housing Programs and Community at Habitat for Humanity of Washington, D.C.The organization recently built six passive townhouses last year in the district’s Ivy City neighborhood, whichhas a lot of air pollution. By creating a tight building envelope and filtering outside air, “you’re improving the air quality significantly,” Velez says. “It’s a healthier living environment.”

With savings from the lower utility bills, he says, residents may be able to spend more within the community. The organization plans to study those benefits over time to know whether energy efficiency is the best investment for its limited funds.

Ridgeline model in Deltec Homes' Renew Collection
Spacialists.com courtesy Deltec HomesRidgeline model in Deltec Homes’ Renew Collection
Interior rendering, Ridgeline model
Courtesy Deltec HomesInterior rendering, Ridgeline model

Living in a high-performance house can take some adjustment. Residents are often unfamiliar with high-tech HVAC equipment, such as energy recovery ventilators and solar water heaters. A tight building envelope also means that the size of the HVAC system can be decreased (fresh air supply is increased for indoor air quality purposes). The word that many residents use is “comfort”—indoor temperatures stay remarkably consistent across different areas of a house throughout the year.


read more…


http://www.architectmagazine.com/technology/living-the-dream-of-a-net-zero-house_o

‘Zombie’ foreclosures decline across the country | Cross River Real Estate

As the foreclosure crisis recedes, some unwanted consequences continue to haunt neighborhoods around the country.

“Zombie” foreclosures — those properties that are currently in the foreclosure process but vacant — fell again in the third quarter, according to Attom Data Solutions. Zombies made up 4.7% of all foreclosures, down 9% from a year ago.

Among the top ten states for zombies, there have been some big declines: zombies are down 28% in Florida, 26% in California, and 14% in Illinois compared to a year ago. But they’re up 6% in New York and 3% in Massachusetts.

Still, as the housing market stays hot, lenders seem to be moving more quickly to take possession of properties where homeowners are having trouble. The number of vacant bank-owned properties jumped 67% in the third quarter compared to a year ago, to 46,604, Attom said.

The states with the biggest number of properties in foreclosure are also the states with the most zombies. They are mostly states that require foreclosures to go through a court process, including New York, New Jersey, Florida, Illinois, and Indiana.

Judicial foreclosures can be a blessing, because they provide protections to homeowners, and a curse, because they take so long to complete. The lengthy and complicated process increases the likelihood that a foreclosure will become a zombie — but the hot housing market increases incentives for struggling homeowners to fight to hold on to their properties.


read more…


http://www.marketwatch.com/story/zombie-foreclosures-decline-across-the-country-except-in-some-states-where-theyve-built-strongholds-2016-09-08