Category Archives: Westchester NY

Mortgage Rates at 3.87% | Pound Ridge #Realtor

Freddie Mac today released the results of its Primary Mortgage Market Survey® (PMMS®), showing average fixed mortgage rates moving higher amid positive housing data and pushing fixed mortgage rates to their highest level of the year.

News Facts

  • 30-year fixed-rate mortgage (FRM) averaged 3.87 percent with an average 0.6 point for the week ending May 28, 2015, up from last week when it averaged 3.84 percent. A year ago at this time, the 30-year FRM averaged 4.12 percent.
  • 15-year FRM this week averaged 3.11 percent with an average 0.5 point, up from last week when it averaged 3.05 percent. A year ago at this time, the 15-year FRM averaged 3.21 percent.
  • 5-year Treasury-indexed hybrid adjustable-rate mortgage (ARM) averaged 2.90 percent this week with an average 0.5 point, up from last week when it averaged 2.88 percent. A year ago, the 5-year ARM averaged 2.96 percent.
  • 1-year Treasury-indexed ARM averaged 2.50 percent this week with an average 0.3 point, down from last week when it averaged 2.51 percent. At this time last year, the 1-year ARM averaged 2.41 percent.

Average commitment rates should be reported along with average fees and points to reflect the total upfront cost of obtaining the mortgage. Visit the following links for theRegional and National Mortgage Rate Details and Definitions. Borrowers may still pay closing costs which are not included in the survey.

Quotes
Attributed to Len Kiefer, deputy chief economist, Freddie Mac.

“Mortgage rates rose to the highest level in 2015 following positive housing market data. New home sales surged 6.8 percent to an annual pace of 517,000 units in April. Althoughexisting home sales slipped 3.3 percent to a seasonally-adjusted pace of 5.04 million units, sales are up 6.1 percent on a year-over-year basis. The S&P/Case-Shiller 20-city home price index also posted a solid gain of 5 percent over the 12-months ending in March 2015.”

Freddie Mac was established by Congress in 1970 to provide liquidity, stability and affordability to the nation’s residential mortgage markets. Freddie Mac supports communities across the nation by providing mortgage capital to lenders. Today Freddie Mac is making home possible for one in four home borrowers and is one of the largest sources of financing for multifamily housing. Additional information is available at FreddieMac.com, Twitter @FreddieMac and Freddie Mac’s blog FreddieMac.com/blog.

Lot Shortage: A Lingering Problem for Builders | Chappaqua Real Estate

In a May 2015 survey conducted by NAHB, 62 percent of builders reported that the overall supply of developed lots in their areas was low to very low, up 2 percent from May 2014, but up from 43 percent in September 2012.  Sixty-two percent is the largest low supply percentage recorded since NAHB began periodically asking the question in 1997 on its monthly survey for the NAHB/Wells Fargo Housing Market Index (HMI).

The continued low supply of developed lots is a hindrance to housing recovery that is still quite modest by most standards.  Figure 1 compares the HMI responses on lot supply to housing starts.  Starts have recovered from a low of 550,000 in 2009 to just over 1 million in 2014 (after averaging 1.5 million a year from 1960-2000, without ever plunging below 1 million until 2008).

Fig1HousingStarts&SupplyofLotsThe 62 percent includes 39 percent who characterized the supply of lots simply as “low” and 23 percent who said the supply of lots was “very low.” The shortages tended to be especially acute in the most desirable, or “A” locations. Thirty-four percent of builders said that the supply of “A” lots was very low, compared to 19 percent for lots in “B” and 14 percent for lots in “C” locations.

A shortage of buildable lots, especially in the most desirable locations translates into higher prices, as 38 percent of home builders said the price of developed “A” lots was somewhat higher than it was a year ago, and 32 percent said the price was substantially higher. In comparison, 16 percent of builders said the price of “B” lots was substantially higher than a year ago, and 12 percent said the price of “C” lots was substantially higher (Figure 2).

Fig2PriceofDevelopedLots


read more…


http://eyeonhousing.org/2015/05/17006/

Color can inspire you at home | Mt Kisco Real Estate

Choosing new paint colors for your home offers an exciting opportunity to personalize your space. The abundance of choices means you can surround yourself with a palette you’ll love.

One great way to welcome design color inspiration is to make note of colors that you have chosen for other areas in your life. Your wardrobe, prized works of art, and favorite home accessories are perfect places to look.

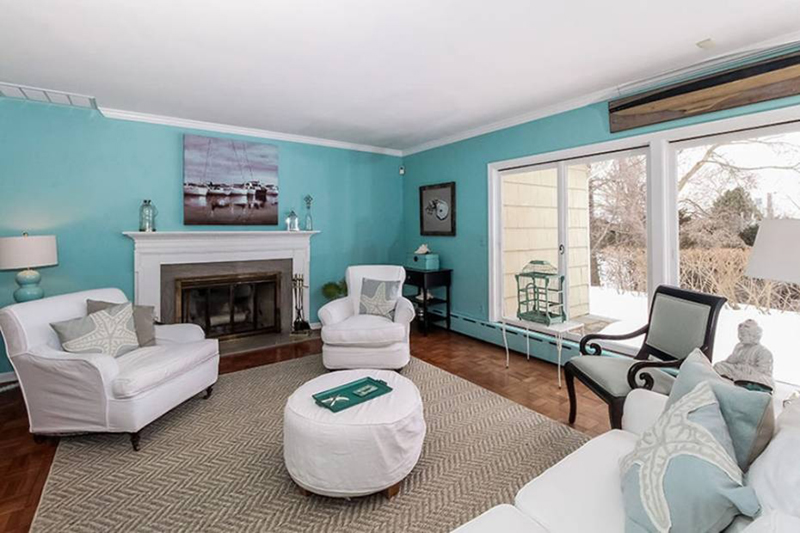
Is your closet filled with cool blues and greens? Do you love seascapes and beach scenes? If so, pull similar shades into your home. Start with Sherwin Williams SW 6945 Belize.

beach

Source: Zillow Digs

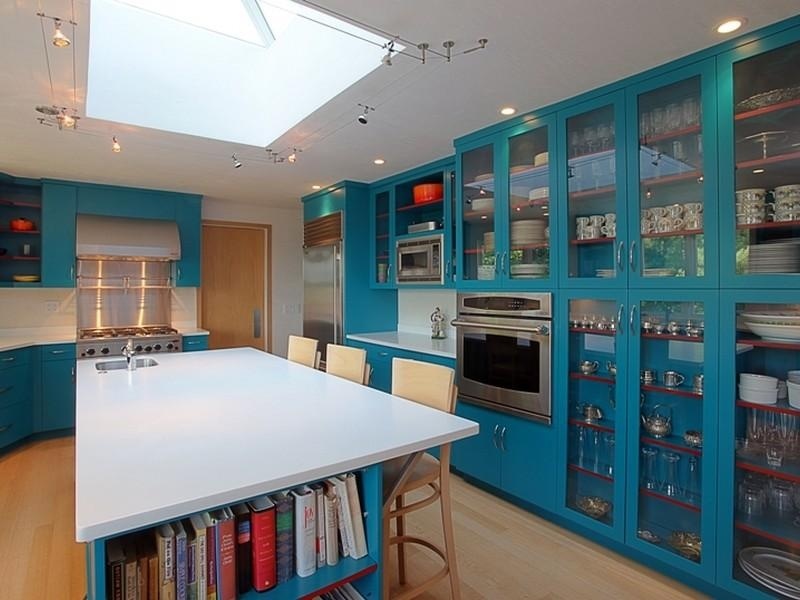
For a bolder blue statement, go with the deeper tone of SW 6943 Intense Teal.

teal

Source: Zillow Digs

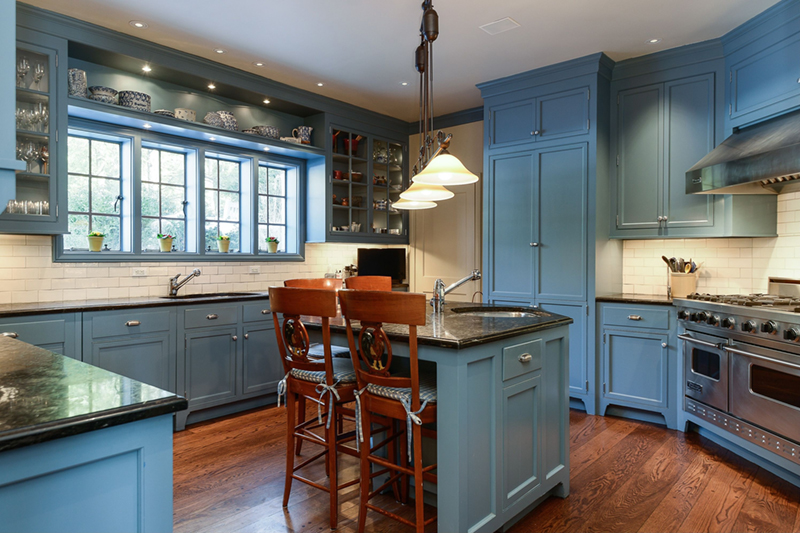
Or try the dusty hue of SW 6515 Leisure Blue, which recalls the color of a stormy sky.

blue cabinets 2

Source: Zillow Digs

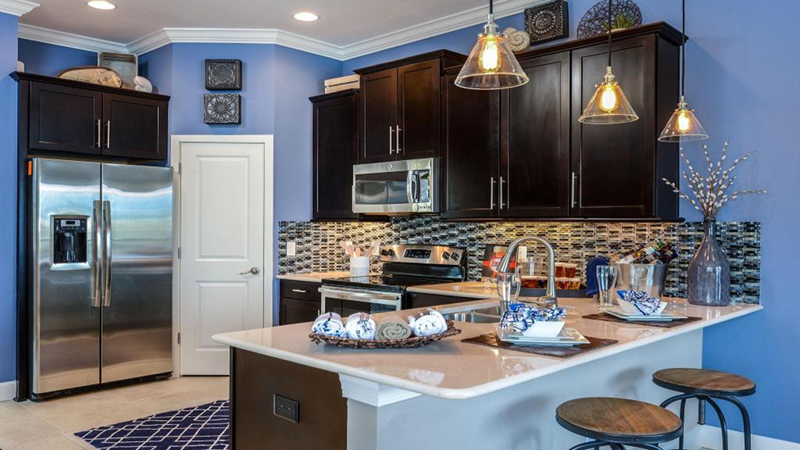
If you’re thrilled by the sight of a field of periwinkles, try SW 6529 Scanda. It’s a perfect entrance to this color family.

blue kitchen

Source: Zillow Digs

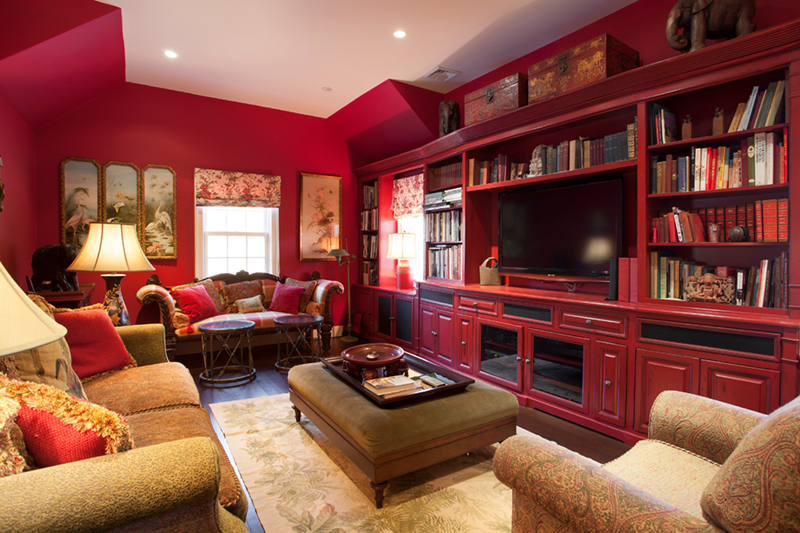
While it may seem bold, bright and warm walls can really liven up a space. Capture the drama of your special-occasion red dress with SW 6871 Positive Red.

red room sm

Increase for Typical New Multifamily Residence Size | Bedford Hills Real Estate

An elevated market share for rental multifamily homes is holding typical new apartment size below levels seen during the housing boom. However, as multifamily developers build more for-sale housing units in the years ahead, the average size of multifamily homes is likely to rise. The recent pattern of change in the size of new multifamily units stands in contrast to the post-recession increase in the size of typical new single-familyhomes.

According to first quarter 2015 data from the Census Bureau and NAHB analysis, the average per unit square footage of multifamily housing construction starts was 1,238, setting a post-recession high. The median was 1,121 square feet, near the cycle high.

MF unit size_1q15

Because the quarterly data are volatile, it is worth examining the numbers on a one-year moving average basis. For the first quarter of 2015, the one-year moving average for the multifamily size was 1,188 square feet, while the median was 1,103.

The current quarterly median is 4% higher than the post-recession low, and the average is 6% higher.

The typical size of newly built multifamily units remains below the averages/medians recorded during the boom years, when the share of for-sale multifamily was considerably higher. The share of multifamily housing starts built for-rent fell to a historical low of 47% during the third quarter of 2005. It is currently (96%) above the approximate 80% share recorded during the 1980-2002 period due to the ongoing surge in rental demand.

MF built for rent

The reason for some of the recent change in multifamily average size is due to market mix. Renters tend toward smaller units than owner-occupiers. In 2012, for example, the median size of all multifamily units completed was 1,098 square feet. However, for rental apartments the median was 1,081, while it was a larger 1,466 for for-sale multifamily residences.


read more…


http://eyeonhousing.org/2015/05/increase-for-typical-new-multifamily-residence-size/

Existing Home Sales Pause | Bedford Real Estate

Existing home sales declined 3.3% in April, despite the fact that almost half of April sales remained on the market less than one month. The National Association of Realtors (NAR) reported April 2015 total existing home sales at a seasonally adjusted rate of 5.04 million units combined for single-family homes, townhomes, condominiums and co-ops, up from an upwardly revised 5.21 million units in March. April existing sales were up 6.1% from the same period a year ago, and have increased year-over-year for seven consecutive months.

Existing Home Sales April 2015

Existing sales in the Midwest increased 1.7% from the previous month, but fell in the other regions, ranging from 1.7% in the West to 6.8% in the South. Year-over-year, all four regions increased, ranging from 13.0% in the Midwest to 1.6% in the Northeast.

The first-time buyer share remained unchanged at 30% in April, compared to 29% in February and 28% in January. The first-time buyer participation remains well below the historically typical 40% share.

Total housing inventory increased 10.0% in April to 2.21 million existing homes, which was still 0.9% below the 2.23 million level during the same month a year ago. At the current sales rate, the April unsold inventory represents a 5.3-month supply, up from a 4.6-month supply last month. NAR also reported that April homes sold in an average of 39 days compared to 52 days in March, and was the shortest time on the market since July 2013.

The distressed sales share remained unchanged at 10% in April, and was down from 15% during the same month a year ago. Distressed sales are defined as foreclosures and short sales sold at deep discounts. April all cash sales remained unchanged at 24% of transactions, down from 26% of transactions in February and 27% in January, and were down from 32% in April 2014. Individual investors purchased a 14% share of homes in April, unchanged from March, and down from 18% during the same month a year ago. Some 71% of investors paid in cash in April, compared to 70% in March, and 67% in February and January. The awaited withdrawal of cash investors will create more opportunity for first-time buyers.


read more…


http://eyeonhousing.org/2015/05/existing-home-sales-pause/

Rising Rents are Backfiring | Armonk Real Estate

A new survey by Freddie Mac finds that soaring rents are not turning renters into homeowners, but actually delaying homeownership for many.

Of those who experienced a rent increase in the past two years, 70 percent would like to buy a home but cannot afford to at this point. Half (51 percent) said that they now have to put off their plans to purchase a home. Some 44 percent indicated they’d like to buy a home and have started looking.

“We’ve found that rising rents do not appear to be playing a significant role in motivating renters to buy a home,” said David Brickman, EVP of Freddie Mac Multifamily. “This contradicts what some in the housing market think as they expect more renters ought to be actively looking to purchase a home. We believe rising rents are primarily a sign dsof increased demand rather than a signal that home purchases will be increasing.”

Brickman added, “Growth in the number of renter households is occurring amid an improving job market and economy. The demand for rental housing is increasing and an estimated 440,000 new apartment units are needed each year to keep up with demand.”

Rents rose 3.6 percent in 2014 and are expected to rise 3.4 percent above inflation this year. More than one-third of U.S. households now rent their homes, and renters account for all net new household growth over the last several years, according to the U.S. Census Bureau.

More than a third (38 percent) of renters who have lived in their home two years or more experienced a rent increase in the last two years, while 6 percent experienced a decrease.

A third of renters in the survey are very satisfied with their rental experience and another 30 percent indicate they are moderately satisfied.  The top favorable factors about renting are freedom from home maintenance, more flexibility over where you live and protection against declines in home prices.

Moreover, the results show some shared positive views across generations with no significant differences between Millennial, Generation X or Baby Boomer renters in their views that renting provides flexibility over where you live and protection against home price decline.


read more…


http://www.realestateeconomywatch.com/2015/05/

Lady Violet’s ‘Downton Abbey’ home for sale | #Waccabuc Real Estate

Savills
The dowager countess’s witticisms not included.

If you missed out last year on the listing of the “Godfather House” on Staten Island in New York, maybe this home is more up your abbey — er, alley.

Byfleet Manor, in Surrey, just southwest of London, and dower home to Maggie Smith’s character Lady Violet Crawley in the PBS series “Downton Abbey,” is on the market, according to real estate broker Savills. The price? £3.95 million,or $6.1 million. The Georgian-style brick home, built in 1686 and set on 19 acres, has a walled courtyard, eight bedrooms and four reception rooms — and it’s just 20 miles from central London.

“You get a lot of house for your money,” said Simon Ashwell, the Savills agent who is listing the home for Julie Hutton, the current owner, who bought Byfleet Manor about 10 years ago for £1 million.

Byfleet Manor isn’t one to avoid the cameras. The house also starred in the series “Poirot” and “Cranford” and was the stand-in for Cinderella’s home in the 2014 movie “Into the Woods” with Meryl Streep and Johnny Depp. When it comes to “Downton Abbey,” the home has served as Lady Violet’s house since 2010 after the location agent from the PBS series “Cranford” suggested it to the show’s producers. “We wanted to deliberately pull Violet back into that Georgian world,” Donal Woods, the production designer for “Downton Abbey,” told Savills.


read more…


http://www.marketwatch.com/story/lady-violets-downton-abbey-home-for-sale-2015-05-12

The Hills Are Coming to Life on Governors Island | Bedford Corners Real Estate

In the middle of the New York Harbor, where unused, decades-old buildings once stood, four hills are taking shape, sloping up toward the sky and pointing to the Statue of Liberty. The man-made mounds are the newest parkland on Governors Island, and when they open in 2016, visitors will be able to climb 80 feet up to see some of the best views anywhere in the city. Giant slides, wooded pathways, and grassy lawns will cover the hills, which are constructed entirely out of fill and debris from the buildings that used to occupy this part of the island. Dutch architecture firmWest 8 designed the new landscape, and the Trust for Governors Island took the first visitors to the hills last Friday during a Jane’s Walk with the Municipal Arts Society.

IMG_4638.jpg[Looking north from the top of Outlook Hill over the rest of the park toward Manhattan.]

The hills are the final piece of the island’s new 30 acres of parkland, all designed by West 8. Last year, Liggett Terrace, the Play Lawn, and Hammock Grove opened, giving park-goers rolling hills and a forest (well, what will eventually be a forest) with 60 species of trees. The new park was created with climate change and rising sea levels in mind (the Dutch know a thing or to about floods), so the landscape is flood-resistant.

IMG_5523.jpg[Walking through Hammock Grove.]

When the hills open, they will be the southern most feature of the island that is open to the public, though they will eventually be joined by future developments. To get to the hills, visitors walk through the Hammock Grove, where the trees are starting to fill in. Ellen Cavanagh, the Director of Planning at The Trust for Governors Island, explained that since the climate on the island is harsher than inland, they deliberately chose young trees so they can establish their roots and become stronger over time. As such, they only lost eight trees in the first year.

IMG_5527.jpg[At the base of the hills.]

The hills are located just south of the new ball fields, and currently, they are just giant piles of dirt. Grassy Hill, the smallest of the bunch, is at full height, and when you walk to the top, it feels like you’re well above the rest of the island, but Cavanagh points out that the elevation is no greater than the highest point in Hammock Grove, about 27 feet up.

IMG_5533.jpg[Climbing up Outlook Hill.]

At 70 feet, Outlook Hill will be the tallest. Currently, it stands at 50 feet, and it already feels incredibly tall compared to everything else around it. Cavanagh says they have been able to build at 10 feet a month, but after each level of fill is molded into place, they have to pause for it to settle and monitor it so it doesn’t move. All of the fill and debris that the hills are made from came from other parts of the island, including those buildings that they imploded in 2013.

IMG_5547.jpg[On top of Grassy Hill.]

The hills are currently on schedule to open in 2016, but Cavanagh says that could change. “We are designing with nature and nature doesn’t always cooperate with your construction plans.”

Declines for Residential Construction Spending in March | #Chappaqua Real Estate

NAHB analysis of Census construction spending data finds that over the last year, the pace of private single-family construction spending increased 7.8% and multifamily construction spending increased 23.4%, despite monthly declines for March.

For the month, the seasonally adjusted annual rate of single-family construction spending was $200.7 billion, down 1.8% from February. The March rate of multifamily construction spending was $49.2 billion, 2.1% lower than February.

The construction data (indexed in the graph below, so that the January 2000 pace is equal to 100 for both variables) illustrate the degree to which multifamily spending is thus far leading the recovery for the residential construction sector. NAHB expects gains for multifamily to slow in 2015, while single-family construction increases.

constr spending_res

It is worth noting that the Census measure for total private residential construction spending shows a 2.6% year-over-year decline, despite annual gains for single-family and multifamily development. This decline is due to a decrease in the separate improvement category, which contrasts with other measures, including theNAHB Remodeling Market Index, which indicates strength for the home improvement sector.

From March 2014, the pace of combined public and private non-residential construction spending increased 4.7% on a seasonally adjusted annual rate basis to $611.8 billion. From February 2015, non-residential spending was effectively flat, declining 0.1%.

constr spending_res_nonres

The largest year-over-year gains for nonresidential construction spending have been experienced by the classes of manufacturing-related construction (50.7% gain), amusement/recreation (23.8%), lodging (22%), office (19.8%), and sewage/waste disposal (19.6%).


read more…


http://eyeonhousing.org/2015/05/declines-for-residential-construction-spending-in-march/