Category Archives: Westchester NY

Building Labor Shortage Intensifies | Waccabuc Real Estate

A survey of single-family builders conducted by NAHB in June 2015 shows that shortages of labor and subcontractors—already quite widespread in mid-2014—have become even more widespread during the past year.

The shortages are most acute for basic skills like carpentry, which are needed during the construction of any home.  For example, in the 2015 survey 69 percent of builders reported a shortage (either serious or some) of construction workers willing and able to do rough carpentry.

2015 labor shortages

Builders, however, may be even more concerned about the availability of subcontractors than of workers to employ directly.  In building a single-family home, three-quarters of the construction work is typically done by subcontractors (documented in a 2012 NAHB survey available here).  The rankings of labor and subcontractor shortages in the 2015 survey were similar, but—with the exception of building maintenance managers—the shortages of subcontractors were more widespread.  In the rough carpentry category at the top of  both charts, 74 percent of builders reported a shortage of subcontractors, compared to 69 percent for labor directly employed.

2015 sub shortages

Historically, for every trade covered in the survey, shortages were more widespread in 2015 than in 2014.  One way to see this is to look at the labor shortage percentage averaged across all 9 trades that NAHB surveys have covered in a consistent way since 1996.  This average skyrocketed from a low of 21 percent in 2012 to 46 percent in 2014, before increasing even further to 52 percent in 2015.

Nine trade history

The 9 consistently covered trades are carpenters-rough, carpenters-finished, home electrician services, excavators, framing crews, roofers, plumbers, bricklayers/masons and painters.  The history for each is available in the full report.  The survey’s current list of 12 trades was recommended by Home Builders Institute, NAHB’s workforce development arm.

The incidence of shortages is surprisingly high given the rate of new home construction, which has only partially recovered from its 2008 downturn.  In fact, the 9-trade shortage is now substantially higher than it was at the peak of the 2004-2005 boom, when annual starts were averaging around 2 million, compared to current rates of about 1 million.  The last time builder-reported labor shortages were as widespread as now was just before 2001—during a prolonged period of strong GDP growth with overall unemployment as low as 4.0 percent.

read more….

http://eyeonhousing.org/2015/07/

Employment Situation in June for Housing | Cross River Real Estate

Strong job gains in April and May were revised downward by 60 thousand and the unemployment rate fell 0.2 percentage points based on a reversal of the labor market expansion in May. Overall, the employment situation in June was decent, but the recovery from the weakness in March was less vibrant than originally estimated.

The Bureau of Labor Statistics (BLS) reported that payroll employment expanded by 223 thousand in June. This brings average monthly payroll gains to 208 thousand in the first half of 2015 compared to 239 thousand in the first half of 2014 and 260 thousand for all of 2014. The unemployment rate dropped to 5.3% in June from 5.5% in May despite a decline in employed persons in the household survey and based on a reduction in the labor force of 432 thousand. The labor force expanded by 397 thousand in May.

blog emp 2015_06


read more…


http://eyeonhousing.org/2015/07/

May Gains for Residential Construction Spending | Bedford Hills Real Estate

NAHB analysis of Census Construction Spending data shows that total residential construction spending for May increased to a seasonally adjusted annual rate of $366.1 billion. On a month-over-month basis, multifamily spending was $48.7 billion, up by 0.2% over the revised April estimate, while the single-family spending was $209.4 billion, an increase of 0.03% from April. Annually, multifamily spending rose 20.8% from the revised 2014 estimate and the spending on single-family construction was 11.2% higher than May 2014.

The Census construction spending index, which is shown in the graph below (the base is January 2000), indicates that both the monthly and annual increase were largely driven by the steady increase in multifamily construction spending. The pace of multifamily spending is gradually slowing. NAHB anticipates an increase in single-family spending in 2015.

Slide1


The pace of nonresidential construction spending was also up by 1.1% monthly in May, and the annual increase from the revised May 2014 data was around 8.2%. The largest contribution to this year-over-year nonresidential spending gain was made by the class of manufacturing-related construction (69.5% increase), followed by lodging (30.6% increase) and amusement/recreation (29.8% increase).

Slide2


read more…


http://eyeonhousing.org/2015/07/may-gains-for-residential-construction-spending/

US housing stages ‘lopsided’ recovery | Bedford NY Real Estate

The lasting legacy of the US housing crash has ranked at the top of the so-called “headwinds” that Federal Reserve policy makers such asJanet Yellen cite when discussing America’s economic prospects.

A host of indicators are suggesting now that, even if the property market remains well below its boom-time highs, it is firmly in recovery mode.

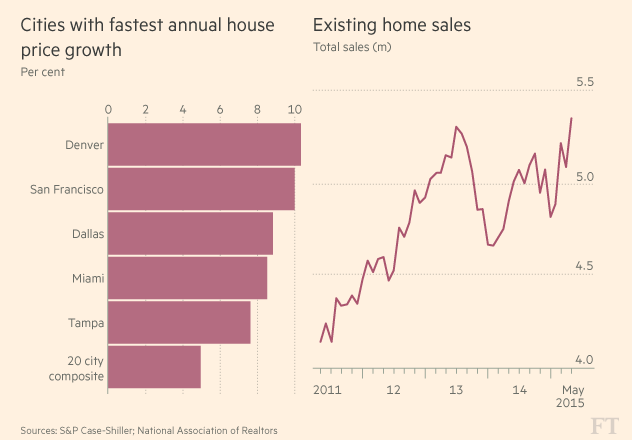
The Case-Shiller index of home values in 20 cities rose 4.9 per cent from a year earlier in April, according to data released Tuesday, with values in Denver and San Francisco rising around 10 per cent from a year earlier. That came after the National Association of Realtors index of pending home sales hit its highest level since April 2006.

The problem with the recovery is that it is, in the words of Sam Khater, deputy chief economist at CoreLogic, a lopsided one.

An acute lack of construction at the lower end of the market is creating a tight supply of housing, driving up rents and pushing up prices of affordable homes to levels reached in 2006.

With access to credit far more constricted than it was before the financial crisis and income growth depressed, home ownership rates have fallen to 20-year lows, as many younger Americans are locked out of property ownership.

Mr Khater said: “The property market is strengthening, but it’s a complex picture that’s by no means good news for all Americans.”

Back in 2013 US housing hit a setback associated with a 100 basis-point upward lurch in mortgage rates induced by the Fed’s so-called “taper tantrum”. In recent months it has seen renewed momentum, however. Existing home sales rose to an annual rate of 5.35m in May, according to the National Association of Realtors, the fastest pace since 2009.

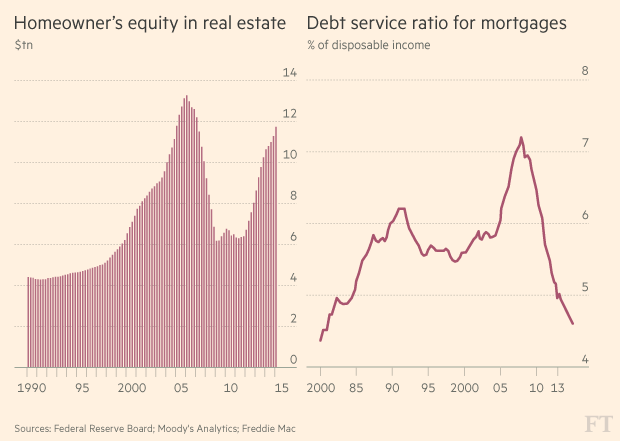
Rising values are pushing up equity in the housing market, with low interest rates helping for those who can qualify for home loans. In addition, real disposable incomes have risen 4 per cent nationally over the past four quarters.

While an increase in interest rates by the Federal Reserve could impact affordability, Tim Hopper, chief economist at TIAA-CREF, a financial services company, argued that US households are better positioned to weather higher borrowing costs. “The consumer is in much better shape than just a few years ago,” he said.

Nevertheless, there were still 5.1m mortgaged houses in negative equity in the first quarter, compared with 5.4m at the end of last year, according to CoreLogic data. Poorer neighbourhoods tend to have very high concentrations of negative equity, underlining the long shadow of the property crash and deeply divided fortunes now characterising the housing market.

Among the lasting legacies of the downturn have been tightening lending standards, a shift to renting, and a decline in rates of home ownership. The home ownership rate at the end of last year was at 64.5 per cent, erasing most of the increase over the previous two decades. Between 2006 and 2013, there was a 3m increase in single family home rentals.

With construction of housing remaining depressed, households are encountering a tight supply and surging rents — with the national vacancy rate near its lowest in 20 years. This is putting acute pressure on many people’s finances. In 2013 almost half of renters had housing cost burdens, including more than a quarter with “severe” burdens — paying more than 50 per cent of income for housing, according to Harvard’s Joint Center for Housing Studies.


read more…


http://www.cnbc.com/id/102802954

Beautifully Restored Marcel Breuer Masterpiece | Pound Ridge Real Estate


All photos via Klemm Real Estate

Location: Litchfield, Connecticut
Price: $2,495,000

Hailed as the first piece of modern architecture in Litchfield, Connecticut, the 1950 Stillman House by Modernist great Marcel Breuer brought glass, colors, and clean lines to an historic New England town that was until then all about colonials. The 2,359-square-foot masterpiece, which would usher in more modern works in Litchfield by other members of Breuer’s Bauhaus-inspired cohort, the Harvard Five, is set on over two acres of secluded hilltop grounds. When current owners purchased it from the Stillman family in 2009, it was in desperate need of repairs. What followed was a four-year total restoration that introduced contemporary luxuries while maintaining Breuer’s original intentions.

Now on the market for $2.495M, the property includes a main house with four bedrooms, a guesthouse with a large sunken living room, floating staircases on the interior and exterior, and the most covetable pool. As seen in a 1950s black-and-white outdoor shot below, one end of the pool was adorned with a striking geometric mural by American sculptor Alexander Calder. The pool wall has since then been rebuilt after it deteriorated, and today, a facsimile of the artwork stands, continuing a dynamic dialogue with the blue, yellow, red, and grey strips on the front facade. On the interior, one end of a fireplace also sports the original Sound Waves mural by Bauhaus artistXanti Schawinsky.


read more…


http://curbed.com/archives/2015/07/01/

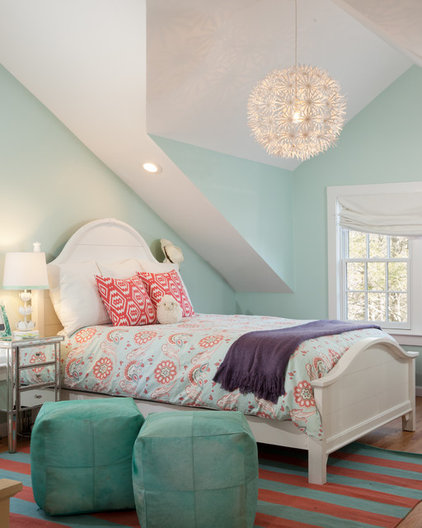
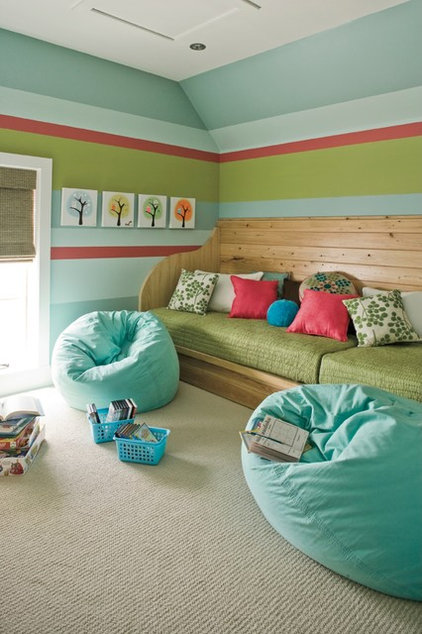
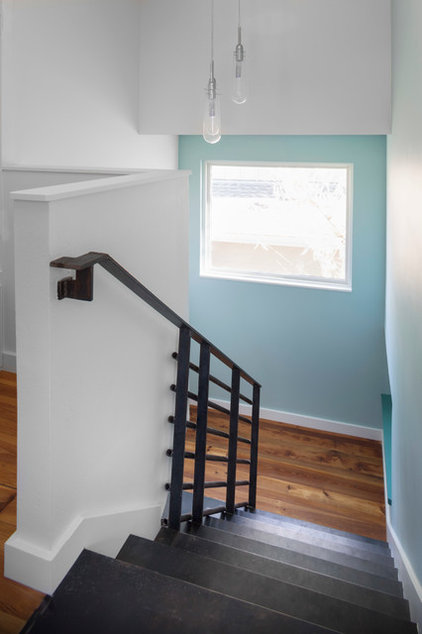
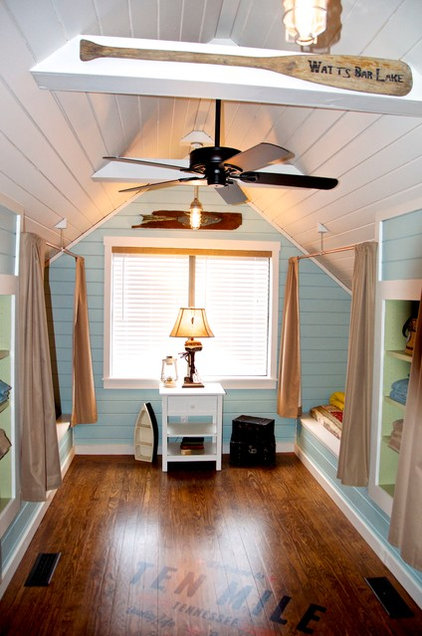
The color Watery Blue Is Summer’s Best Hue | Bedford Corners Real Estate

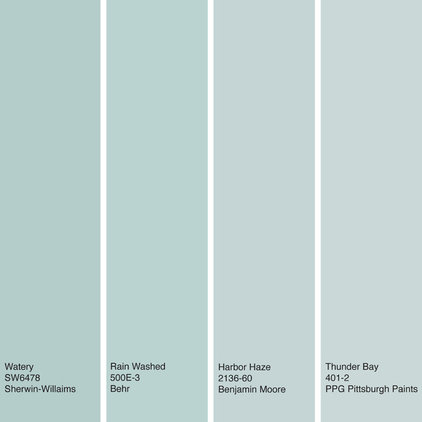
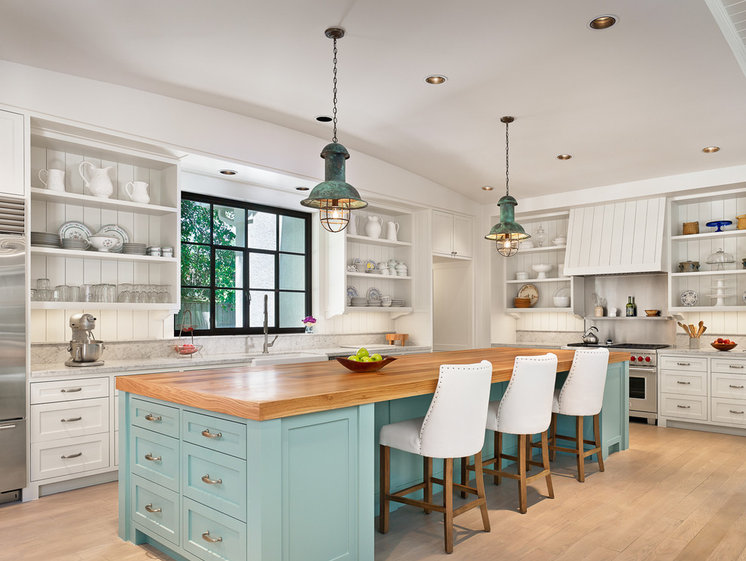
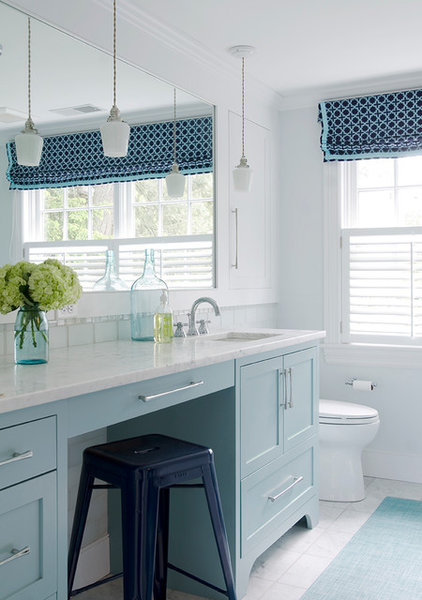
Summer’s in full swing, which hopefully means plenty of pool and beach time for many of you. Whenever I’m working with a homeowner who wants to add some color to their home, but doesn’t necessarily want to travel down the bold road, I recommend watery blue hues — colors inspired by summertime spent by the sea.

These soft, muted greenish-blue hues work especially well for bedrooms and bathrooms, where they offer a calming, spa-inspired vibe. I’ve gathered together some paint color options as well as examples of how to work with this pleasing, ocean-inspired hue.

Renting: Awful for just about everyone right now | Chappaqua Real Estate

If you’ve gone through the painstaking process of renting a new apartment in the past few years, you probably faced some sticker-shock. Vacancy rates are low, really low. And despite ever-present scaffolding, construction in many cities is still slow, as new tenants move in but few move out. The result is that in almost every major metro area, the rent is, in fact, too damn high.

Basic wisdom (which was largely established by rules governing public housing eligibility) warns a healthy bank account means that one’s housing costs shouldn’t exceed about one-third of a person’s take home pay. While that might be a prudent suggestion because, after all, people do have other bills and savings goals, it’s become virtually impossible to adhere to for many who live in major metro areas.

A recent report from the Joint Center for Housing Studies (JCHS) at Harvard, puts some numbers on just how bad this problem is: About half of all renters in the U.S. are using more than 30 percent of their income to cover housing costs, and about 25 percent have rent that exceeds 50 percent of their monthly pay.

It’s not just the poorest city-dwellers who are feeling the rent pressure. As prices rise, even those who make median incomes are finding that their rent eats away at a more significant portion of their pay than it once did for those in the middle class. It’s also not just the Millennial crowd: This problem is also  evident across different age groups, including Gen X and Boomers who never left the rental market, or find themselves back in it after the housing crash.

A big part of the problem is that fewer households are making the transition from renting to owning, which means more competition for limited inventory—driving rental prices up. Renters who would previously be able to qualify for mortgages are either finding that mortgage lenders are still super strict post-recession, or that there simply aren’t many homes in their price range—or both. “In normal times when homeownership was achievable you could get a starter home for between $150,000 to $250,000,” says Andrew Jakabovics, a senior director at Enterprise Community Partners, a nonprofit that focuses on affordable housing. “That segment of the market is basically dead.”

So instead, households with higher incomes and dreams of white picket fences remain in the rental market. Those households take up available units in the mid-to-high price ranges, for which they can afford to pay a premium. In fact, renters with incomes that top $75,000 are among the fastest growing group in the market, says Chris Herbert, the managing director of the JCHS. “Developers will be drawn to build the houses that provide the highest returns,” he says. That means not enough new apartments are affordable apartments that can accommodate low- and middle-income residents. Instead, high-priced luxury units get built first, pushing rents up and middle and low-income earners into apartments that are more expensive than they can afford. Sometimes this means pricing them out of cities altogether.

read more…

http://finance.yahoo.com/news/renting-awful-just-everyone-now-115800504.html

Pending Sales Continue Momentum | Armonk Real Estate

The Pending Home Sales Index increased for the fifth straight month to the highest level in over nine years. The Pending Home Sales Index (PHSI), a forward-looking indicator based on signed contracts reported by theNational Association of Realtors (NAR), increased 0.9% in May to 112.6, and climbed to 10.4% above the May level a year ago.

Pending Home Sales May 2015

Regionally, the May PHSI increased 6.3% in the Northeast and 2.2% in the West. However, the May PHSI declined slightly by 0.6% in the Midwest and 0.8% in the South. Year-over-year, the PHSI was up 13.0% in the West, 10.6% both in the Northeast and South, and 7.8% in the Midwest.


read more…


http://eyeonhousing.org/2015/06/pending-sales-continue-momentum/

Mortgage Rates Average 4.02% | Cross River Real Estate

Freddie Mac today released the results of its Primary Mortgage Market Survey(R) (PMMS®), showing average fixed mortgage rates little changed from the previous week amid reports of the U.S. housing market strengthening.

News Facts

  • 30-year fixed-rate mortgage (FRM) averaged 4.02 percent with an average 0.7 point for the week ending June 25, 2015, up from last week when it averaged 4.00 percent. A year ago at this time, the 30-year FRM averaged 4.14 percent.
  • 15-year FRM this week averaged 3.21 percent with an average 0.6 point, down from last week when it averaged 3.23 percent. A year ago at this time, the 15-year FRM averaged 3.22 percent.
  • 5-year Treasury-indexed hybrid adjustable-rate mortgage (ARM) averaged 2.98 percent this week with an average 0.4 point, down from last week when it averaged 3.00 percent. A year ago, the 5-year ARM averaged 2.98 percent.
  • 1-year Treasury-indexed ARM averaged 2.50 percent this week with an average 0.3 point, down from last week when it averaged 2.53 percent. At this time last year, the 1-year ARM averaged 2.40 percent.

Average commitment rates should be reported along with average fees and points to reflect the total upfront cost of obtaining the mortgage. Visit the following links for theRegional and National Mortgage Rate Details and Definitions. Borrowers may still pay closing costs which are not included in the survey.

Quote
Attributed to Sean Becketti, chief economist, Freddie Mac.

“Mortgage rates were little changed this week. The rate on 30-year fixed-rate mortgages was 4.02 percent, an increase of just 2 basis points from the previous week. Economic releases confirmed increasing strength in housing. Existing home sales increased 5.1 percent in May to an annual pace of 5.35 million units and new home sales increased 2.2 percent to an annual pace of 546,000 units. Buyers appear anxious to purchase homes before the expected increase in interest rates later this year. Given the tight inventory of homes for sale, a 5.1-month supply at the current sales pace, home prices are being bid up.”

Housing’s Share of GDP Expanded at the Start of 2015 | Waccabuc Real Estate

With the release of the final estimates of first quarter 2015 GDP growth (a decline of -0.2%), housing’s share of gross domestic product (GDP) grew to 15.45%, with home building and remodeling yielding 3.14 percentage points of that total.

housing share of GDP

Housing-related activities contribute to GDP in two basic ways.

The first is through residential fixed investment (RFI). RFI is effectively the measure of the home building and remodeling contribution to GDP. It includes construction of new single-family and multifamily structures, residential remodeling, production of manufactured homes and brokers’ fees. For the first quarter, RFI was 3.14% of the economy.

The RFI component reached a $512 billion annualized pace during the start of the year. This is the  highest quarterly rate for RFI since the middle of 2008.

The growth for RFI at the start of 2015 added 0.21 points to the headline GDP growth rate (GDP would have declined 0.4% absent the RFI component).

The second impact of housing on GDP is the measure of housing services, which includes gross rents (including utilities) paid by renters, and owners’ imputed rent (an estimate of how much it would cost to rent owner-occupied units) and utility payments. The inclusion of owners’ imputed rent is necessary from a national income accounting approach because without this measure increases in homeownership would result in declines for GDP. For the first quarter, housing services was 12.3% of the economy or $2 trillion on an annualized basis.

Taken together, housing’s share of GDP was 15.45% for the start of the year.

Historically, RFI has averaged roughly 5% of GDP while housing services have averaged between 12% and 13%, for a combined 17% to 18% of GDP. These shares tend to vary over the business cycle.


read more….


http://eyeonhousing.org/2015/06/housings-share-of-gdp-expanded-at-the-start-of-2015/