Category Archives: Mount Kisco

Mortgage rates average 2.97% | Mt Kisco Real Estate

— Freddie Mac today released the results of its Primary Mortgage Market Survey (PMMS), showing that the 30-year fixed-rate mortgage (FRM) averaged 2.97 percent.

“The drop in mortgage rates is good news for homeowners who are still looking to take advantage of the very low rate environment,” said Sam Khater, Freddie Mac’s Chief Economist. “Freddie Mac research suggests that lower income and minority homeowners have been less likely to engage in the refinance market. Low and declining mortgage rates provide these homeowners the opportunity to reduce their monthly payment and improve their financial position.”

News Facts

  • 30-year fixed-rate mortgage averaged 2.97 percent with an average 0.7 point for the week ending April 22, 2021, down from last week when it averaged 3.04 percent. A year ago at this time, the 30-year FRM averaged 3.33 percent.
  • 15-year fixed-rate mortgage averaged 2.29 percent with an average 0.6 point, down from last week when it averaged 2.35 percent. A year ago at this time, the 15-year FRM averaged 2.86 percent.
  • 5-year Treasury-indexed hybrid adjustable-rate mortgage (ARM) averaged 2.83 percent with an average 0.3 point, up from last week when it averaged 2.80 percent. A year ago at this time, the 5-year ARM averaged 3.28 percent.

The PMMS is focused on conventional, conforming, fully amortizing home purchase loans for borrowers who put 20 percent down and have excellent credit. Average commitment rates should be reported along with average fees and points to reflect the total upfront cost of obtaining the mortgage. Visit the following link for the Definitions. Borrowers may still pay closing costs which are not included in the survey.

Freddie Mac makes home possible for millions of families and individuals by providing mortgage capital to lenders. Since our creation by Congress in 1970, we’ve made housing more accessible and affordable for homebuyers and renters in communities nationwide. We are building a better housing finance system for homebuyers, renters, lenders, investors and taxpayers. Learn more at FreddieMac.com, Twitter @FreddieMac and Freddie Mac’s blog FreddieMac.com/blog.

Case-Shiller home prices up 9.5% | Mt Kisco Real Estate

In November, national home prices continued to rise at a fast pace, fueled by strong demand and low inventory. All 19 major markets saw double-digit growths in home prices.

The S&P CoreLogic Case-Shiller U.S. National Home Price Index, reported by S&P Dow Jones Indices, rose at a seasonally adjusted annual growth rate of 18.3% in November, following a 21.9% increase in October. It marks the fourth consecutive month of double-digit growth in home prices. On a year-over-year basis, the S&P CoreLogic Case-Shiller U.S. National Home Price NSA Index posted a 9.5% annual gain in November, up from 8.4% in September. It is the fastest pace of home price appreciation since February 2014. Strong demand, low interest rates and tight inventory together pushed home prices to new highs amid the COVID-19 pandemic.

Meanwhile, the Home Price Index, released by the Federal Housing Finance Agency (FHFA), rose at a seasonally adjusted annual rate of 12.9% in November, following a 19.3% increase in October. On a year-over-year basis, the FHFA Home Price NSA Index rose by 11.0% in November, after an increase of 10.3% in October. It confirmed rapid growth in home prices for this month.

In addition to tracking national home price changes, S&P reported home price indexes across 19 metro areas in November (Detroit metro area data was missing in November 2020 because there are not a sufficient number of records for the month of November for Detroit).

In November, all 19 metro areas reported positive home price appreciation and their annual growth rates ranged from 9.1% to 27.7%. Among all the 19 metro areas, seven metro areas exceeded the national average of 18.3%. New York, Seattle and Boston had the highest home price appreciation. New York led the way with a 27.7% increase, followed by Seattle with a 22.4% increase and Boston with a 21.9% increase.

read more…

eyeonhousing.org/2021/01/

Existing home sales up 25% | Mt Kisco Real Estate

After reaching almost 15-year high last month, existing home sales, as reported by the National Association of Realtors (NAR), declined for the first time in six months amid inventory shortage and surging prices.

Total existing home sales, including single-family homes, townhomes, condominiums and co-ops, fell 2.5% to a seasonally adjusted annual rate of 6.69 million in November. On a year-over-year basis, sales were still 25.8% higher than a year ago.

The first-time buyer share stayed at 32% in November, same as last month and a year ago. However, price gains threaten this share in the future. The November inventory level fell to record-low 1.28 million units from 1.42 million units in October and is down from 1.64 million units a year ago.

At the current sales rate, the November unsold inventory represents an all-time low 2.3-month supply, down from 2.5-month in October and 3.7-month a year ago. This low level supply of resale homes is good news for home construction.

Homes stayed on the market for an average of just 21 days in November, an all-time low, seasonally even with last month and down from 38 days a year ago. In November, 73% of homes sold were on the market for less than a month.

The November all-cash sales share was 20% of transactions, up from 19% last month but unchanged from a year ago.

Tight supply continues to push up home prices. The November median sales price of all existing homes was $310,800, up 14.6% from a year ago, representing the 105th consecutive month of year-over-year increases. The median existing condominium/co-op price of $271,400 in November was up 9.5% from a year ago.

Regionally, three of four regions saw a decline in existing home sales in November. Sales in the Northeast, Midwest and South fell 2.2%, 2.5% and 3.8% respectively from last month, while sales in the West remained unchanged. On a year-over-year basis, sales still grew by double-digit in all four regions, ranging from 24.2% in the Midwest to 27.3% in the West.

Though sales took a marginal step back in November, existing home sales have outperformed 2019 levels and housing demand is expected to remain strong due to low mortgage rates and remote-work flexibilities. However, the imbalance between housing supply and demand could hamper future sales by driving up home prices and restraining affordability.

read more…

eyeonhousing.org

Case Shiller home prices up 5.2% | Mt Kisco Real Estate

U.S. home prices posted a robust gain in August — another sign that the American housing market remains strong despite economic fallout from the coronavirus pandemic.

The S&P CoreLogic Case-Shiller 20-city home price index, released Tuesday, showed that home prices climbed 5.2% in August from a year earlier, accelerating from a 4.1% gain in July. The gain was stronger than economists had expected.

Phoenix (up 9.9% from August 2019), Seattle (up 8.5%) and San Diego (7.6%) posted the biggest gains. All 19 cities in the index recorded price increases. The 20-city index excluded prices from the Detroit metropolitan area index because of delays related to pandemic at the recording office in Wayne County, which includes Detroit.

Helped by rock-bottom mortgage rates, the U.S. housing market has been a source of strength as the U.S. economy climbs back from an April-June freefall caused by the pandemic and the measures taken to contain it.

“The supply of for-sale homes, already extremely tight, has only become more constrained in recent months, and historically low mortgage rates continue to encourage many buyers to enter the market,” Matthew Speakman, economist at the real estate firm Zillow, said in a research note. “This heightened competition for the few homes on the market has placed consistent, firm pressure on home prices for months now, and there are few signs that this will relent any time soon.”

The National Association of Realtors reported last week that sales of existing shot up 9.4% in September and that the median selling price of a home climbed 15% from a year earlier to $311,800. And the Commerce Department reported that home building rose 1.9% in September on a surge in construction of single-family homes.

read more…

https://wtop.com/real-estate/2020/10/sp-corelogic-case-shiller-us-home-prices-up-5-2-in-august/

Existing home sales jump to 14-year high, as prices set another record | Mt Kisco Real Estate

  • Sales of existing homes rose 2.4% to a seasonally adjusted annualized rate of 6.0 million units, according to the National Association of Realtors.
  • Sales were 10.5% higher compared with August 2019. This is the highest sales pace since December 2006, before the Great Recession. 
  • Tough competition has the market moving very quickly. It took just 22 days to sell a home in August, matching the fastest on record.
A home for sale is seen in Santa Monica, California.

A home for sale is seen in Santa Monica, California.

After a record-setting July, the housing market still shows no sign of cooling off.

Sales of existing homes rose 2.4% to a seasonally adjusted annualized rate of 6 million units, according to the National Association of Realtors. Sales were 10.5% higher compared with August 2019. This is the highest sales pace since December 2006, before the Great Recession.

Sales were hampered only by lack of supply. There were 1.49 million homes for sale at the end of August, down 18.6% annually to a 3.0-month supply. The number of homes for sale when sales were last this robust, in 2006, was more than double the current supply.

That tight supply pushed the median price of an existing home sold in August to a record high of $310,600. That is up 11.4% annually. In the third quarter of this year the housing wealth will have increased by $1.5 trillion from the second quarter.

“The imbalance of supply and demand will hurt affordability soon. Once that appears it will hinder home ownership rates,” said Lawrence Yun, chief economist for the Realtors. 

Tough competition has the market moving very quickly. It took just 22 days to sell a home in August, matching the fastest on record.

Mortgage rates set several record lows in August, which only added to the fierce competition for housing. Low rates also kept the heat on home prices, as they give buyers additional purchasing power.

Regionally, sales were strongest in the Northeast, rising 13.8% month to month. Sales were 1.4% higher in the Midwest and 0.8% higher in both the South and West. The Northeast saw some of the strictest shutdown rules early in the coronavirus pandemic, so the recovery now may be making up for that.  

Sales of newly built homes, which are counted by signed contracts, not closings, jumped 36% annually in July. Builders are benefiting from the tight supply of existing homes for sale, as well as for the new consumer demand for higher-tech homes in suburban and rural locations.

Strong demand is expected to continue into the usually slower fall months, but there may be a brief drop in the numbers because of the various natural disasters across the nation.

“In early September, new housing supply took a hit from the wildfires and hurricanes, and sales activity weakened. But because the impact of natural disasters has been more supply-oriented than demand-oriented, prices are expected to remain high,” said Danielle Hale, chief economist at realtor.com. “The combination of high prices and low supply is going to continue to make finding a home an even more difficult task than it already is.”

read more…

https://www.cnbc.com/2020/09/22/existing-home-sales-jump-to-14-year-high-as-prices-set-another-record.html

Homeowners will face new refinancing fee starting in September | Mt Kisco Real Estate

Borrowers who rushed in droves to capitalize on low mortgage rates are in for a new surprise.

Fannie Mae and Freddie Mac, the government-sponsored enterprises that back millions of mortgages, are adding a new 0.5% fee on all mortgage refinance transactions starting Sept. 1. The news comes as the rate on the 30-year-fixed mortgage is just off its all-time low at 2.96%, according to Freddie Mac.

Normally a rate this low would be a boon for homeowners looking to refinance their current mortgage and lower their monthly payment, but the extra would cost the average consumer $1,400, according to the Mortgage Bankers Association, and would eat away at some of the savings during a very uncertain economic time.

“It’s a money grab,” said Greg McBride, chief financial analyst at Bankrate.com, a personal finance website. “It’s capitalizing on refinancing volume with the idea of putting more money into the coffers of Freddie Mac and Fannie Mae.”

Huntington, N.Y.: Photo of home for sale in Huntington, New York on August 5, 2020. (Photo by Thomas A. Ferrara/Newsday RM via Getty Images)

17.8 million candidates are eligible for refinancing

The new fee could affect the 17.8 million homeowners who are eligible for refinancing, according to numbers provided exclusively to Yahoo Money from BlackKnight, a mortgage and analytics data consulting firm.

On average, these Americans could save $291 a month, for a total of $5.2 billion in cumulative savings. These homeowners have at least 20% equity in their homes, a credit score of 720 or higher, and who can shave off at least 0.75 percentage points off their current mortgage rate.

Lenders have the option to pay the fee themselves rather than passing it on to the borrower, but it’s unclear if banks will do this.

You’ve got a Federal Reserve creating money that is used to buy Fannie Mae and Freddie Mac mortgage-backed securities [to] drive down mortgage rates and allow the consumer to put savings in their pockets, but then the Federal Housing Finance Authority wants to get in the pockets of these consumers and dilute a lot of the benefit of what the Federal Reserve is doing in the first place,” McBride said.

“It is really going to put a dent in the refinancing boom,” he added, “especially for borrowers who with a rate of 3.7% could refinance to 2.7%, but now will expect 3%.

read more…

https://money.yahoo.com/homeowners-will-face-new-refinancing-fee-starting-in-september-200212661.html

Mortgage rates average 3.01% | Mt Kisco Real Estate

Freddie Mac (OTCQB: FMCC) today released the results of its Primary Mortgage Market Survey® (PMMS®), showing that the 30-year fixed-rate mortgage (FRM) averaged 3.01 percent.

“While housing demand continues to rebound, the month-long swoon in economic activity has caused the 10-year Treasury benchmark to drop. In the short-term, this means the demand will continue on the back of near record low mortgage rates,” said Sam Khater, Freddie Mac’s Chief Economist. “However, the most recent consumer spending data has been pointing to slow growth since mid-June. The concern is that the pause in economic activity will cause unemployment to remain elevated which will lead to longer-term labor market distress.”

News Facts

  • 30-year fixed-rate mortgage averaged 3.01 percent with an average 0.8 point for the week ending July 23, 2020, up slightly from 2.98 percent. A year ago at this time, the 30-year FRM averaged 3.75 percent.  
  • 15-year fixed-rate mortgage averaged 2.54 percent with an average 0.7 point, up from last week when it averaged 2.48 percent. A year ago at this time, the 15-year FRM averaged 3.18 percent.  
  • 5-year Treasury-indexed hybrid adjustable-rate mortgage (ARM) averaged 3.09 percent with an average 0.3 point, up slightly from last week when it averaged 3.06 percent. A year ago at this time, the 5-year ARM averaged 3.47 percent.

Average commitment rates should be reported along with average fees and points to reflect the total upfront cost of obtaining the mortgage. Visit the following link for the Definitions. Borrowers may still pay closing costs which are not included in the survey.

NAR reports existing sales jump 20.7% in June | Mt Kisco Real Estate

 Existing-home sales rebounded at a record pace in June, showing strong signs of a market turnaround after three straight months of sales declines caused by the ongoing pandemic, according to the National Association of Realtors®. Each of the four major regions achieved month-over-month growth, with the West experiencing the greatest sales recovery.

Total existing-home sales,1 https://www.nar.realtor/existing-home-sales, completed transactions that include single-family homes, townhomes, condominiums and co-ops, jumped 20.7% from May to a seasonally-adjusted annual rate of 4.72 million in June. Sales overall, however, dipped year-over-year, down 11.3% from a year ago (5.32 million in June 2019).

“The sales recovery is strong, as buyers were eager to purchase homes and properties that they had been eyeing during the shutdown,” said Lawrence Yun, NAR’s chief economist. “This revitalization looks to be sustainable for many months ahead as long as mortgage rates remain low and job gains continue.”

The median existing-home price2 for all housing types in June was $295,300, up 3.5% from June 2019 ($285,400), as prices rose in every region. June’s national price increase marks 100 straight months of year-over-year gains.

Total housing inventory3 at the end of June totaled 1.57 million units, up 1.3% from May, but still down 18.2% from one year ago (1.92 million). Unsold inventory sits at a 4.0-month supply at the current sales pace, down from both 4.8 months in May and from the 4.3-month figure recorded in June 2019.

Yun explains that significantly low inventory was a problem even before the pandemic and says such circumstances can lead to inflated costs.

“Home prices rose during the lockdown and could rise even further due to heavy buyer competition and a significant shortage of supply.”

Yun’s concerns are underscored in NAR’s recently released 2020 Member Profile, in which Realtors® point to low inventory as being one of the top hindrances for potential buyers.

Properties typically remained on the market for 24 days in June, seasonally down from 26 days in May, and down from 27 days in June 2019. Sixty-two percent of homes sold in June 2020 were on the market for less than a month.

First-time buyers were responsible for 35% of sales in June, up from 34% in May 2020 and about equal to 35% in June 2019. NAR’s 2019 Profile of Home Buyers and Sellers – released in late 20194 – revealed that the annual share of first-time buyers was 33%.

Individual investors or second-home buyers, who account for many cash sales, purchased 9% of homes in June, down from 14% in May 2020 and 10% in June 2019. All-cash sales accounted for 16% of transactions in June, down from 17% in May 2020 and about equal to 16% in June 2019.

Distressed sales5 – foreclosures and short sales – represented 3% of sales in June, about even with May but up from 2% in June 2019.

“It’s inspiring to see Realtors® absorb the shock and unprecedented challenges of the virus-induced shutdowns and bounce back in this manner,” said NAR President Vince Malta, broker at Malta & Co., Inc., in San Francisco, Calif. “NAR and our 1.4 million members will continue to tirelessly work to facilitate our nation’s economic recovery as we all adjust to this new normal.”

According to Freddie Mac, the average commitment rate(link is external) for a 30-year, conventional, fixed-rate mortgage decreased to 3.16% in June, down from 3.23% in May. The average commitment rate across all of 2019 was 3.94%.

Single-family and Condo/Co-op Sales

Single-family home sales sat at a seasonally-adjusted annual rate of 4.28 million in June, up 19.9% from 3.57 million in May, and down 9.9% from one year ago. The median existing single-family home price was $298,600 in June, up 3.5% from June 2019.

Existing condominium and co-op sales were recorded at a seasonally adjusted annual rate of 440,000 units in June, up 29.4% from May and down 22.8% from a year ago. The median existing condo price was $262,700 in June, an increase of 1.4% from a year ago.

“Homebuyers considering a move to the suburbs is a growing possibility after a decade of urban downtown revival,” Yun said. “Greater work-from-home options and flexibility will likely remain beyond the virus and any forthcoming vaccine.”

Regional Breakdown

In a complete reversal of the month prior, sales for June increased in every region. Median home prices grew in each of the four major regions from one year ago.

June 2020 existing-home sales in the Northeast rose 4.3%, recording an annual rate of 490,000, a 27.9% decrease from a year ago. The median price in the Northeast was $332,900, up 3.6% from June 2019.

Existing-home sales increased 11.1% in the Midwest to an annual rate of 1,100,000 in June, down 13.4% from a year ago. The median price in the Midwest was $236,900, a 3.2% increase from June 2019.

Existing-home sales in the South jumped 26.0% to an annual rate of 2.18 million in June, down 4.0% from the same time one year ago. The median price in the South was $258,500, a 4.4% increase from a year ago.

Existing-home sales in the West ascended 31.9% to an annual rate of 950,000 in June, a 13.6% decline from a year ago. The median price in the West was $432,600, up 5.4% from June 2019.

The National Association of Realtors® is America’s largest trade association, representing more than 1.4 million members involved in all aspects of the residential and commercial real estate industries.

# # #

For local information, please contact the local association of Realtors® for data from local multiple listing services (MLS). Local MLS data is the most accurate source of sales and price information in specific areas, although there may be differences in reporting methodology.

NOTE: NAR’s Pending Home Sales Index for June is scheduled for release on July 29, and Existing-Home Sales for July will be released August 21; release times are 10:00 a.m. ET.


1 Existing-home sales, which include single-family, townhomes, condominiums and co-ops, are based on transaction closings from Multiple Listing Services. Changes in sales trends outside of MLSs are not captured in the monthly series. NAR rebenchmarks home sales periodically using other sources to assess overall home sales trends, including sales not reported by MLSs.

Existing-home sales, based on closings, differ from the U.S. Census Bureau’s series on new single-family home sales, which are based on contracts or the acceptance of a deposit. Because of these differences, it is not uncommon for each series to move in different directions in the same month. In addition, existing-home sales, which account for more than 90% of total home sales, are based on a much larger data sample – about 40% of multiple listing service data each month – and typically are not subject to large prior-month revisions.

The annual rate for a particular month represents what the total number of actual sales for a year would be if the relative pace for that month were maintained for 12 consecutive months. Seasonally adjusted annual rates are used in reporting monthly data to factor out seasonal variations in resale activity. For example, home sales volume is normally higher in the summer than in the winter, primarily because of differences in the weather and family buying patterns. However, seasonal factors cannot compensate for abnormal weather patterns.

Single-family data collection began monthly in 1968, while condo data collection began quarterly in 1981; the series were combined in 1999 when monthly collection of condo data began. Prior to this period, single-family homes accounted for more than nine out of 10 purchases. Historic comparisons for total home sales prior to 1999 are based on monthly single-family sales, combined with the corresponding quarterly sales rate for condos.

2 The median price is where half sold for more and half sold for less; medians are more typical of market conditions than average prices, which are skewed higher by a relatively small share of upper-end transactions. The only valid comparisons for median prices are with the same period a year earlier due to seasonality in buying patterns. Month-to-month comparisons do not compensate for seasonal changes, especially for the timing of family buying patterns. Changes in the composition of sales can distort median price data. Year-ago median and mean prices sometimes are revised in an automated process if additional data is received.

The national median condo/co-op price often is higher than the median single-family home price because condos are concentrated in higher-cost housing markets. However, in a given area, single-family homes typically sell for more than condos as seen in NAR’s quarterly metro area price reports.

3 Total inventory and month’s supply data are available back through 1999, while single-family inventory and month’s supply are available back to 1982 (prior to 1999, single-family sales accounted for more than 90% of transactions and condos were measured only on a quarterly basis).

4 Survey results represent owner-occupants and differ from separately reported monthly findings from NAR’s Realtors® Confidence Index, which include all types of buyers. Investors are under-represented in the annual study because survey questionnaires are mailed to the addresses of the property purchased and generally are not returned by absentee owners. Results include both new and existing homes.

5 Distressed sales (foreclosures and short sales), days on market, first-time buyers, all-cash transactions and investors are from a monthly survey for the NAR’s Realtors® Confidence Index, posted at nar.realtor.

New York real estate market sees steep rise in listings | Mt Kisco Real Estate

After a difficult few months, New York City’s real estate market is bouncing back.

This week, after the city entered phase 2 of its reopening, contract activity increased 41%, reaching the highest numbers since the end of March, when the country shut down due to the coronavirus outbreak. New listings also increased 57% since last week, reaching a level not seen since March 2, according to data compiled by UrbanDigs.

Though listings are down 36% from this time last year, brokers are confident the slump in the market is temporary — and on its way out. “This is a remarkable recovery from the entire second quarter,” said Garrett Derderian, the CEO of GS Data Services.

“What we’re seeing is a lot of concern, but also a lot of pent-up demand,” Jason Haber of Warburg Realty told ABC News.

Derderian’s data shows the median list price of $1,395,000 is up 5% from this time last year, while the average price-per-foot is down just 3% to $1,560.

“What this tells us on a high level is the recovery on the listing side has started to take hold and is looking like the V-shape that was anticipated earlier this year,” he said.

The same can be said for the Seattle and Miami markets, the latter which has actually seen an increase in property trades compared to last year, as many in the Northeast — particularly in the hard hit tri-state area — continue to relocate to Florida.

Kolderal/Getty ImagesA residential street is seen in New York City.A residential street is seen in New York City.Kolderal/Getty Images

There have been 217 contracts signed in Manhattan since June 1, a decrease of 71% from this time last year. But this should not come as a surprise, given that the city just opened for in-person showings Monday.

Data sets put together by Derderian and Jesse Kent, the CEO of real estate public relations agency Derring-Do, show that prices have not gone down substantially despite the crisis.

“There has been wide speculation that prices were going to decline 10 to 20% in NYC real estate investments, but as of now, that is simply not the case,” said Derderian. “In fact, there may be a silver lining for the Manhattan housing market as workers may want to rely less on public transit and walk to work. This could bode well for many parts of Manhattan and result in price increases depending on the neighborhood and price point. The same is true for downtown Brooklyn and the immediate surrounding neighborhoods.”

If prices do go down, it will likely be in July, once there is more movement in the market.

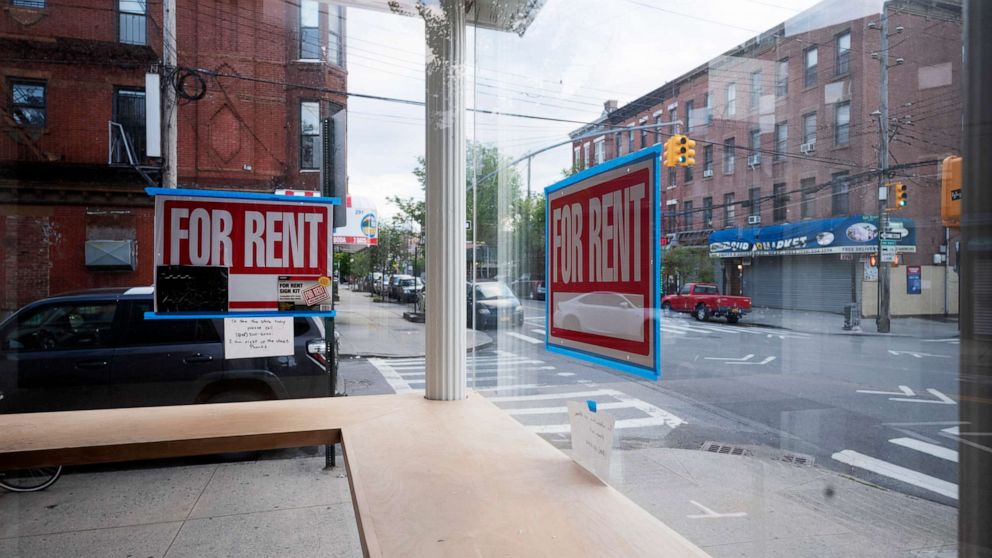
Mark Lennihan/AP, FileIn this May 12, 2020 photo, a storefront displays “For Rent” signs in the window in the Red Hook neighborhood of the Brooklyn borough of New York.In this May 12, 2020 photo, a storefront displays “For Rent” signs in the window in the Red Hook neighborhood of the Brooklyn borough of New York.Mark Lennihan/AP, File

Another thing that makes brokers optimistic is that the buyers who are currently looking seem to be fully committed.

“There are two types of people: short-term buyers who will likely not invest during the pandemic, and those who see the near-future potential and are looking to invest in the long term,” Haber said.

“Because there’s so much unknown right now, the profile of the buyer is someone who believes in New York long term,” said Michael J. Franco, from real estate broker Compass.

Even while the market appears to be recovering, Warburg Realty’s Bill Kowalczuk explained that the process of viewing and buying has changed due to the coronavirus.

Not only does a potential buyer have to schedule a viewing 24 hours in advance, but they have to wear personal protective equipment, sign a stack of forms acknowledging the health risks they’re taking and keep from touching any surfaces while inside the property (the agent has to open all cabinets and doors).

The documents potential clients must sign prior to attending a viewing include a limitation of liability form and a health questionnaire screening form. Though they’re not required by law, all Real Estate Board of New York members are asked to give them to their customers to ensure their safety.

Fueled by people’s eagerness to move forward, Kowalczuk said he expects a boom of market activity in the next six weeks.

read more…

abcnews.go.com/business

4 million Americans are now skipping their mortgage payments | Mt Kisco Real Estate

More than 4 million Americans have stopped making mortgage payments because of economic hardship caused by the coronavirus pandemic.

Fewer Americans are calling their mortgage servicers to ask for relief from mortgage payments, but the housing industry isn’t out of the woods yet.

More than 4.1 million homeowners are in forbearance plans now, according to the latest data from the Mortgage Bankers Association.

While mortgage servicers are still facing stress because of the record deluge of requests for payment relief, signs suggest that homeowners’ prospects have improved as parts of the country have begun to emerge from coronavirus stay-at-home orders.

How bad is it if I stop paying my mortgage during the pandemic?

Overall, 8.16% of all mortgages were in forbearance as of May 10, meaning borrowers can either skip or make reduced payments, the trade group said. That was up from 7.91% as of May 3, which is the smallest increase since March. Forbearance requests dropped from 0.52% of the total mortgage volume to 0.32%.

“There has been a pronounced flattening in loans put into forbearance — despite April’s uniformly negative economic data, remarkably high unemployment, and it now being past May payment due dates,” Mike Fratantoni, chief economist for the Mortgage Bankers Association, said in the report.

The potential exception to this trend is the segment of the market for loans backed by Ginnie Mae, including Federal Housing Administration (FHA) and Veterans Affairs (VA) loans. More than 11% of Ginnie Mae loans are in forbearance because of the coronavirus outbreak. These loans tend to go to borrowers who are first-time homeowners with weaker credit — people who could be more exposed to the economic downturn the pandemic has caused.

While the pace of homeowners requesting forbearance has slowed, the end of the mortgage industry’s troubles isn’t necessarily in sight. A recent report from U.K.-based economic forecasting firm Oxford Economics estimates that 15% of homeowners will fall behind on their monthly mortgage payments.

The outlook for homeowners will likely depend on their ability to bounce back, particularly for those who have lost their jobs. The good news for mortgage lenders is that job losses caused by the coronavirus have largely been concentrated in the service sector, according to a report from First American Financial FAF, 3.06% , a title insurance company. Because these jobs are lower skilled and lower paid, it’s less likely that the newly unemployed already owned homes.

read more…

www.marketwatch.com