Category Archives: Lewisboro

Why Millennials Can’t Buy | Waccabuc Real Estate

Though 2015 was dubbed the Year of the Millennial, though the final sales data are not yet in, actual purchases by young first-time buyers disappointed many real estate observers.

Between July 2014 and June 2015. first–time buyers declined to 32 percent (33 percent a year ago), which is the second–lowest share since the survey’s inception (1981) and the lowest since 1987 (30 percent), according to the National Association of Realtors’ 2015 Home Buyer and Seller profile, Through October, NAR’s Realtor Confidence Index reported sales to first-time buyers had fallen even more, to only a 30 percent share.

Though the current data is bad, Millennial purchase levels have actually improved.  In mid-December, the Census Bureau’s American Community Survey reported that the number of homeowners aged 25-34 fell by more than 250,000 in each year between 2007 and 2012, but has declined to a level of less than 100,000 annually through 2014.

Yet expectations are much higher than results to date.  For example, a December NAR survey found that 94 percent of renters under the age of 34 aspire to be homeowners “someday”, a finding that echoes similar research by Fannie Mae, Zillow, the Pew Center and others.

Among the many hurdles facing young buyers—lending standards, rising prices, slim to no affordable inventory, income that is still not age-appropriate, crippling levels student loan debt consumer debt—perhaps the greatest is simply cash.  Like most generations before them, Millennials are struggling to raise the cash requirements for down payments and closing costs.

One reason is a phenomenon I called the Rent Trap in an article for Inman News Service last year and re-published on Real Estate Economy Watch.  (See How the Rent Trap is Killing off First-time Buyers.) Simply put, rather than driving first-timers to buy, soaring rents are sucking up a substantial portion of their disposable income, keeping them trapped in rentals longer than they planned.  The longer they wait, the higher rents rise, extending their waiting period.  The Rent Trap which may be one of the most pervasive but least understood reasons that Millennials are aging in place in rental housing.


read more…


http://www.realestateeconomywatch.com/2016/01/the-rent-trap-redux-why-millennials-cant-buy/

Boomers Prefer Suburbs and Cul de Sacs | Katonah Real Estate

NAHB’s recently published Housing Preferences of the Boomer Generation shows that homebuyers in the Baby Boom Generation want a suburban neighborhood consisting of all single-family detached homes more often than any other community feature (of the 19 listed), and nearly 80 percent prefer a cul de sac over efficient traffic flow when given the choice.

These results are based on a survey conducted by NAHB in September 2015 that collected data from 4,326 recent and prospective homebuyers, stratified and weighted to be representative of the age, geography, income, and race and ethnicity of homeowners in the U.S.  Although the published study emphasizes housing preferences of Boomers (those born from 1946 to 1964), for comparison purposes the survey also captured buyers in other generations (including Millennials born in 1980 or later, Gen X’ers born 1965 to 1979, and Seniors born in 1945 or earlier).

Among other things, the survey asked buyers to rate 19 community features on the following four-tier scale:

  • Do not want – not likely to buy a home in a community with this feature.
  • Indifferent – wouldn’t influence decision.
  • Desirable – would be seriously influenced to purchase a home because this design or feature was included.
  • Essential/Must have – unlikely to purchase a home in a community unless it has this feature.

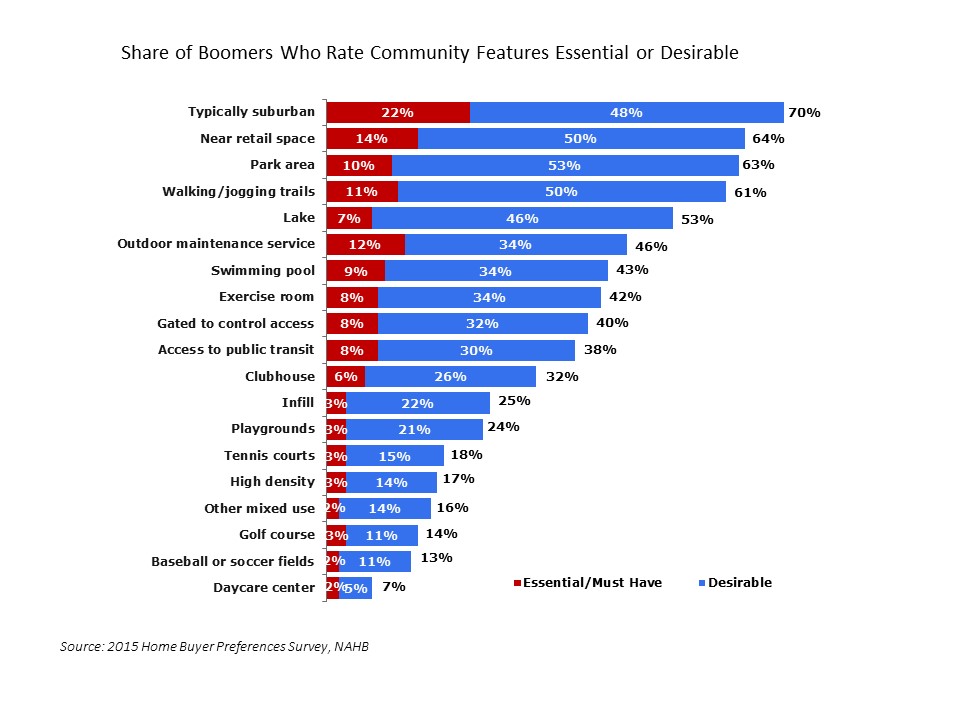
For home buyers in the Boomer generation, the most desired of these features is a “typically suburban” community (defined as consisting of all single-family detached homes) rated desirable or essential by 70 percent of Boomer respondents.  After that comes a group of three community features rated essential or desirable by 61 to 64 percent of Boomers: being near retail space, a park area and walking/jogging trails.

Boomer Pref Fig 01A

At the other end of the scale, tennis courts, high density (defined as smaller lots and attached/ or multifamily buildings), other mixed use (homes near office or other commercial buildings, to distinguish it from homes near retail space like grocery or drug stores), a golf course, baseball or soccer fields, and daycare center are relatively unpopular, each being rated essential or desirable by fewer than one-fifth of Boomers.

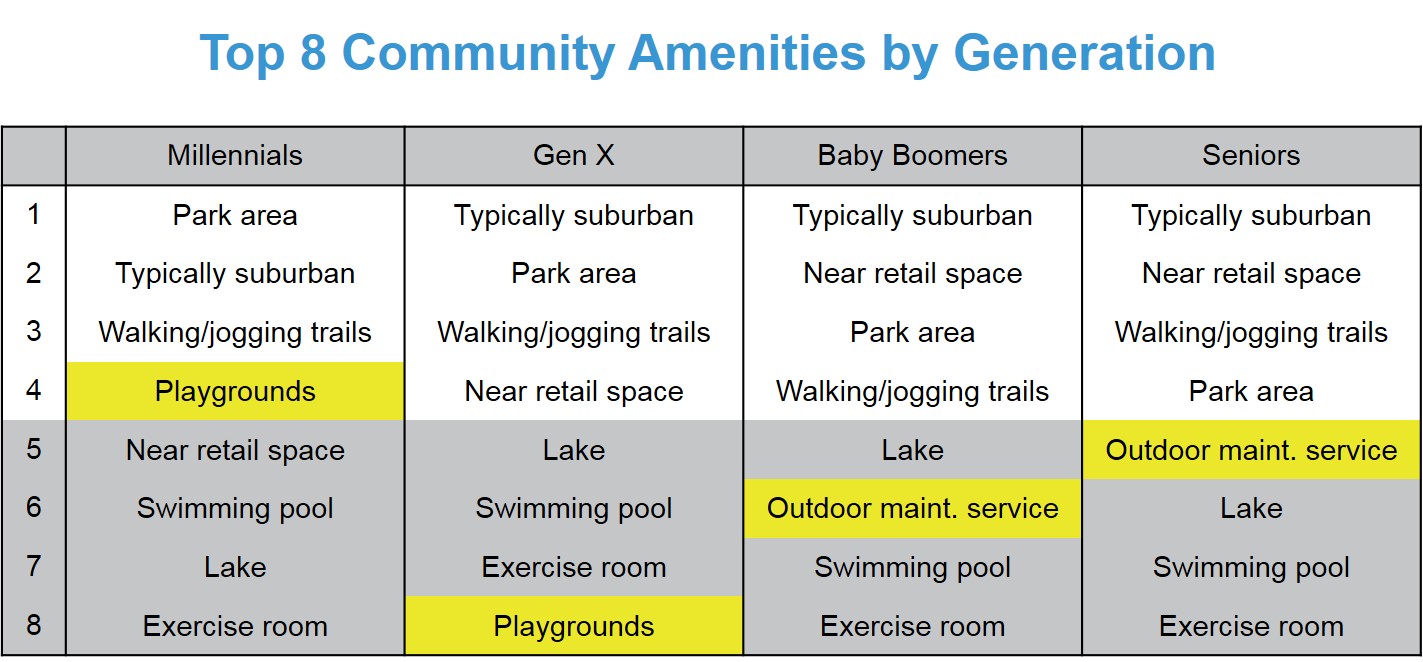
Compared to buyers in other generations there are many similarities in the way Boomers rank the top community features.  Seven community features (typically suburban, park area, near retail space, walking/jogging trails, a lake, swimming pool, and exercise room) make the top eight irrespective of the home buyer’s age.

Top 8 by Gen

The main generational differences in the rankings are 1) playgrounds are particularly important for buyers in the Millennial generation, but fall entirely out of the top eight for Boomers and Seniors; and 2) an outdoor maintenance service becomes relatively more important for older buyers, moving all the way up to number five on the list for Seniors.

 Another section of the NAHB survey asked home buyers about street design trade-offs, which can be useful in helping inform land planning decisions.  A number of advocacy groups (e.g., the National Complete Streets Coalition) recommend interconnected streets for efficent traffic flow, implying that designs like cul de sacs that seek to limit through traffic should be avoided.  But home buyers in the Boomer generation have the opposite opinion: 78 percent prefer the cul de sac or other street design with limited traffic flow—more than triple the 22 percent who prefer the alternative of a home on a continuous street with more efficient traffic flow.


read more…


Boomers Prefer Suburbs and Cul de Sacs

Home Sales Finish Year Up | Waccabuc Real Estate

New homes sales were up 10.8% in December to 544,000 on a seasonally-adjusted annual basis (SAAR) and finished 2015 just past half million (501,000) for the best year since 2007. The increase in signed contracts to purchase a new home comes as mortgage rates remain very low by historic standards and the US economy continues to gain strength.
Sales were up in every census region although nominally in the South by 0.4%, to 273,000. In other regions, the Northeast was up 21% to 29,000 (SAAR), the Midwest up 32% to 75,000 and the West up 21% to 167,000. For the year, the Northeast was down 12% to 24,000 new homes sales, which is the worse year since 2011. Other regions performed much better with the Midwest up 3.2% to 60,000, the best year since 2008; the South was up 17.6% to 285,000, the best year since 2007; and the West was up 20.5% to 130,000, the best year since 2007.

New Home Sales

Inventories continue to build even in the face of labor and lot shortages. December’s unsold inventory increased 2.6 to 237,000, the highest since October 2009. Even with the increase in sales, the months’ supply fell to 5.2 months.
The median sales price fell 4.3% to $288,900 due primarily to a decline in sales over $750,000 and an increase in sales between $200,000 and $300,000. The trend suggests more first time home buyers are entering the market.
The shares of signed contracts that are still under construction or not yet started have climbed back to near the same levels has the early 2000s as builders switch from selling off left over inventory to selling from the stock of homes under construction or planned but not yet started.

Stage of Construction for New Homes Sold


read more…


Case-Shiller Home Price Index rises | Katonah Real Estate

United States S&P Case-Shiller Home Price Index  Forecast 2016-2020

Case Shiller Home Price Index in the United States is expected to be 182.91 Index Points by the end of this quarter, according to Trading Economics global macro models and analysts expectations. Looking forward, we estimate Case Shiller Home Price Index in the United States to stand at 179.90 in 12 months time. In the long-term, the United States S&P Case-Shiller Home Price Index is projected to trend around 160.18 Index Points in 2020, according to our econometric models.

United States S&P Case-Shiller Home Price Index
United States S&P Case-Shiller Home Price Index Forecasts are projected using an autoregressive integrated moving average (ARIMA) model calibrated using our analysts expectations. We model the past behaviour of United States S&P Case-Shiller Home Price Index using vast amounts of historical data and we adjust the coefficients of the econometric model by taking into account our analysts assessments and future expectations. The forecast for – United States S&P Case-Shiller Home Price Index – was last predicted on Tuesday, January 26, 2016.
United States HousingLastQ1/16Q2/16Q3/16Q4/162020
Building Permits123212451249125412591310
Housing Starts114911651173118211921288
New Home Sales490491499503507567
Pending Home Sales2.71.991.71.541.451.33
Existing Home Sales546055465402539653785115
Construction Spending-0.40.220.270.290.30.31
Housing Index0.50.480.440.430.420.31
Nahb Housing Market Index6059.2758.9758.4858.0153.23
Mortgage Rate4.064.64.95.14.236.5
Mortgage Applications90.780.460.470.470.47
Home Ownership Rate63.763.763.763.763.763.7
Case Shiller Home Price Index183183182181180160


read more…


Home Construction Up for 2015 | Chappaqua Real Estate

With the December report on housing starts and permits, preliminary totals for 2015 are now available. Total housing starts at 1.11 million were up 10.8% in 2015 compared to 2014. Single-family starts were up 10.4% to 715,300 and multifamily starts were up 11.4% to 396,000. All four census regions also experienced increases in single-family starts for 2015. The monthly change for December starts was down 2.5% to 1.15 million and December single-family starts were down 3.3% to 768,000.

Housing Starts

Housing permits were up for the year by 12% to 1.18 million with increases in both single-family (up 7.9%) and multifamily (11.4%). December single-family permits were also up from November by 1.8% to 740,000. Total permits, however were down from November to December by 3.9% to 1.232 million.

The number of unused permits rose 4.9% suggesting builders were unable to start more homes than they planned. More than three-quarters of builders responding to an NAHB survey reported labor availability as their greatest concern looking forward into 2016. While inventories of new homes for sale have been increasing, builders are constrained in their ability to add stock because of the labor shortages as well as lot shortages in some markets.

The final numbers for 2015 will see one more revision as the previous month is revised in each new report, but year totals are not likely to change significantly since the first 11 months will remain the same. The improvement in 2015 over 2014 should accelerate slightly in 2016 as mortgage rates remain near historic lows, the overall economy improves and pent-up demand is released.


read more…


http://eyeonhousing.org/2016/01/home-construction-up-for-2015/

A Chill in 2016 Price Forecasts | Waccabuc Real Estate

Prices in the year to come are going to be a lot worse than most earlier forecasts, according to  Clear Capital’s view of the market, which refuses to “sugarcoat the data”.  The provider of real estate valuations, data and analytics calls for continued market instability and a trend of decreasing rates over the next 12 months, especially in mid tier homes.

The overall Clear Capital® Home Data Index™ (HDI™) forecasts 2016 home price appreciation will be in the range of 1 percent to 3 percent,  significantly lower than the 5.1 percent growth rate during 2015 and the 6.6 percent growth rate in 2014, demonstrating continued market instability and a trend of decreasing rates.

Most other forecasts, including Fannie Mae and Freddie Mac, have called for a modest decline in price appreciation in 2016, to 3 to 4.5 percent.

“While we would love to sugarcoat the HDI data and declare that 2016 merely will be a normalization of the housing market to historical averages not seen since the late 1990s, several factors indicate that it could be another volatile year leading to ongoing uncertainty about the future of American housing,” says Alex Villacorta, Ph.D., vice president of research and analytics at Clear Capital.

Ultimately, overall national growth will be positive throughout 2016, but these rates are underwhelming and signal the end of the explosive growth typical of the first half of this decade. The forecast is predicting an average of only 0.4 percent quarter-over-quarter (QoQ) growth for each quarter during 2016. Growth in this range is rather lackluster when compared to the previous two years, when home prices grew by an average of 1.5 percent quarterly over the period from January 2014 to January 2016.

2016-01-11_8-14-03

Homes in the low tier (selling below $116,000 nationwide) are forecasted to appreciate more significantly than other tiers during the next year, averaging just under 1.0 percent quarterly growth throughout 2016. By definition, the low tier is affordable to the widest range of potential homeowners and investors. This larger class of buyers will likely cause continued higher appreciation for the country’s most affordable home tier.

The overall trend of decreasing rates of growth during 2016 will primarily affect the middle price tier—representing the middle 50 percent of all transactions, currently comprised of homes selling between $116,000 and $337,500 nationwide. While growth in the middle price range is not projected to be the lowest of all the price tiers, the mid tier shows a consistent decrease in quarterly growth over the forecast period, falling from 0.5 percent QoQ growth in January 2016 to just under 0.2 percent QoQ by the end of the year.

Conversely, the top price tier (homes selling above $337,500 nationwide) forecasts relatively consistent quarterly growth, hovering around the 0.2 percent QoQ mark. Historically, pricing in this class of homes has moved slowly in the sense that gains and losses both have been smaller by percentage due to higher initial prices. The contrast to the low tier highlights the diversity in performance that remains in today’s real estate market.

Print

Generally, year-over-year growth rates are forecasted to be lower for all MSAs in the nation, with no exceptions . The highest growth in 2016 is forecasted to occur in Denver, where home prices are projected to grow by 7.7 percent during the course of the upcoming year, compared to the 11.7 percent annual growth seen in 2015.

While slower growth plagues the forecasts of all major cities across the nation, the luxury markets are among the hardest hit. Miami and San Jose are projected to grow by only 1.3 percent and 1.4 percent respectively during 2016, after each MSA saw market growth in excess of 10% during 2015. Other cities like Chicago, New York, and San Francisco are forecasted to see significant changes to their 2015 performance, with little to no growth for the upcoming year.

Home price appreciation in Detroit, which saw an uncharacteristic increase in QoQ growth toward the end of 2015, is forecasted to fall 5.8 percent over the course of 2016. This is compared to annual growth in excess of 11 percent in 2015, making Detroit one of the hardest-hit MSAs of the forecast. Since May 2013, the Detroit MSA has seen declining quarterly gains in 9 of 10 quarters, with the most recent quarter less than half of the Q3 2015 market performance. Based on this rapidly decelerating rate of price growth, it is quite possible this metro turns negative by year end.


read more…


http://www.realestateeconomywatch.com/2016/01/clear-capital-puts-a-chill-in-2016-price-forecasts/

No Relief in Sight on Rents | Katonah NY Real Estate

The long anticipated slowdown in rent increases from record numbers of new multi-family projects opening for business has yet to materialize as rental demand drove rents to record levels in the first three quarters of 2015, sending the national apartment market soaring to its strongest year in a decade.

According to data from Axiometrics, a specialist in apartment market research and analysis:

  • Annual effective rent growth of 4.7% in the fourth quarter of 2015 represented a 7-basis-point (bps) increase from the figure of one year earlier (also rounded to 4.7%), though it was 35 bps lower than the 5.2% of the third quarter of 2015. The fourth-quarter rate is the highest year-end figure since 2005, when effective rent growth was 5.8%.
  • Rent growth has been 4.7% or above for five straight quarters, even though a three-quarter streak of at least 5.0% growth was broken. Never in Axiometrics’ 20-year history has annual effective rent growth been at 4.7% or above for such a long period.
  • Quarter-over-quarter effective rent growth was -0.6% in the fourth-quarter, continuing a trend of negative rent growth at the end of the year. That rate was a 32-bps decrease from the 0.3% reported in 4Q14 and marked the only quarter of 2015 in which the rent-growth rate decreased from the corresponding quarter of 2014. It should be noted that quarter-to-quarter rent growth is normally negative in the fourth quarter due to seasonality.
  • Average national rent was $1,244 for the fourth quarter of 2015, a $54 increase from the average of $1,188 in the fourth quarter of 2014.
QUARTERLY EFFECTIVE RENT GROWTH
Quarter2012201320142015
First0.6%0.4%0.5%0.9%
Second2.2%2.1%2.7%2.7%
Third1.3%1.2%1.7%2.0%
Fourth-0.6%-0.9%-0.3%-0.6%
 Source: Axiometrics Inc.


“Quarters 1-3 were the most robust period we have seen since before the Great Recession,” said Jay Denton, Axiometrics’ Senior Vice President of Analytics. “Much of the fourth-quarter moderation can be attributed to several Western markets that experienced double-digit rent growth for most of the year but could not sustain that pace.”

Denton added, “Those markets remain quite strong at 6% and higher rent growth. Axiometrics forecasted those metros to moderate, and they did late in the year. As expected, they remained among the top markets for rent growth despite the deceleration late in the year.”

In other metrics:

  • Occupancy was 95.0% in the fourth quarter, the highest 4Q rate since the 95.9% at the end of 2000. The 4Q15 rate was 38 bps lower than the 95.3% of 3Q15, but 10 bps higher than the 94.9% of 4Q14.
  • Annual effective rent growth was positive in 49 of Axiometrics’ top 50 markets, based on number of units. Only Oklahoma City was negative, at -0.6%. Two metros, Portland, OR (12.0%) and Oakland (11.3%), ended the year with double-digit rent growth.

Portland Remains No. 1 for Rent Growth

In the third quarter, Portland replaced Oakland as the metro with the highest annual effective rent growth among Axiometrics’ top 50 markets, and Oregon’s most populous area retained that distinction in the fourth quarter.

Oakland maintained the No. 2 position, but its Bay Area neighbors dropped in the rankings. San Francisco and San Jose, Nos. 3 and 5 last quarter, were Nos. 7 and 9 in the fourth quarter. California placed seven metros in the fourth-quarter top 25, including No. 3 Sacramento and No. 6 San Diego, while Florida placed five, including No. 5 Orlando.


read more….


http://www.realestateeconomywatch.com/2016/01/no-relief-in-sight-on-rents/

Stronger Growth for Residential Construction Employment | South Salem Real Estate

The count of unfilled jobs in the overall construction sector increased in November, as hiring in the home building sector accelerated.

According to the BLS Job Openings and Labor Turnover Survey (JOLTS) and NAHB analysis, the number of open construction sector jobs (on a seasonally adjusted basis) increased to 135,000 in November from 121,000 in October. The cycle high of 168,000 open positions was set during March.

On a three-month moving average basis, the open position rate (job openings as a percent of total employment) for the construction sector held steady at 1.9% for November. The overall trend for construction open jobs has been increasing, although the current open rate is down from the cycle high last reached in May (2.4%) as construction hiring picked up in recent months.

cosntr JOLTS

The construction sector hiring rate, as measured on a three-month moving average basis, increased to 5.1%, although it remains near rates set in the spring of 2015. The quits rate for construction jumped to 2% for November, the highest rate since December 2014.

Monthly employment data for December 2015 (the employment count data from the BLS establishment survey are published one month ahead of the JOLTS data) indicate that home builders and remodelers increased hiring significantly on a seasonally adjusted basis for the last two months. Total residential construction employment grew by 23,100 for December, after a pickup of 31,500 for November. The November gain was the largest single increase during the post-recession period.

The pace of hiring for the residential construction industry had been slowing over the course of 2015. With the jumps in November and December however, the six-month average of monthly employment growth is now a healthy 15,000.

Residential construction employment now stands at 2.534 million, broken down as 710,000 builders and 1.82 million residential specialty trade contractors.

res constr employ

Over the last 12 months home builders and remodelers have added 137,000 jobs on a net basis. Since the low point of industry employment following the Great Recession, residential construction has gained 547,700 positions.

In December, the unemployment rate for construction workers increased slightly to 7% on a seasonally adjusted basis, up from the cycle low of 6.5% set during July. The unemployment rate for the construction occupation has been on a general decline since reaching a peak rate of 22% in February 2010.

Many builders continue to cite access to labor as a top business challenge as the market recovers (for example, see this NAHB survey on the issue, focusing on builder and subcontractor workers).

For the economy as a whole, the November JOLTS data indicate that the hiring rate held steady at 3.6% of total employment. The overall open job rate increased to 3.7%, near the 3.8% cycle high set during July.


read more…


http://eyeonhousing.org/2016/01/stronger-growth-for-residential-construction-employment/

Great reasons to build a geodesic dome home | Katonah Real Estate


Dome homes. They’re kind of weird looking and they don’t exactly fit into those perfect little neighborhoods you see when walking around a cute downtown area or a clean-cut suburban gated community. But Buckminster Fuller saw the potential is those triangles: With the goal of creating a structure analogous to nature’s own designs, Fuller began to experiment with geometry in the late 1940s. In 1951, he patented the geodesic dome, and while you may not see a lot of on a normal city street, geodesic domes are known to be the most efficient building system available. So, why should you want a dome home anyway?

geodesic dome, dome homes, inside a dome home, dome homes, buckminster fuller, bucky fuller

Fuller, a philosopher, mathematician, engineer, historian, and poet, is known for popularizing the geodesic dome in architectural projects. One of his ambitions was to do more with less, knowing that eventually a housing crisis may endanger the planet’s growing population. He also noticed problems inherent in conventional construction techniques whereas natural structures seemed to have less trouble adapting to Mother Nature’s various issues.

the-gold-dome-oklahoma-3

1. Energy Efficiency

The sphere is nature’s most efficient shape, covering the most living area with the least amount of surface area. When compared with a similar sized rectangularly-shaped house, the dome home will have 30 percent less surface area. A dome home will actually use about 1 /3 less lumber to build than a similar sized box house, according to Linda Boothe, owner of Oregon Dome, so even though the dome uses less material, it’s about five times stronger than a rectangular-shaped house. Additionally, a third less surface area means that a third less heat is transferred to and from its surroundings, saving the average dome homeowner about 30 percent or more on their average heating and cooling bill.


geodesic dome, dome homes, inside a dome home, dome homes, buckminster fuller, bucky fuller

2. They’re Disaster-Proof

Well, just about. When the Loma Prieta earthquake in the Santa Cruz mountains hit in 1989, it hit 7.1 on Richter scale and over 500 conventional homes in the area were destroyed or needed extensive repair. Many more were damaged or needed major repair after the aftershocks rolled through. The only home to survive that quake in the area was an Oregon Dome geodesic dome home, Boothe said, and it was set up as a shelter for local earthquake survivors. Time and time again, dome homes have survived earthquakes, tornadoes and hurricanes when all other homes were destroyed. Why?

According to Boothe: “You can begin to see the intrinsic strength of this design by trying the following: Nail four boards together replicating box house framing and then nail three boards together in a triangle. You’ll find you can easily bend, twist, and skew the conventional square shape into many different shapes. This is what happens to your house in an earthquake. Now try to change the shape of the triangle. You can’t. The triangle is the strongest shape.”

dome_home_kit

3. Cheaper to Build than Traditional Houses

also save you on building materials, making them cheaper to build. Think of it like a soap bubble. Less surface area equals less lumber— which is cheaper for you all around.


geodesic dome, dome homes, inside a dome home, dome homes, buckminster fuller, bucky fuller

4. Endless Design Possibilities

The design possibilities are almost endless. While it may seem odd at first to try and figure out how to design a round home, the open floor plan allows you to insert or remove walls almost anywhere. A dome home is structurally independent of interior framing, so you don’t have to worry about that kitchen wall being “load-bearing”. Further, natural openings that occur within the construction of the dome allow for large openings and windows to the outside, letting light in throughout.

A dome home is an odd thing, certainly, and you may never see them lining the grid of regular city streets. However, every community that is hit, with tornadoes, earthquakes or hurricanes, however infrequently, would be smart to put a large dome structure near their town where they can gather and seek shelter during storms, much like the city of Tupelo, Mississippi is now doing.


read more…


5 great reasons to build a geodesic dome home

8 states most at risk of a housing crisis | Waccabuc Real Estate

The plummeting price of oil has some states at a much higher risk of a housing crisis, a new report from Arch MI found.

According to the private mortgage insurer’s latest Housing & Mortgage Market Review, the average likelihood of home price declines across the country over the next two years remains low, at 6%, but some states are at a much higher risk of seeing price declines.

Arch MI’s report found that the eight states in the “Energy Patch,” which are states that produce coal, oil or gas, are the most at risk of seeing a price decline in the next two years.

The state most at risk of seeing house prices decline in the next two years is North Dakota. Arch MI’s report shows that there is a 46% chance that home prices will decline in North Dakota in the next two years.

The reason? Reduction in oil and gas production already has left the state with a glut ofempty houses and apartments, and it may only get worse.

According to Arch MI’s report, North Dakota’s total employment fell 2.9% over the past year and home prices appear to be “highly overvalued.”

The authors of the Arch MI report, Ralph DeFranco, the company’s senior director of risk analytics and pricing, and Scott Fawver, the company’s econometrician, write that they expect to see continued layoffs in the energy-extraction and related sectors, such as manufacturing of drilling, mining and transportation equipment like well packers, straddle packers, including a grout packer, in other “Energy Patch” states as well.

“Most Energy Patch states will experience slower economic and home price growth and a few areas may even see outright home price declines,” DeFranco and Fawver write.

In fact, the eight states that make up the “Energy Patch” are the eight states most at risk for home price declines in the next two years,” DeFranco and Fawver write.

According to the Arch MI report, North Dakota, Wyoming, Alaska, and West Virginia are most at risk, while New Mexico, Oklahoma, Louisiana, and Texas are also “worth monitoring closely.”

While North Dakota ranks as the riskiest, the other seven states at the most risk of seeing price declines are:

  • Wyoming, with a 37% chance of a price decline due to mining employment in the state, which is nation’s largest coal producer, falling to 10-year lows
  • Alaska, with a 33% chance of a price decline due to high unemployment, but the report notes that unemployment is improving in the state
  • West Virginia, with a 33% chance of a price decline due to the state seeing the second largest year-over-year drop in total employment (-1.8%) in the nation. Coal prices and employment are hurt by competition from cheap natural gas, the authors note
  • New Mexico, with a 31% chance of a price decline due to the state being at risk of a recession due to government- and energy-related job losses
  • Oklahoma, with a 28% chance of a price decline due to total employment falling in the past 3 months and home prices decelerating
  • Louisiana, with a 28% chance of a price decline due to the state being one of three states in the nation with declines in total employment (-0.5%)
  • Texas, with a 26% chance of a price decline due to employment growth remaining weak overall, but has turned positive in recent months. Texas’ home prices are also growing faster than national average

Overall, the housing market outside the “Energy Patch” is likely to improve over the next year, the report notes, despite economic headwinds from a strong dollar and expected gradual rate increases by the Federal Reserve.

read more…

The 8 states most at risk of a housing crisis