Category Archives: Katonah

Refis could see uptick in second and third quarters | Katonah Real Estate

In the first quarter of 2017, refinances fell 45% from the fourth quarter, however the second and third quarters could see a turnaround in refi activity, according to a first look at Black Knight’s soon to be released Mortgage Monitor.

This chart shows refinance activity each week from October through June as refinance candidates fell from 8.6 million to 4.4 million.

Click to Enlarge

Black Knight

(Source: Black Knight)

Since interest rates fell below 4%, the financeable population rose to its highest point for 2017. While the current 4.4 million borrowers is down significantly from October, it is an increase of 56% or 1.6 million borrowers from mid-March’s low.

Borrowers who refinanced in the first quarter of 2017 cut their monthly mortgage payments by an average of $109 per month, or a total aggregate savings of $36.5 million per month. This marks the lowest total monthly savings since 2008 and a decrease from the fourth quarter’s $59 million.

But since the first quarter, savings have increased once again to a total of $1.1 billion or $260 per borrower each month.

This chart shows the total monthly savings borrowers saw each month.


read More…

Refis could see uptick in second and third quarters

Geothermal heating | Katonah Real Estate

It is cooler than the air in the summer and warmer in the winter. The earth’s subsurface is an enormous heat sink — a solar battery — and it takes a large amount of energy to keep it in equilibrium. This heat energy comes in great part from the sun, a renewable and inexhaustible source of energy. In lesser amounts, it also comes from the center of the earth that we now know is a heat generator. The inner core of the earth is primarily made of a solid sphere of iron within a larger sphere of molten iron. Calculations show that the earth, originating from a molten state many billions of years ago, would have cooled and become completely solid without an energy input. It is now believed that the ultimate source of this energy is radioactive decay within the earth that continues to this day; the decay produces gradually diminishing temperatures from the earth’s center to the surface. This does not mean that dangerous radioactivity is a hazard to us. We can tap into all of this heat energy, transfer it into our home for heating and return that energy back to the earth during cooling: thus we are really borrowing heat from the earth.

Geothermal units use the same 100-year-old technology found in your refrigerator. They are both devices that move heat energy. It is worth noting that the refrigerator is the most reliable, longest-life appliance in your home. As the diagram in the slideshow explains, a refrigerator removes heat energy from food and moves it into your kitchen. A geothermal system removes heat energy from the earth to heat your home and in the summer removes heat energy from inside your home back to the earth.

Heat naturally flows “downhill” from the warmest medium to the coolest medium. A heat pump is a machine that causes heat energy to flow in the direction opposite from its natural tendency, or “uphill” in terms of temperature. Because work must be done (energy must be applied) to accomplish this, the name heat “pump” is used to describe the device.

A refrigerator and a heat pump are about the same physical size, are quiet appliances usually contained within a single enclosure, have similar components (compressor, evaporator, etc.), and both transfer heat energy. And they each require a refrigerant, a material used in a refrigeration cycle which undergoes a phase change from a gas to a liquid, and back again.

read more…

http://www.motherearthnews.com/renewable-energy/energy-efficiency/geothermal-heat-system-ze0z1704zols?newsletter=1&spot=headline&utm_source=WhatCountsEmail&utm_medium=email&utm_campaign=MEN%20GEGH%20eNews%2006.16.17&utm_term=MEN_GEGH_eNews&_wcsid=24FE5BB810FAD26243359F90C7740FB292B789E42357F9D3

New home sales rise | Katonah Real Estate

New home sales increased in May, partially reversing the previous month’s decrease, according to the latest report from the U.S. Census Bureau and the U.S. Department of Housing and Urban Development.

Sales of new single-family homes in May increased to a seasonally adjusted annual rate of 610,000 home sales, the report showed. This is an increase of 2.9% from April’s 593,000 and is 8.9% above last year’s 560,000 sales.

Click to Enlarge

Home sales

(Source: HUD, U.S. Census Bureau)

The median sales price of new homes sold increased from last month’s $309,200 to $345,800 in May. The average sales price for new homes sold came in at $406,400 for the month.

The seasonally adjusted estimate of new homes for sale at the end of May came in at 268,000 homes, the same as the previous month. However, with the faster sales pace, this represents a 5.3-month supply, down from April’s 5.7 months.


read more..

New home sales reverse course, increase in May

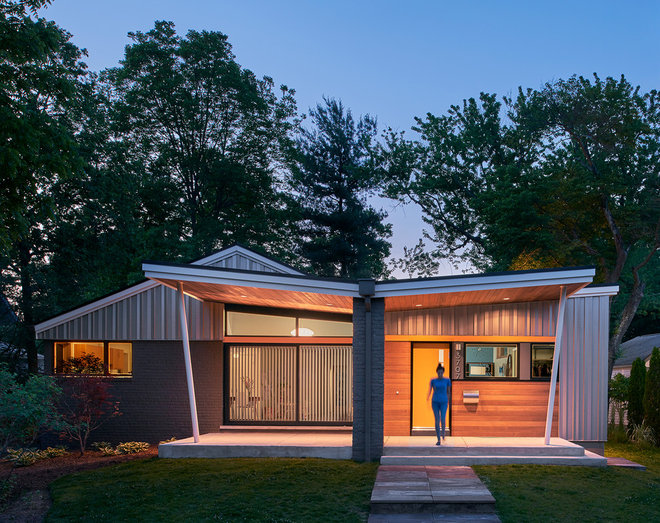
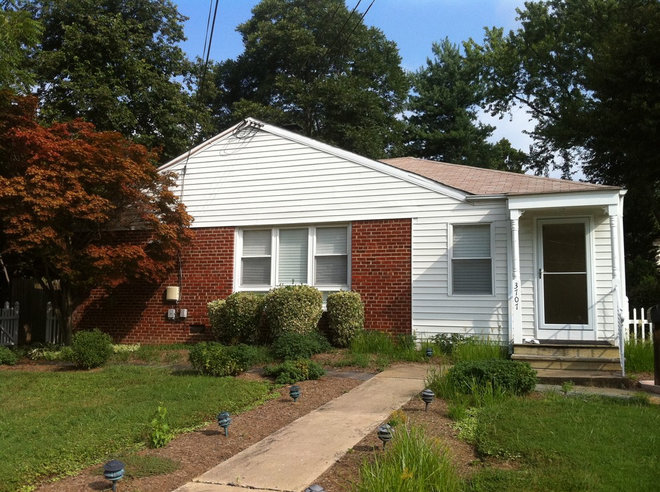
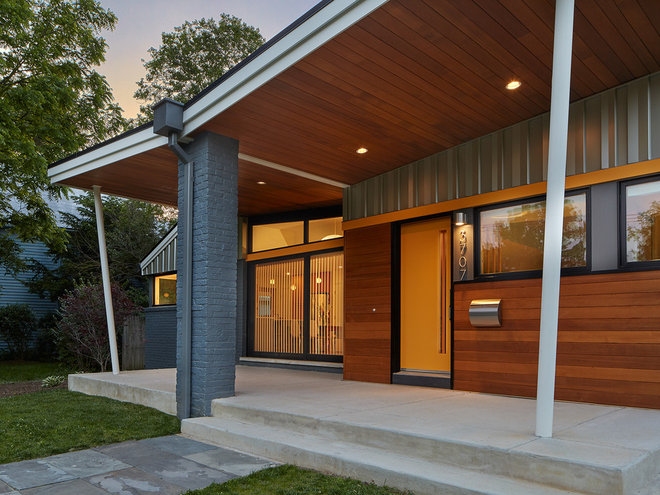
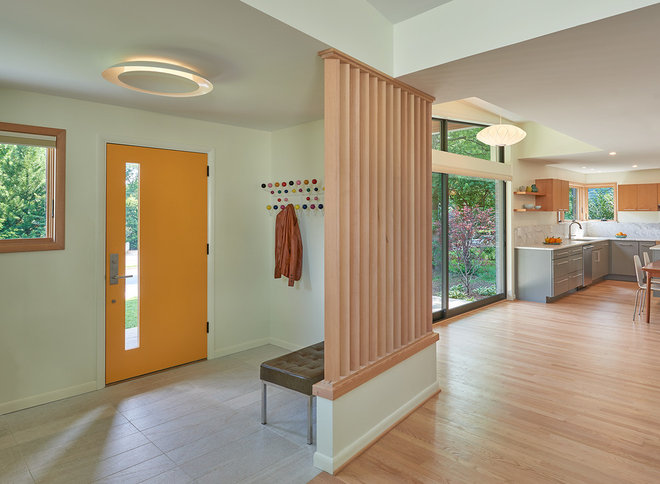
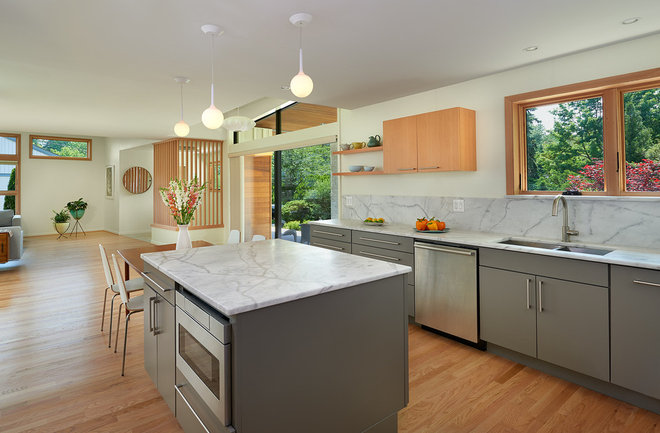
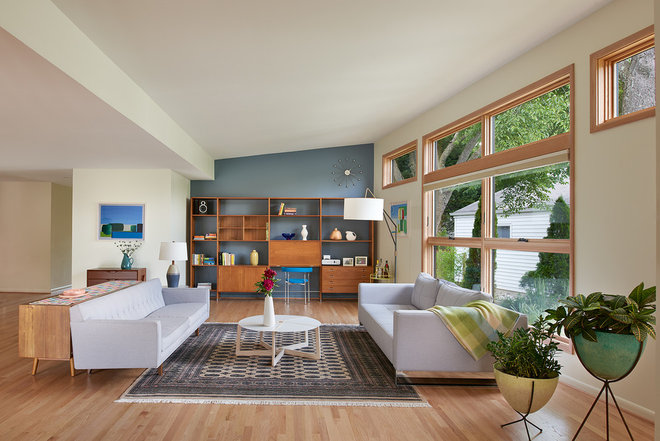
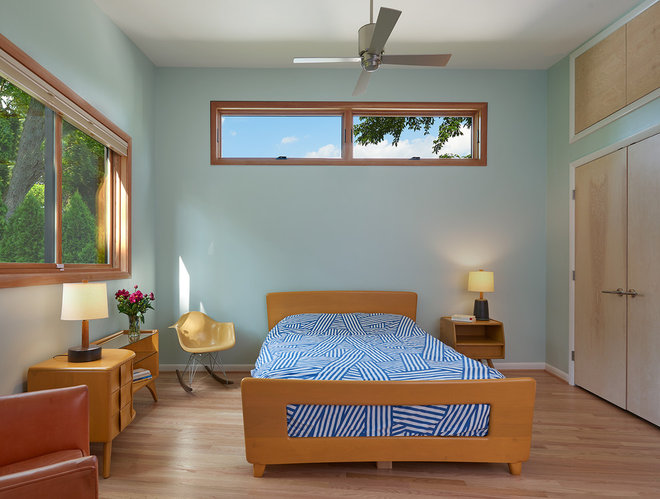
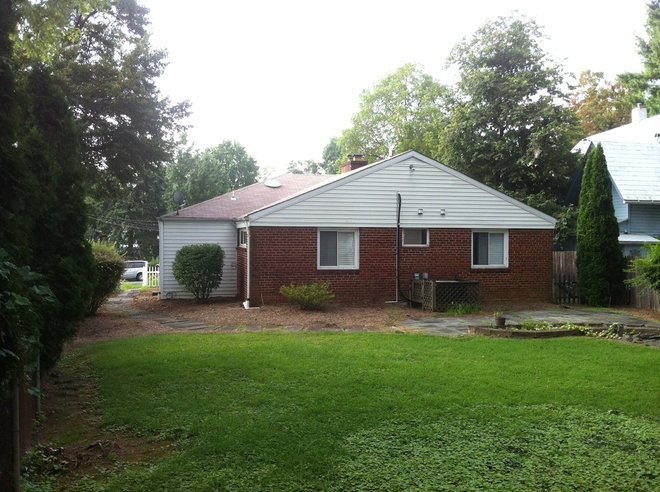
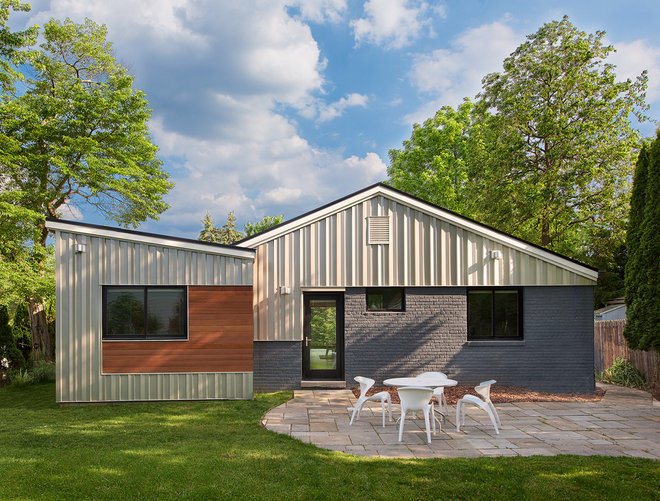
Midcentury Rambler to Modern Marvel | Katonah Real Estate

read more…
https://www.houzz.com/ideabooks/86019019?utm_source=Houzz&utm_campaign=u5443&utm_medium=email&utm_content=gallery3&newsletterId=5443

America’s Cities Are Running Out of Room | Katonah Real Estate

A shortage of homes for sale has bedeviled U.S. house hunters in recent years, so why don’t builders build more? One problem is that they’re running out of lots to build on—at least in the places that people want to live.

Cities that were sprawling before the Great Recession have begun to sprawl again. Space-constrained cities, meanwhile, have run out of room to build. That reality has spurred developers to focus on center-city neighborhoods where high-density building is allowed—and new units command exceedingly high prices.

At some point, said Issi Romem, chief economist at BuildZoom, vacant lots in desirable urban neighborhoods will run out. “If you have three days of rations left, you’ll be fine on day one, two, three,” said Romem, author of new research demonstrating home construction patterns. “On day 4, you have a problem.”

Historically, cities grew outward, as builders developed tracts on the periphery—then filled in the land between various developments over time. When these so-called expansive cities of the South and Southwest run out of infill land on which to build, developers simply pushed out further.
Some of these cities, like Austin and Nashville, have seen downtown boomlets. But more broadly, the building trends in those metros looks more like Dallas: Inside a 30-mile radius from the center of the city, new home sales decreased from 2000 to 2015. Outside the radius, though, sales are up by more than 50 percent. The same trend has played out to varying degrees in Phoenix, Atlanta, and San Antonio, among other cities.

In America’s most expensive cities, however, that dynamic has been turned inside out (or perhaps outside in). New construction trends in places like New York City have been tightly focused on downtown clusters where zoning rules permit high-density construction. These cities stopped expanding their geographic footprint decades ago, leaving builders to concentrate on finding buildable lots inside existing boundaries. As those lots became harder to find, land prices increase, reducing options for builders hoping to turn a profit. Developers building on pricey lots generally seek to offset land prices by building more densely, Romem said. In many cases, that means focusing on high-end apartments that offer better profit margins. The wealthiest residents are the only ones who can buy, and a vicious cycle is created.

Lately, there has been some give as oversupply of new high-end apartments forces landlords in New York and San Francisco to drop prices on expensive aeries. Still, the broader pattern continues to lean in the direction of higher rents.

What happens next depends on whether voters and their elected officials rewrite zoning rules to allow denser construction, said Romem, particularly in neighborhoods currently limited to single-family homes. Under current rules, he said, it’s unlikely new housing will get built at affordable prices, pushing city-dwellers into a game of musical chairs rigged to favor the rich.

“As long as these cities continue to do well economically, you’re going see poorer folks replaced by richer folks,” he said. “You’re going to read stories about teachers not being able to find place to live.”

read more…

bloomberg.com

Katonah village survey | Katonah Real Estate

KVIS Town Forum Survey 2017

1. How strong is the sense of community in Katonah?

0

2. What new businesses or stores would you like to see in town?

3. To limit noise pollution, Maplewood, New Jersey recently passed an ordinance limiting the use of gas powered leaf blowers. Would you support a similiar ordinance?

4. What new events would you like to see in town?

5. How easy is it to find parking when you shop/dine in Katonah?

6. Speeding on area roads is frequently raised as a safety concern. Would you support the use of “speed cameras” as a method of enforcing speed limits?

7. How many years have you lived in Katonah?

8. How well are the streets and roads in Katonah maintained?

9. A group of residents has proposed the building of a bicycle pump track in Katonah Memorial Park which is currently being reviewed by the Parks Advisory Committee. Do you support this proposal?

10. Would you favor a ban of single-use, carryout plastic bags by retailers in the Katonah and at special events in town?

Builder Confidence Continues on Upward Trend | Katonah Real Estate

In a further sign that the housing market continues to strengthen, builder confidence in the market for newly-built single-family homes rose two points in May to a level of 70 on the National Association of Home Builders/Wells Fargo Housing Market Index (HMI). This is the second highest HMI reading since the downturn.

The HMI measure of future sales conditions reached its highest level since June 2005, a sign of growing consumer confidence in the new home market. Especially as existing home inventory remains tight, we can expect increased demand for new construction moving forward.  Builders, however, continue to deal with shortages of lots and labor and increasing building material costs.

Derived from a monthly survey that NAHB has been conducting for 30 years, the NAHB/Wells Fargo Housing Market Index gauges builder perceptions of current single-family home sales and sales expectations for the next six months as “good,” “fair” or “poor.” The survey also asks builders to rate traffic of prospective buyers as “high to very high,” “average” or “low to very low.” Scores for each component are then used to calculate a seasonally adjusted index where any number over 50 indicates that more builders view conditions as good than poor.

Two of the three HMI components registered gains in May. The index charting sales expectations in the next six months jumped four points to 79 while the index gauging current sales conditions increased two points to 76. Meanwhile, the component measuring buyer traffic edged one point down to 51.

The three-month moving averages for HMI scores posted gains in three out of the four regions. The Northeast and South each registered three-point gains to 49 and 71, respectively, while the West rose one point to 78. The Midwest was unchanged at 68.


read more…


http://eyeonhousing.org/2017/05/builder-confidence-continues-on-upward-trend/

Cash Finances Smallest Share of New Home Sales Since 2010 | Katonah Real Estate

NAHB analysis of the most recent Quarterly Sales by Price and Financing published by the Census Bureau reveals that just 4.7% of new home sales in the first quarter of 2017 were purchased with cash—down from the most recent peak of 9.5% in the fourth quarter of 2014. In contrast, the share of new home sales financed with conventional mortgages rose to 72.0%, its second-highest share since the fourth quarter of 2014. Meanwhile, FHA loan market share continued its upward trend, rising from14.4% to 14.7%.

Census data and NAHB calculations show that new home sales backed by VA products rose to 22,000 (+4,000) in the first quarter of 2017, though market share fell from 8.8% to 8.1%. The market share of VA loans averaged just 2.9% between the 2001 recession and the Great Recession, but has averaged 9.3% since the U.S. economy came out of recession in 2009.

It is worth adopting some caution associated with the Census market share estimates. In particular, the statistical error associated with the FHA, cash, and VA sales estimates from this data set are relatively high. This reduces the reliability of measures of short-term market changes.

Mindful of this limitation, over the long run the current FHA share is roughly one-half the 28% share determined for the first quarter of 2010 but still elevated compared to the 2002-2003 average of 10%.

Although cash sales make up a small portion of new home sales, they constitute a considerably larger share of existing home sales. In February 27% of existing home transactions were all-cash sales—the highest share since November 2015—according to estimates from the National Association of Realtors.

It is also worth noting that a different measure from CoreLogic shows a higher market share for cash sales for new construction: 17.7% in January.

FHA-backed loans were responsible for 14.7% of new home sales during the first quarter of 2017. Although the share has increased in two consecutive quarters, it remains more than twice its pre-recession average of 6.4%.

Conventional financing has expanded as the housing recovery has grown. The market share of new home sales with conventional financing was 62.2% in 2009 and 72.0% in the first quarter of 2017. This share has remained between 68% and 75% over the past four years.


read more…


http://eyeonhousing.org/2017/05/cash-finances-smallest-share-of-new-home-sales-since-2010/

Remodeling Market Remains Positive in Fourth Quarter | Katonah Real Estate

The National Association of Home Builders’ (NAHB) Remodeling Market Index (RMI) dropped 4 points to 53 from the previous quarter, but remained above the breakeven point of 50, which indicates that more remodelers report activity is higher (compared to the prior quarter) than report activity is lower. Although the RMI declined, it is consistent with levels seen in the first half of 2016. The RMI has been at or above 50 for 15 consecutive quarters (Figure 1).

The overall RMI is an average of two main sub-indices, one that tracks current market conditions and another tracking future market conditions. In the fourth quarter, the current market conditions index dropped 3 points to 53, but is still consistent with readings from earlier this year (Figure 2). Among its components, major additions and alterations dropped one point to 53, demand for smaller remodeling projects decreased four points to 52, and the home maintenance and repair component declined by five points to 54.

The future market indicators decreased six points to 52, which also marks a return to levels seen earlier this year (Figure 3). Among its four components, calls for bids and appointments for proposals fell to 49 and 54, respectively, the backlog of remodeling jobs dropped three points to 55, and the amount of work committed declined five points to 50.

The RMI level is in line with the NAHB’s remodeling forecast, which predicts that remodeling activity will grow at a moderate pace of 1 to 2% annually over the next two years. For more information about remodeling, including detail tables of this quarter’s results, visit nahb.org/rmi.


read more…

http://eyeonhousing.org/2017/01/remodeling-market-remains-positive-in-fourth-quarter/

Regulation is 24.3 Percent of the Average New Home Price | Katonah Real Estate

An NAHB study shows that, on average, regulations imposed by government at all levels account for 24.3 percent of the final price of a new single-family home built for sale.  Three-fifths of this—14.6 percent of the final house price—is due to a higher price for a finished lot resulting from regulations imposed during the lot’s development.  The other two-fifths—9.7 percent of the house price—is the result of costs incurred by the builder after purchasing the finished lot.

Reg Post 01NAHB’s previous 2011 estimates were fairly similar, showing that regulation on average accounted for a quarter of a home’s price.  However, the price of new homes increased substantially in the interim.  Applying percentages from NAHB’s studies to Census data on new home prices produces an estimate that regulatory costs in an average home built for sale went from $65,224 to $84,671—a 29.8 percent increase during the roughly five-year span between NAHB’s 2011 and 2016 estimates.

Reg Post 02In comparison, during that time, disposable income per capita in the U.S. increased by 14.4 percent.  In other words, the cost of regulation in the price of a new home is rising more than twice as fast as the average American’s ability to pay for it.

The above estimates are based largely on questions included in the survey for the March 2016 NAHB/Wells Fargo Housing Market Index, combined with long-run assumptions about average construction times, interest rates, profit margins, etc.  The survey questionnaire and an appendix describing each additional assumption and the data on which it’s based can be found in the full study.  The full study also contains substantial additional detail on the different types of regulatory costs and where and how they impact the development-construction process.


read more…


http://eyeonhousing.org/2016/12/top-posts-of-2016-regulation-is-24-3-percent-of-the-average-new-home-price/