Category Archives: Katonah

Sales of unbuilt homes hover near a 10-year high | Katonah Real Estate

The latest new home sales report presents a more positive forecast on the future of today’s current inventory crisis after several industry reports give strong concerns over the market’s daunting lack of inventory.

In Trulia Chief Economist Ralph McLaughlin’s analysis of Wednesday’s new home sales report, he explained that the share of new home sales not started, in other words homes purchased off a plan, hovers near a 10-year high.

“Why? The inventory of existing homes continues to fall. Low existing inventory likely pushes prospective buyers away from existing homes towards new homes, and as new home sales rise, this allows builders to sell more new homes off plan,” McLaughlin said.

Click to enlarge

new home sales one

(Source: Trulia Chief Economist Ralph McLaughlin)

The housing market can’t seem to get past the inventory shortage that keeps penetrating into all crevasses of the industry. And while this won’t change this year, there may be hope for next year as builders start to play catch-up, a Fitch Ratings report recently said.

The National Association of Realtors’ latest report posted that in January, total existing-home sales, which are completed transactions that include single-family homes, townhomes, condominiums and co-ops, slightly increased 0.4% to a seasonally adjusted annual rate of 5.47 million, up from a downwardly revised 5.45 million in December.

“The housing market has shown promising resilience in recent months, but home prices are still rising too fast because of ongoing supply constraints,” Lawrence Yun, NAR chief economist, said on the existing-home sales report.

The latest S&P/Case-Shiller report echoed similar inventory concerns, with Zillow Chief Economist Svenja Gudell commenting on it saying, “There are a lot of economic forces at work behind the scenes that will have a big impact on housing as we enter the busy home-shopping season. Low inventory is a factor in almost every market, so buyers should be prepared for a limited selection in the months to come.”

According to the U.S. Census Bureau and the Department of Housing and Urban Development report, sales of new single-family houses in January 2016 were at a seasonally adjusted annual rate of 494,000. This is 9.2% below the revised December rate of 544,000 and is 5.2% below the January 2015 estimate of 521,000.

However, McLaughlin cautioned, “All new home sales numbers from the U.S. Census are extremely volatile: the margin of error is wide and often includes zero, which means we can’t be certain whether the month-over-month or year-over-year changes actually increased, decreased, or stayed flat.”


read more…


Can new home sales end the housing inventory crisis?

Boomers Prefer Suburbs and Cul de Sacs | Katonah Real Estate

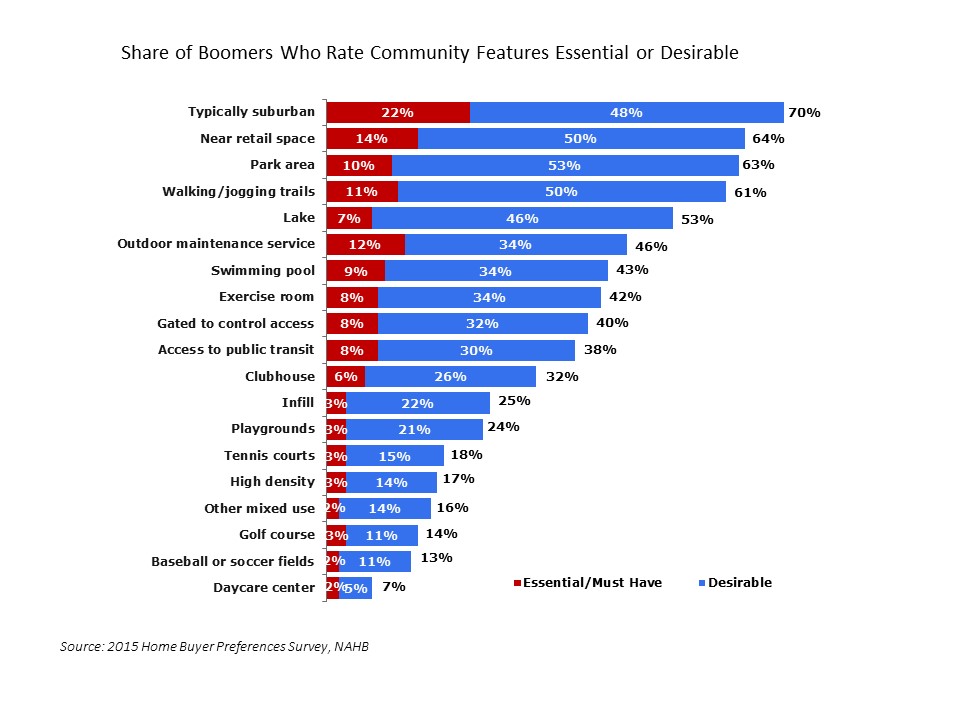
NAHB’s recently published Housing Preferences of the Boomer Generation shows that homebuyers in the Baby Boom Generation want a suburban neighborhood consisting of all single-family detached homes more often than any other community feature (of the 19 listed), and nearly 80 percent prefer a cul de sac over efficient traffic flow when given the choice.

These results are based on a survey conducted by NAHB in September 2015 that collected data from 4,326 recent and prospective homebuyers, stratified and weighted to be representative of the age, geography, income, and race and ethnicity of homeowners in the U.S.  Although the published study emphasizes housing preferences of Boomers (those born from 1946 to 1964), for comparison purposes the survey also captured buyers in other generations (including Millennials born in 1980 or later, Gen X’ers born 1965 to 1979, and Seniors born in 1945 or earlier).

Among other things, the survey asked buyers to rate 19 community features on the following four-tier scale:

  • Do not want – not likely to buy a home in a community with this feature.
  • Indifferent – wouldn’t influence decision.
  • Desirable – would be seriously influenced to purchase a home because this design or feature was included.
  • Essential/Must have – unlikely to purchase a home in a community unless it has this feature.

For home buyers in the Boomer generation, the most desired of these features is a “typically suburban” community (defined as consisting of all single-family detached homes) rated desirable or essential by 70 percent of Boomer respondents.  After that comes a group of three community features rated essential or desirable by 61 to 64 percent of Boomers: being near retail space, a park area and walking/jogging trails.

Boomer Pref Fig 01A

At the other end of the scale, tennis courts, high density (defined as smaller lots and attached/ or multifamily buildings), other mixed use (homes near office or other commercial buildings, to distinguish it from homes near retail space like grocery or drug stores), a golf course, baseball or soccer fields, and daycare center are relatively unpopular, each being rated essential or desirable by fewer than one-fifth of Boomers.

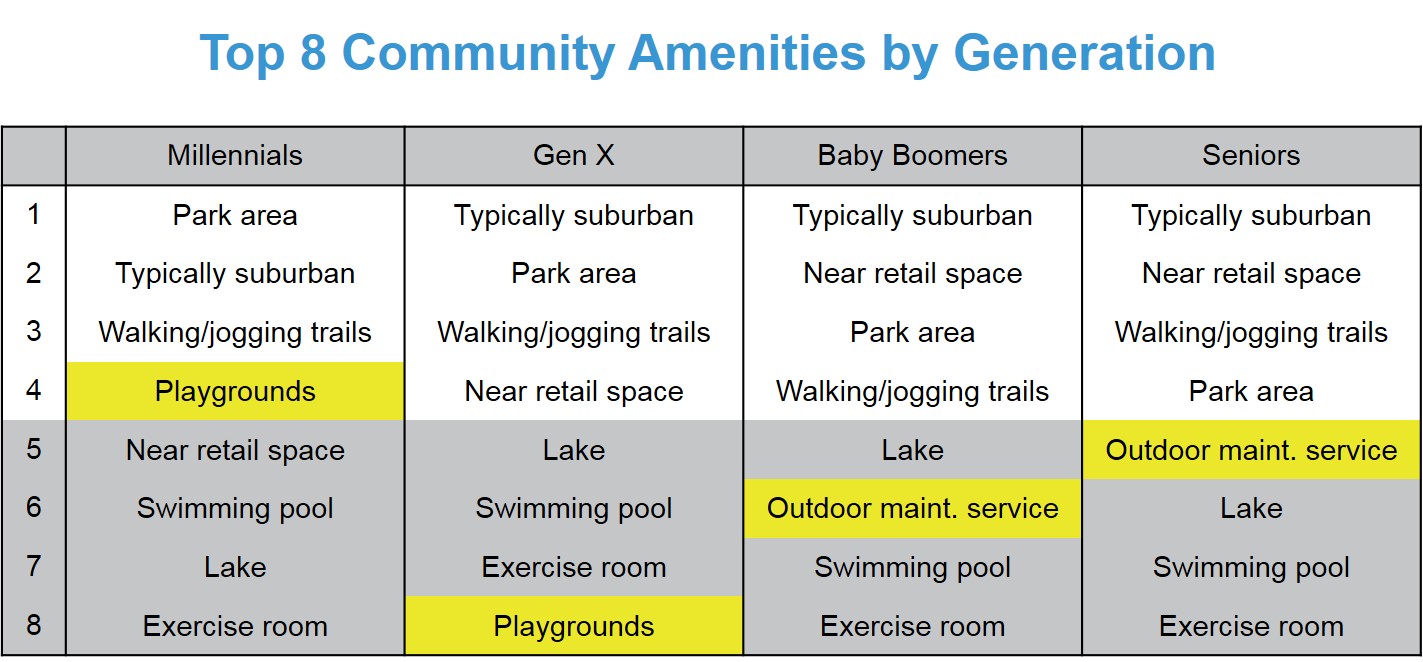
Compared to buyers in other generations there are many similarities in the way Boomers rank the top community features.  Seven community features (typically suburban, park area, near retail space, walking/jogging trails, a lake, swimming pool, and exercise room) make the top eight irrespective of the home buyer’s age.

Top 8 by Gen

The main generational differences in the rankings are 1) playgrounds are particularly important for buyers in the Millennial generation, but fall entirely out of the top eight for Boomers and Seniors; and 2) an outdoor maintenance service becomes relatively more important for older buyers, moving all the way up to number five on the list for Seniors.

 Another section of the NAHB survey asked home buyers about street design trade-offs, which can be useful in helping inform land planning decisions.  A number of advocacy groups (e.g., the National Complete Streets Coalition) recommend interconnected streets for efficent traffic flow, implying that designs like cul de sacs that seek to limit through traffic should be avoided.  But home buyers in the Boomer generation have the opposite opinion: 78 percent prefer the cul de sac or other street design with limited traffic flow—more than triple the 22 percent who prefer the alternative of a home on a continuous street with more efficient traffic flow.


read more…


Boomers Prefer Suburbs and Cul de Sacs

Case-Shiller Home Price Index rises | Katonah Real Estate

United States S&P Case-Shiller Home Price Index  Forecast 2016-2020

Case Shiller Home Price Index in the United States is expected to be 182.91 Index Points by the end of this quarter, according to Trading Economics global macro models and analysts expectations. Looking forward, we estimate Case Shiller Home Price Index in the United States to stand at 179.90 in 12 months time. In the long-term, the United States S&P Case-Shiller Home Price Index is projected to trend around 160.18 Index Points in 2020, according to our econometric models.

United States S&P Case-Shiller Home Price Index
United States S&P Case-Shiller Home Price Index Forecasts are projected using an autoregressive integrated moving average (ARIMA) model calibrated using our analysts expectations. We model the past behaviour of United States S&P Case-Shiller Home Price Index using vast amounts of historical data and we adjust the coefficients of the econometric model by taking into account our analysts assessments and future expectations. The forecast for – United States S&P Case-Shiller Home Price Index – was last predicted on Tuesday, January 26, 2016.
United States HousingLastQ1/16Q2/16Q3/16Q4/162020
Building Permits123212451249125412591310
Housing Starts114911651173118211921288
New Home Sales490491499503507567
Pending Home Sales2.71.991.71.541.451.33
Existing Home Sales546055465402539653785115
Construction Spending-0.40.220.270.290.30.31
Housing Index0.50.480.440.430.420.31
Nahb Housing Market Index6059.2758.9758.4858.0153.23
Mortgage Rate4.064.64.95.14.236.5
Mortgage Applications90.780.460.470.470.47
Home Ownership Rate63.763.763.763.763.763.7
Case Shiller Home Price Index183183182181180160


read more…


Home Construction Up for 2015 | Chappaqua Real Estate

With the December report on housing starts and permits, preliminary totals for 2015 are now available. Total housing starts at 1.11 million were up 10.8% in 2015 compared to 2014. Single-family starts were up 10.4% to 715,300 and multifamily starts were up 11.4% to 396,000. All four census regions also experienced increases in single-family starts for 2015. The monthly change for December starts was down 2.5% to 1.15 million and December single-family starts were down 3.3% to 768,000.

Housing Starts

Housing permits were up for the year by 12% to 1.18 million with increases in both single-family (up 7.9%) and multifamily (11.4%). December single-family permits were also up from November by 1.8% to 740,000. Total permits, however were down from November to December by 3.9% to 1.232 million.

The number of unused permits rose 4.9% suggesting builders were unable to start more homes than they planned. More than three-quarters of builders responding to an NAHB survey reported labor availability as their greatest concern looking forward into 2016. While inventories of new homes for sale have been increasing, builders are constrained in their ability to add stock because of the labor shortages as well as lot shortages in some markets.

The final numbers for 2015 will see one more revision as the previous month is revised in each new report, but year totals are not likely to change significantly since the first 11 months will remain the same. The improvement in 2015 over 2014 should accelerate slightly in 2016 as mortgage rates remain near historic lows, the overall economy improves and pent-up demand is released.


read more…


http://eyeonhousing.org/2016/01/home-construction-up-for-2015/

No Relief in Sight on Rents | Katonah NY Real Estate

The long anticipated slowdown in rent increases from record numbers of new multi-family projects opening for business has yet to materialize as rental demand drove rents to record levels in the first three quarters of 2015, sending the national apartment market soaring to its strongest year in a decade.

According to data from Axiometrics, a specialist in apartment market research and analysis:

  • Annual effective rent growth of 4.7% in the fourth quarter of 2015 represented a 7-basis-point (bps) increase from the figure of one year earlier (also rounded to 4.7%), though it was 35 bps lower than the 5.2% of the third quarter of 2015. The fourth-quarter rate is the highest year-end figure since 2005, when effective rent growth was 5.8%.
  • Rent growth has been 4.7% or above for five straight quarters, even though a three-quarter streak of at least 5.0% growth was broken. Never in Axiometrics’ 20-year history has annual effective rent growth been at 4.7% or above for such a long period.
  • Quarter-over-quarter effective rent growth was -0.6% in the fourth-quarter, continuing a trend of negative rent growth at the end of the year. That rate was a 32-bps decrease from the 0.3% reported in 4Q14 and marked the only quarter of 2015 in which the rent-growth rate decreased from the corresponding quarter of 2014. It should be noted that quarter-to-quarter rent growth is normally negative in the fourth quarter due to seasonality.
  • Average national rent was $1,244 for the fourth quarter of 2015, a $54 increase from the average of $1,188 in the fourth quarter of 2014.
QUARTERLY EFFECTIVE RENT GROWTH
Quarter2012201320142015
First0.6%0.4%0.5%0.9%
Second2.2%2.1%2.7%2.7%
Third1.3%1.2%1.7%2.0%
Fourth-0.6%-0.9%-0.3%-0.6%
 Source: Axiometrics Inc.


“Quarters 1-3 were the most robust period we have seen since before the Great Recession,” said Jay Denton, Axiometrics’ Senior Vice President of Analytics. “Much of the fourth-quarter moderation can be attributed to several Western markets that experienced double-digit rent growth for most of the year but could not sustain that pace.”

Denton added, “Those markets remain quite strong at 6% and higher rent growth. Axiometrics forecasted those metros to moderate, and they did late in the year. As expected, they remained among the top markets for rent growth despite the deceleration late in the year.”

In other metrics:

  • Occupancy was 95.0% in the fourth quarter, the highest 4Q rate since the 95.9% at the end of 2000. The 4Q15 rate was 38 bps lower than the 95.3% of 3Q15, but 10 bps higher than the 94.9% of 4Q14.
  • Annual effective rent growth was positive in 49 of Axiometrics’ top 50 markets, based on number of units. Only Oklahoma City was negative, at -0.6%. Two metros, Portland, OR (12.0%) and Oakland (11.3%), ended the year with double-digit rent growth.

Portland Remains No. 1 for Rent Growth

In the third quarter, Portland replaced Oakland as the metro with the highest annual effective rent growth among Axiometrics’ top 50 markets, and Oregon’s most populous area retained that distinction in the fourth quarter.

Oakland maintained the No. 2 position, but its Bay Area neighbors dropped in the rankings. San Francisco and San Jose, Nos. 3 and 5 last quarter, were Nos. 7 and 9 in the fourth quarter. California placed seven metros in the fourth-quarter top 25, including No. 3 Sacramento and No. 6 San Diego, while Florida placed five, including No. 5 Orlando.


read more….


http://www.realestateeconomywatch.com/2016/01/no-relief-in-sight-on-rents/

Great reasons to build a geodesic dome home | Katonah Real Estate


Dome homes. They’re kind of weird looking and they don’t exactly fit into those perfect little neighborhoods you see when walking around a cute downtown area or a clean-cut suburban gated community. But Buckminster Fuller saw the potential is those triangles: With the goal of creating a structure analogous to nature’s own designs, Fuller began to experiment with geometry in the late 1940s. In 1951, he patented the geodesic dome, and while you may not see a lot of on a normal city street, geodesic domes are known to be the most efficient building system available. So, why should you want a dome home anyway?

geodesic dome, dome homes, inside a dome home, dome homes, buckminster fuller, bucky fuller

Fuller, a philosopher, mathematician, engineer, historian, and poet, is known for popularizing the geodesic dome in architectural projects. One of his ambitions was to do more with less, knowing that eventually a housing crisis may endanger the planet’s growing population. He also noticed problems inherent in conventional construction techniques whereas natural structures seemed to have less trouble adapting to Mother Nature’s various issues.

the-gold-dome-oklahoma-3

1. Energy Efficiency

The sphere is nature’s most efficient shape, covering the most living area with the least amount of surface area. When compared with a similar sized rectangularly-shaped house, the dome home will have 30 percent less surface area. A dome home will actually use about 1 /3 less lumber to build than a similar sized box house, according to Linda Boothe, owner of Oregon Dome, so even though the dome uses less material, it’s about five times stronger than a rectangular-shaped house. Additionally, a third less surface area means that a third less heat is transferred to and from its surroundings, saving the average dome homeowner about 30 percent or more on their average heating and cooling bill.


geodesic dome, dome homes, inside a dome home, dome homes, buckminster fuller, bucky fuller

2. They’re Disaster-Proof

Well, just about. When the Loma Prieta earthquake in the Santa Cruz mountains hit in 1989, it hit 7.1 on Richter scale and over 500 conventional homes in the area were destroyed or needed extensive repair. Many more were damaged or needed major repair after the aftershocks rolled through. The only home to survive that quake in the area was an Oregon Dome geodesic dome home, Boothe said, and it was set up as a shelter for local earthquake survivors. Time and time again, dome homes have survived earthquakes, tornadoes and hurricanes when all other homes were destroyed. Why?

According to Boothe: “You can begin to see the intrinsic strength of this design by trying the following: Nail four boards together replicating box house framing and then nail three boards together in a triangle. You’ll find you can easily bend, twist, and skew the conventional square shape into many different shapes. This is what happens to your house in an earthquake. Now try to change the shape of the triangle. You can’t. The triangle is the strongest shape.”

dome_home_kit

3. Cheaper to Build than Traditional Houses

also save you on building materials, making them cheaper to build. Think of it like a soap bubble. Less surface area equals less lumber— which is cheaper for you all around.


geodesic dome, dome homes, inside a dome home, dome homes, buckminster fuller, bucky fuller

4. Endless Design Possibilities

The design possibilities are almost endless. While it may seem odd at first to try and figure out how to design a round home, the open floor plan allows you to insert or remove walls almost anywhere. A dome home is structurally independent of interior framing, so you don’t have to worry about that kitchen wall being “load-bearing”. Further, natural openings that occur within the construction of the dome allow for large openings and windows to the outside, letting light in throughout.

A dome home is an odd thing, certainly, and you may never see them lining the grid of regular city streets. However, every community that is hit, with tornadoes, earthquakes or hurricanes, however infrequently, would be smart to put a large dome structure near their town where they can gather and seek shelter during storms, much like the city of Tupelo, Mississippi is now doing.


read more…


5 great reasons to build a geodesic dome home

Mortgage Rates in 2016: Nothing to get Excited About | Katonah Real Estate

Bankrate’s senior financial analyst Greg McBride isn’t sweating the new environment in mortgage rates.  December’s FOMC decision to start the upward climb one baby step at a time won’t really mean much to home sales in the larger scheme of things and most homeowners who wanted to refinance have already done so.

McBride sees rates on a 30-year fixed ending the year at 4 to 4½ percent or so—not much higher than the current 3.89 percent but higher than in past years.

More importantly, rates will not rise enough to deter sales.  “Rather, buyers and sellers will make their decisions based on conditions in their personal lives, such as downsizing with the kids move out,” McBride said in an interview with Real Estate Economy Watch

As for refinancing, there has been a lot of opportunity in recent years and demand is exhausted, he said.  And don’t look for a revival of demand for adjustable rate mortgages. “Consumers are still squeamish following the subprime crash, he said.  The mortgage market in 2016 will be fixed rate and heavily weighted towards purchase over refi loans.


read more…


http://www.realestateeconomywatch.com/2016/01/mortgage-rates-in-2016-nothing-to-get-excited-about/

Appreciating Homes Increased in Third Quarter | Katonah Real Estate

The number of homes nationwide gaining value on a monthly basis increased during the third quarter from 56.80 percent in July to 59.37 percent of all homes in September and the appreciation rate increased for the third straight month. However, the percentage of homes gaining value still trails the rate of 66.31 percent in September 2014, Allan Weiss, CEO of Weiss Analytics, reported

As more homes moved out of price stagnation (with annual value change within plus 1.5% to -1.5% per year) houses both appreciating and decreasing both increased.  The percentage of homes losing value rose during the quarter, from 23.40 percent in July to 26.37 percent in September.

Unlike reports based on listings or sales prices that cover only the 3 to 4 percent of homes that are sold every year, Weiss Analytics tracks actual values for all homes, using repeat sales indexes for nearly 45 million individual properties.  The Weiss index database makes it possible to provide highly accurate value trends for specific addresses and measure trends in change values on a hyper local level.  Weiss home value forecasts are widely used to determine owners’ equity, help home buyers make decisions and provide accurate forecasts of future value for lenders and investors.

“It’s too soon to know if the gain over the past three months will become a significant trend.  We are still seven points below the appreciation rate last year and the gap in depreciating homes has grown to more than 12 points—a cause for concern in many markets.  Moreover, trends in appreciation are reflecting significant regional differences.  Hotter markets in the West and Pacific States reflect rising prices and impact affordability in some markets.  Levels of appreciation found in markets like Trenton, Worcester and Allentown are falling at double digit rates,” said Allan Weiss, CEO of Weiss Analytics and former CEO of Case Shiller Weiss.


National Percentages of Appreciating and Depreciating Homes

September

August

July

September 2014

Total Appreciating

59.37%

59.20%

56.80%

66.31%

Total Depreciating

26.37%

27.00%

23.40%

14.24%

Selected Markets

The selected markets below illustrate the regional nature of appreciation trends today. Markets that enjoyed high rates of participation in rising values like San Francisco, Miami, Los Angeles and Denver have seen their participation rates drop dramatically.  Among these markers, only Phoenix has a higher rate than it did a year ago.


Metro

September 2014

September 2015

Denver-Aurora-Lakewood, CO

94.9%

85.6%

Seattle-Tacoma-Bellevue, WA

88.3%

80.5%

San Francisco-Oakland-Hayward, CA

97.5%

78.8%

Phoenix-Mesa-Scottsdale, AZ

66.5%

72.5%

Atlanta-Sandy Springs-Roswell, GA

81.3%

67.7%

Miami-Fort Lauderdale-West Palm Beach, FL

91.0%

66.7%

Los Angeles-Long Beach-Anaheim, CA

90.2%

58.3%

Chicago-Naperville-Elgin, IL-IN-WI

58.2%

53.0%

New York-Newark-Jersey City, NY-NJ-PA

53.2%

48.3%

Washington-Arlington-Alexandria, DC-VA-MD-WV

48.3%

47.5%

Top Performing Markets

In September Flint, MI led the nation in percentage of appreciating homes, reaching 100 percent of the properties in the Weiss Analytics database, a 39.3 percent improvement over a year ago.  Second was Reno, NV with 92.9 percent of homes appreciating. Portland was third with 96.3 percent.  Six of the ten markets are Western.


MetroSep-14Sep-15Change
Flint, MI

60.7%

100.0%

39.3%

Reno, NV

98.0%

92.9%

-5.0%

Portland-Vancouver-Hillsboro, OR-WA

93.8%

86.3%

-7.5%

Denver-Aurora-Lakewood, CO

94.9%

85.6%

-9.4%

Stockton-Lodi, CA

93.9%

84.8%

-9.1%

San Jose-Sunnyvale-Santa Clara, CA

94.0%

84.4%

-9.6%

Port St. Lucie, FL

94.5%

84.0%

-10.5%

Madison, WI

61.3%

81.3%

19.9%

Seattle-Tacoma-Bellevue, WA

88.3%

80.5%

-7.8%

Palm Bay-Melbourne-Titusville, FL

91.0%

79.8%

-11.3%

read more…


Building your root cellar | Katonah Real Estate

Make this root cellar by burying a new concrete septic tank into a hillside.
Illustration by Len Churchill


The cool, moist and dark conditions of a root cellar make it the perfect place to keep many fruits and vegetables crisp and delicious for weeks — even months — of storage. And while there are myriad ways to store vegetables, our innovative root cellar plans show you how to build a root cellar by modifying a new, precast concrete septic tank. By following the plans, you’ll cut an entrance, install a door, add a pair of vent pipes and cover the tank with soil to bring an old-fashioned, walk-in cellar into your modern life.

Choose a Concrete Septic Tank

You’ll want to buy an unused septic tank for this root cellar design, but look for a deal to avoid paying full price. A percentage of all precast concrete septic tanks end up with small manufacturing defects that prohibit them from being used for sewage treatment. Suppliers sometimes offer discounts on these flawed tanks. As long as the tank is solid and sound, a chipped edge or a patchable hole won’t prevent it from being a root cellar. You won’t need the plastic fittings or effluent filter found inside most septic tanks, so ask the supplier to remove these before delivery.

Tank size is another detail you’ll need to consider when planning how to build a root cellar from a septic tank. The capacity of septic tanks is measured in gallons, with different models being taller or shorter. While you might be tempted to buy a 1,000- or 1,200-gallon tank because they’re common, you’ll get more food storage space and headroom with a tank that’s 1,500 gallons or larger. Standard 1,500-gallon tanks typically measure about 5 1/2 feet wide by 5 1/2 feet tall by 10 feet long, while a 2,500-gallon tank provides more than 6 feet of interior headroom. Don’t choose a low-profile tank because it will be much too short to work in. Prices for new, undamaged 1,500-gallon tanks start at about $1,100, and 2,500-gallon models can be found for as low as $1,600. Discounts for damaged tanks may be as much as 50 percent.

Most septic tanks have an internal partition that must be opened or removed to build from these root cellar plans. Try to find a tank without a partition, or ask your supplier to remove it before delivery. You can also punch through the partition yourself as part of the doorway-cutting process.

read more…


http://www.motherearthnews.com/diy/buildings/root-cellar-plans-zm0z14amzreb.aspx?newsletter=1&utm_source=Sailthru&utm_medium=email&utm_campaign=11.25.15%20MEN%20DIY%20eNews&utm_term=DIY%20eNews

Which States Care About the Planet? | Katonah Real Estate

Which States Care About the Planet?

Across the nation, Americans are going green – and they’re heading online for more information. Even their search results prove it, as they type in terms such as “how to save energy,” “eco-friendly,” and “electric cars.”

We researched action phrases people may search for when looking into certain environmentally friendly activities; then we used Google Trends to rank the results by topic and state. Read on for the interesting – and sometimes surprising – results.

REUSING

Old bottles can become candleholders; empty egg cartons can store holiday ornaments. Reusing is all the rage for eco-conscious Americans. When it comes to the phrase “how to reuse,” a high cost of living may explain the top two results: California took the lead, followed by Hawaii. Washington State, Georgia, and Utah rounded out the top five.

WIND POWER

The East and Midwest breezed to the top for “wind power” searches. Maine, Iowa, Indiana, Kansas, and Connecticut displayed the most interest in this unique power source. Maine’s wind power initiative (Wind for ME) helps explain its top spot. Iowa draws a quarter of its electricity from wind, Indiana is an up-and-comer in the wind power sector, and Kansas is second only to Texas in terms of wind power potential. In Connecticut, wind power is a controversial topic: Attempts to construct turbines have met with local opposition, and in 2014, the Supreme Court weighed in to approve wind farms. (This could explain the high volume of searches.)

SOLAR POWER

The top five hotspots for “solar power” searches were Vermont, Utah, Idaho, Nevada, and Hawaii. Vermont is an up-and-coming solar champ, with a 63% increase in money spent on solar installations between 2013 and 2014. In rural Utah and Idaho, where running power lines to some remote locations can be too pricey, solar energy often is an ideal solution. Nevada is home to the most solar jobs per capita. Finally, in Hawaii, almost one in eight homes has installed solar power.

GARDENING

The top four states that searched for the term “how to garden” have something in common: Idaho, South Dakota, Montana, and Utah are all states with low population density. Presumably, that means many residents may have the space to garden.

COMPOSTING

Composting involves diverting kitchen waste from the landfill and instead tossing it into bins (possibly with worms) where it can decompose to become a rich additive to soil. “How to compost” was a popular search among Colorado and Washington residents. Colorado cities, such as Denver and Boulder, provide a great deal of outreach on the topic of composting. Washington State is no surprise, either, as a new policy forces Seattle residents to compost food waste or have it sent to a processing site to avoid warnings and even fines.

ELECTRIC CARS

In a search for “electric cars,” California and Hawaii were first and second respectively. These stats align with the number of electric car owners in the nation as well: As of 2014, approximately 5.5 out of every 1,000 registered vehicles in California were electric, while 4.2 out of every 1,000 registered vehicles in Hawaii were electric.

To see more of these maps, explore the infographic below:

It’s Easy Being Green

Saving the Earth is a hot topic these days – and one virtually all Americans would do well to familiarize themselves with. How can you do your part? Next time you have a minute to go online, try a search for some of these topics. You just may discover that you want to plant a garden, set up a compost bin, share tips on recycling, offer to carpool with a friend, or look into alternate energy sources.

read more…


https://www.saveonenergy.com/which-states-care-about-the-planet/