Category Archives: blog

Home Features that Use Water | Pound Ridge Real Estate

Almost exactly half of residential water use consists of water used outside the home (e.g., for watering lawns), according to a recent NAHB study.  Indoors, the biggest users of water are toilets, followed by showers, faucets, clothes washers and leaks.

These results of the NAHB are based on data that became available in 2016 in the form of Residential End Uses of Water (REUW), a detailed study and data set of single-family homes produced by the Water Research Foundation.

In total, the single-family homes in the REUW study used an average of 276 gallons of water per day (gpd).   Almost exactly half of this was attributable to water used outside the home.  It is well known that lawns and gardens need more watering in climates that are hot and get little natural rainfall, so this helps explain the climate-related pattern to state water use per housing unit shown in last week’s post.  Indoors, toilets account for the greatest share of water use, but the shares for showers, faucets, clothes washers and leaks are also substantial.

The numbers in the chart above include both hot and cold water. The water heater in and of itself is not counted as an end use; the end use is where the water goes after leaving the heater.  If storing water in a tank to heat it increases indoor water use, this would not be characterized as an identifiable end use and would show up in the “other” category.  The 2016 REUW studies hot water use specifically in a sample of 94 homes and found that hot water accounted for one-third of total indoor water use.

Although it is not feasible to parse specific indoor uses by age of structure in the REUW data, it is possible to do this for total water used per single-family home.  Results show less water used by homes built before 1960, but relatively small differences among homes built after that.  For example, there is less than a 3 percent difference between the 244 gpd used by homes built in the 1960s and the 251 gpd used by homes built after 1999.

One possible explanation for lower water use in homes built before 1960 is the incidence of swimming pools.  Not surprisingly, statistical models in the REUW study indicate that swimming pools have a particularly strong impact on household water use.  Although 12 to 15 percent of homes built after 1959 in the REUW data have swimming pools, swimming pools are present on only 8 percent of homes built in the 1950s and only 3 percent of homes built before 1950.

This result, along with many others, is discussed more thoroughly in the full NAHB study.


read more…


http://eyeonhousing.org/2017/11/home-features-that-use-water/

John Lennon’s English home for sale | Bedford Corners Real Estate

John Lennon and his wife Cynthia lived here between 1964 and 1968. 
Photos via Knight Frank

Beatlemaniacs may be interested to know that a former home of John Lennon’s has come on the market in Surrey, in South East England. Known as Kenwood, the six-bedroom manse was built in 1913 in a mock-Tudor style and is located on St. Georges Hill estate.

The musician bought the home in 1964 for £20,000, enlisting Kenneth Partridge to design the interiors. Lennon lived there with his first wife Cynthia until 1968, when the couple divorced.

The 1.5-acre property has been significantly updated since then, but it’s still an impressive residence that, in addition to the six bedrooms, features six expansive reception rooms, six bathrooms, a huge kitchen, and beautifully landscaped grounds.

Period details like wood paneling, grand fireplaces, window seats, and exposed beams combine with contemporary finishes to create a bright, accommodating home ideal for entertaining.

Set on a “superb plateau position,” Kenwood enjoys uninterrupted views of the Surrey Hills, while mature gardens, fountains, and split-level lawn terraces offer additional outdoor living opportunities. A secondary building includes an indoor swimming pool with a shower, changing facilities, and a sauna,

All you need is £8.9 million, or about $11.7 million, to make it yours. You can’t buy love, but you can certainly get yourself a piece of rock-royalty real estate. Who knows, maybe Lennon’s musical genius will rub off on the lucky owner.

ViaThe Spaces

read more….


https://www.curbed.com/2017/11/15/16656864/john-lennon-kenwood-surrey-home-for-sale?utm_medium=email&utm_campaign=Curbed%20Dotcom%2011162017&utm_content=Curbed%20Dotcom%2011162017+CID_0b30620c2343ebb9cc30f4e78e6a2595&utm_source=cm_email&utm_term=All%20you%20need%20is%20117M%20to%20buy%20John%20Lennons%20home

Home prices continue to rise | Mt Kisco Real Estate

The S&P/Case-Shiller and the Federal Housing Finance Agency (FHFA) released their respective home price indices for August 2017. National home prices rose at a faster annual growth rate, while local home price gains varied. Price growth in metro areas across the West region exceeded the national average.

The Case-Shiller U.S. National Home Price Index, reported by S&P Dow Jones Indices, rose at a seasonally adjusted annual growth rate of 6.1% in August, faster than a 5.8% increase in July. It was the highest seasonally adjusted annual growth rate since February 2017. Meanwhile, the Home Price Index, released by the Federal Housing Finance Agency (FHFA), rose at a seasonally adjusted annual rate of 8.3% in April, following the 4.5% increase in July, confirming the acceleration in home prices this month.

In August, local home prices grew at different rates. Many of the faster growing metro areas are located in the West region of the country.

San Diego, Las Vegas, Seattle, San Francisco, Phoenix, and Los Angeles registered annual growth rates that exceeded the national average. Among the 20 metro areas, San Diego, Las Vegas and Charlotte had the highest home price appreciation. San Diego led the way with 12.2%, followed by Las Vegas with 11.0% and Charlotte with a 10.8% increase. Nineteen out of the 20 metro areas had home price appreciation and Atlanta had home price depreciation (-2.4%). Moreover, eight metro areas had higher home price appreciation than the national level of 6.1%.


read more…


http://eyeonhousing.org/2017/10/home-prices-accelerate-in-august/

Mortgage rates average 3.92% | Waccabuc Real Estate

Freddie Mac (OTCQBFMCC) today released the results of its Primary Mortgage Market Survey® (PMMS®), showing the average 30-year fixed mortgage rate dropping slightly after last week’s jump.

News Facts

  • 30-year fixed-rate mortgage (FRM) averaged 3.92 percent with an average 0.5 point for the week ending November 22, 2017, down from last week when it averaged 3.95 percent. A year ago at this time, the 30-year FRM averaged 4.03 percent.
  • 15-year FRM this week averaged 3.32 percent with an average 0.4 point, up from last week when it averaged 3.31 percent. A year ago at this time, the 15-year FRM averaged 3.25 percent.
  • 5-year Treasury-indexed hybrid adjustable-rate mortgage (ARM) averaged 3.22 percent this week with an average 0.4 point, up from last week when it averaged 3.21 percent. A year ago at this time, the 5-year ARM averaged 3.12 percent.

Average commitment rates should be reported along with average fees and points to reflect the total upfront cost of obtaining the mortgage. Visit the following link for the Definitions. Borrowers may still pay closing costs which are not included in the survey.

Quote
Attributed to Sean Becketti, chief economist, Freddie Mac.
“Rates dipped slightly in a short week leading up to the Thanksgiving holiday. The 10-year Treasury yield fell roughly 4 basis points, while the 30-year mortgage rate dropped 3 basis points to 3.92 percent. Mortgage rates continue to remain low.”

Home Prices Rapidly Rise: Is History Repeating Itself? | Armonk Real Estate

‘Rapid Price Increases Will Not Last Forever’

The current growth in home prices is echoing the lead-up to the recession. Is history repeating itself?

The answer is likely not, according to a recently released realtor.com® report. Building is lacking in many markets—one hallmark 10 years ago was over-construction—and credit standards are more stringent, says Danielle Hale, chief economist of realtor.com.

“As we compare today’s market dynamics to those of a decade ago, it’s important to remember rising prices didn’t cause the housing crash,” Hale says. “It was rising prices stoked by subprime and low documentation mortgages, as well as people looking for short-term gains—versus today’s truer market vitality—that created the environment for the crash.”

In 2016, home prices (the national median home sales price) were 2 percent higher than they were in 2006, the report reveals. Pre-recession prices have returned in 31 of the 50 largest metropolitan areas.

In contrast with 2006, however, are today’s credit conditions. Currently, the median FICO score for a mortgage is 734; the median in 2006 was 700.

Builds and flips are also different from 2006—starkly. The credit environment, among other factors, is keeping a lid on unfettered flipping and over-construction. In 2006, one household formation generally equaled 1.4 single-family housing starts; in 2016, that number shrank to 0.7 single-family starts. Flips accounted for 5 percent of sales in 2016; in 2006, they comprised 8.6 percent.

“Lending standards are critical to the health of the market,” says Hale. “Unlike today, the boom’s under-regulated lending environment allowed borrowing beyond repayable amounts and atypical mortgage products, which pushed up home prices without the backing of income and equity.”

Additionally, economic indicators point elsewhere. Employment was healthy then and is now, but inventory is limited more today—at a 20-year low. Presently, the average months supply is 4.2; in 2007, the average months supply was 6.4.

“The healthy economy is creating more jobs and households, but not giving these people enough places to live,” Hale says. “Rapid price increases will not last forever. We expect a gradual tapering as buyers are priced out of the market—not a market correction, but an easing of demand and price growth as renting or adding roommates becomes a more affordable alternative.”

For more information, please visit www.realtor.com.

read more..


http://rismedia.com/2017/11/13/home-prices-rapidly-rise-is-history-repeating-itself/?utm_source=newsletter&utm_medium=email&utm_campaign=eNews

Homeownership is starting to increase | South Salem Real Estate

According to the Census Bureau’s Housing Vacancy Survey (HVS), the U.S. homeownership rate is at 63.9% in the third quarter 2017, which is statistically unchanged from its last quarter reading of 63.7%. The rate of homeownership is on an upward trend after dropping to a cycle low of 62.9% in the second quarter 2016. Compared to the peak of 69.2% in 2004, the homeownership rate is below by 5.3% and remains below the 25-year average rate of 66.3%.

Younger homebuyers are gradually entering the housing market after the Recession. Compared to a year ago, the homeownership rates among households ages 35-44 increased from 58.4% to 59.3%. Millennials also registered noticeable gains – from 35.2% to 35.6%. Older households, ages 65 and over, is the only group where homeownership rates showed a slight decline of 0.1%.

The nonseasonally adjusted homeowner vacancy rate remained low at 1.6% in the third quarter 2017, down by 0.2% from previous year and statistically not different from the rate in the second quarter. At the same time, the national rental vacancy rate increased to 7.5%, compared to only 6.9% a year ago.

The HVS also provides a timely measure of household formations – the key driver of housing demand. Although it is not perfectly consistent with other Census Bureau surveys (Current Population Survey’s March ASEC, American Community Survey, and Decennial Census), the HVS remains a useful source of relatively real-time data.

The housing stock-based HVS revealed that the number of households increased to 119.1 million during the third quarter of 2017. This is 0.4 million higher than a year ago and sustains gains recorded in 2016. Growth in household formations will spur rental housing demand first, and ultimately, home sales. Indeed, the number of homeowner households rose by 0.8 million, after experiencing a large gain of 1.3 million in the second quarter.

read more…

http://eyeonhousing.org/2017/10/homeownership-rate-approaches-64/

If you are planning to buy a house, read this Northern Lights Exteriors post on scheduling a roofing inspection. This might save you a lot of money for interior renovations if a roof in a house appears to be out of condition.

Mortgage rates average 3.95% | Mt Kisco Real Estate

Freddie Mac (OTCQBFMCC) today released the results of its Primary Mortgage Market Survey® (PMMS®), showing the average 30-year fixed mortgage rate moving to its highest mark since July.

News Facts

  • 30-year fixed-rate mortgage (FRM) averaged 3.95 percent with an average 0.5 point for the week ending November 16, 2017, up from last week when it averaged 3.90 percent. A year ago at this time, the 30-year FRM averaged 3.94 percent.
  • 15-year FRM this week averaged 3.31 percent with an average 0.5 point, up from last week when it averaged 3.24 percent. A year ago at this time, the 15-year FRM averaged 3.14 percent.
  • 5-year Treasury-indexed hybrid adjustable-rate mortgage (ARM) averaged 3.21 percent this week with an average 0.4 point, down from last week when it averaged 3.22 percent. A year ago at this time, the 5-year ARM averaged 3.07 percent.

Average commitment rates should be reported along with average fees and points to reflect the total upfront cost of obtaining the mortgage. Visit the following link for the Definitions. Borrowers may still pay closing costs which are not included in the survey.

Quote
Attributed to Sean Becketti, chief economist, Freddie Mac.
“Rates increased this week. The 10-year Treasury yield ticked up 6 basis points, while the 30-year mortgage rate jumped 5 basis points to 3.95 percent. Today’s survey rate is the highest rate in nearly four months.”

Products Are Getting Pricier. Raise Your Estimates Now | Bedford Real Estate

Hurricanes and fires are putting pressures on supply, and thus prices

Here in Washington, D.C., a client of one of my favorite remodelers recently asked the remodeler to travel 1,000 miles to south Florida to rebuild homes damaged by Hurricane Irma. In Louisiana, lumberyard owners told me two weeks after Hurricane Harvey struck that they expected to see trucks show up at their stores soon, driven by people who hoped to buy all the drywall they could and tote it back to Houston for sale.

Winds of change, indeed. Those disasters, in addition to the wildfires on the West Coast, are likely to rattle your remodeling business even if you’re not located near the damage zones. Expectations run wild that prices for both products and labor will rise. Drywall, framing lumber, sheet goods, and asphalt shingles will see some of the biggest increases.

Odds are good that you are behind the eight ball already if you haven’t been updating the core data you use to build your estimates. We recently received the numbers for the cost half of our 2018 Cost vs. Value report. They show that, from mid-2016 to mid-2017, the amount a client should be expected to pay for 20 common professional remodeling projects had risen no less than 2.7% and as much as 6.5%. Note that the materials and people costs that went into this data were collected before the hurricanes arrived.

You should already have been raising your prices to meet the pre-hurricane cost increases. Now, for projects that won’t start until November, December, or early next year, expect that you’ll need to shell out even more money for materials and workers by the time those jobs begin.

But wait, there’s more: Texas and Florida could end up needing so much material that vendors and dealers will limit the amount they’ll sell to any one customer there. Those allocations usually are based on relationships that stem from how much you’ve bought from that vendor in recent years and how quickly you’ve paid your bill.

Graybeards who suffered through the 1970s’ double-digit inflation rates may remember how to operate in an era of constant price increases, even if it has been decades since they last used those skills. For the rest, prepare for an escalator ride that could be uncomfortably fast.

by Craig Webb

read more…

http://www.remodeling.hw.net/products/products-are-getting-pricier-raise-your-estimates-now_o?utm_source=newsletter&utm_content=Opinion&utm_medium=email&utm_campaign=REM_102017%20(1)&he=bd1fdc24fd8e2adb3989dffba484790dcdb46483

NAHB against tax bill | Mt Kisco Real Estate

The Republican proposal to overhaul the tax code gained a powerful enemy over the weekend when the National Association of Home Builders, a trade group that been supportive until now, launched a drive to defeat it.

The decision came despite an announcement by a key House Republican, Ways and Means Chairman Kevin Brady of Texas, that a deduction for property taxes would be maintained in tax legislation that is to be unveiled Wednesday.

Lawmakers from high-tax states, including California, Illinois, New Jersey and New York, had been pressing House leaders to continue to allow taxpayers who itemize to deduct state and local taxes.

A tax framework unveiled in September by President Trump and Republican House and Senate leaders called for maintaining the deductions for mortgage interest and charitable contributions while eliminating other write-offs.

Staff from the home builders association had been meeting with Brady’s staff because of concerns that eliminating the property tax deduction, combined with a proposal to double the standard deduction, would reduce the tax benefits of home ownership.

A study commissioned by the National Association of Realtors had found that the combination would lower the value of the average home by 10%.

“Even though they’re technically not touching the home mortgage interest deduction, the reality is they’re going to gut the mortgage interest deduction,” said Gerald H. Howard, CEO of the home builders group. “Doubling the standard deduction would mean only the wealthiest homeowners would be able to take the mortgage interest deduction.”

Howard said his group was pitching a tax credit that would let middle-class homeowners reduce taxable income by 12% of what they paid in mortgage interest and property taxes. The benefit would have been capped at mortgages of $500,000 and property taxes of $5,500, and there would have been a phase-out for high-income taxpayers.

Heritage Action for America, an advocacy group working to build support for the tax plan, released a letter Monday designed to blunt the builders’ effort. Signed by 146 real estate professionals, it argued that 70 percent of taxpayers do not itemize, and they would benefit from the cut in tax rates that would come from eliminating deductions, especially the break for state and local taxes, known as SALT.

“Repealing the SALT deduction would finally put pressure on fiscally irresponsible state and local politicians, especially in California, New York and New Jersey, to lower their income and property taxes,” the letter said.

Michael Needham, chief executive officer of Heritage Action, said on Fox News Sunday that “every single corrupt force of the status quo in Washington” would be coming out to “protect their little carve out” in the tax code.

read more…

https://www.usatoday.com/story/news/politics/2017/10/30/home-builders-pledge-defeat-income-tax-overhaul-after-homeowner-credit-rejected/813085001/

Used home sales rise .7% | Waccabuc Real Estate

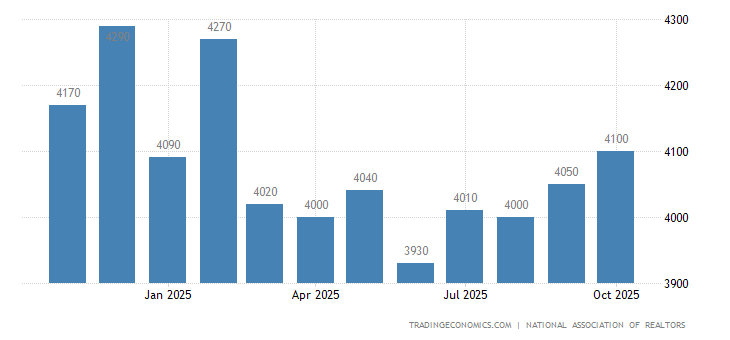
Sales of previously owned houses in the United States rose 0.7 percent month-over-month to a seasonally adjusted annual rate of 5.39 million in September 2017 from a year low of 5.35 million in August, beating market expectations of a 1 percent fall. Still, ongoing supply shortages and recent hurricanes muted overall activity. Sales of single family houses increased 1.1 percent to 4.79 million after falling 2.1 percent in August, while those of condos fell 1.6 percent to 0.60 million, following a 1.7 percent decline. The median house price fell to $245,100 from $253,100 in August and the months’ worth of supply was steady at 4.2 percent. In addition, the number of houses available in the market rose to 1.90 million from 1.87 million in August. Existing Home Sales in the United States averaged 3912.19 Thousand from 1968 until 2017, reaching an all time high of 7250 Thousand in September of 2005 and a record low of 1370 Thousand in March of 1970.

United States Existing Home Sales
CalendarGMTActualPreviousConsensusTEForecast
2017-08-2402:00 PMExisting Home Sales5.44M5.51M5.57M5.55M
2017-09-2002:00 PMExisting Home Sales5.35M5.44M5.46M5.45M
2017-10-2002:00 PMExisting Home Sales5.39M5.35M5.30M5.29M
2017-11-2103:00 PMExisting Home Sales5.39M5.36M
2017-12-2003:00 PMExisting Home Sales5.42M


United States HousingLastPreviousHighestLowestUnit
Building Permits1215.001272.002419.00513.00Thousand[+]
Housing Starts1127.001183.002494.00478.00Thousand[+]
New Home Sales560.00580.001389.00270.00Thousand[+]
Pending Home Sales-2.60-1.3030.90-24.30percent[+]
Existing Home Sales5390.005350.007250.001370.00Thousand[+]
Construction Spending0.50-1.205.90-4.80percent[+]
Housing Index0.200.101.20-1.80percent[+]
Nahb Housing Market Index68.0064.0078.008.00[+]
Mortgage Rate4.144.1610.563.47percent[+]
Mortgage Applications3.60-2.1049.10-38.80percent[+]
Home Ownership Rate63.7063.6069.2062.90percent[+]
Case Shiller Home Price Index201.99200.53206.52100.00Index Points[+]


United States Existing Home Sales

Existing Home Sales occurs when the mortgage is closed. Mortgage closing usually takes place 30-60 days after the sales contract is closed. . This page provides the latest reported value for – United States Existing Home Sales – plus previous releases, historical high and low, short-term forecast and long-term prediction, economic calendar, survey consensus and news. United States Existing Home Sales – actual data, historical chart and calendar of releases – was last updated on October of 2017.


ActualPreviousHighestLowestDatesUnitFrequency
5390.005350.007250.001370.001968 – 2017ThousandMonthly


read more…


https://tradingeconomics.com/united-states/existing-home-sales