Category Archives: Armonk

Mortgage rates average 6.95% | Armonk Real Estate

Freddie Mac today released the results of its Primary Mortgage Market Survey® (PMMS®), showing the 30-year fixed-rate mortgage (FRM) averaged 6.95 percent.

“Mortgage rates continue to hover around seven percent, as the dynamics of a once-hot housing market have faded considerably,” said Sam Khater, Freddie Mac’s Chief Economist. “Unsure buyers navigating an unpredictable landscape keeps demand declining while other potential buyers remain sidelined from an affordability standpoint. Yesterday’s interest rate hike by the Federal Reserve will certainly inject additional lead into the heels of the housing market.”

News Facts

  • 30-year fixed-rate mortgage averaged 6.95 percent with an average 0.8 point as of November 3, 2022, down from last week when it averaged 7.08 percent. A year ago at this time, the 30-year FRM averaged 3.09 percent.
  • 15-year fixed-rate mortgage averaged 6.29 percent with an average 1.2 point, down from last week when it averaged 6.36 percent. A year ago at this time, the 15-year FRM averaged 2.35 percent.
  • 5-year Treasury-indexed hybrid adjustable-rate mortgage (ARM) averaged 5.95 percent with an average 0.2 point, down from last week when it averaged 5.96 percent. A year ago at this time, the 5-year ARM averaged 2.54 percent.

The PMMS® is focused on conventional, conforming, fully amortizing home purchase loans for borrowers who put 20 percent down and have excellent credit. Average commitment rates should be reported along with average fees and points to reflect the total upfront cost of obtaining the mortgage. Visit the following link for the Definitions. Borrowers may still pay closing costs which are not included in the survey.

NOTE: Freddie Mac is making a number of enhancements to the PMMS to improve the collection, quality and diversity of data used. Instead of surveying lenders, the weekly results will be based on applications received from thousands of lenders across the country that are submitted to Freddie Mac when a borrower applies for a mortgage. Additionally, we will no longer publish fees/points or adjustable rates. The newly recast PMMS will be put in place on November 17, 2022, and the weekly distribution will be Thursdays at 12 p.m. ET.

Realtor.com reports 13.9% price increase | Armonk Real Estate

The U.S. housing market is offering home shoppers more options this fall than in 2021, as inventory increased 26.9% year-over-year in September, according to the Realtor.com® Monthly Housing Trends Report released today. While yearly listing price growth remained in the double-digits in September (+13.9%), the pace continued to moderate, suggesting that a rise in relatively affordable for-sale homes could be in store for buyers in the final months of 2022.

“Home prices have been remarkably resilient so far this year, considering the impact that inflation and climbing rates are having on buyers’ budgets. Recent data does show some deceleration in listing prices, and a seasonal pull back that is typical of this time of year. On the flip side, this cooling is likely one reason why fewer sellers entered the market in September,” said Danielle Hale, Chief Economist for Realtor.com®. “For homeowners deciding whether to make a move this year, remember that listing prices – while lower than a few months ago – remain higher than in prior years, so you’re still likely to find opportunities to cash-in on record-high levels of equity, particularly if you’ve owned your home for a longer period of time. And for prospective buyers grappling with affordability, you may have more bargaining power than you realize, particularly in areas where time on market is rising.”

September 2022 Housing Metrics – National

MetricChange over Sept. 2021Change over Sept. 2019
Median listing price13.9% (to $427,000)36.7 %
Active listings26.9 %-40.2 %
New listings-9.8 %-11.6 %
Median days on market7 days (to 50 days)-16 days

Inventory improvements hold steady even as new sellers hit pause
The U.S. supply of active listings remained higher than last year in September, but improvements failed to accelerate over last month as newly listed homes continued to drop. With higher rates resulting in less demand and fewer home salesseller sentiment continues to decline and impact homeowner plans to list. Still, today’s buyers have significantly more options than during the worst of the inventory crunch of the previous two years. This is especially true in many southern and western markets, where competition has cooled compared to the COVID frenzy.

  • Nationally, the inventory of homes actively for sale on a typical day in September increased 26.9% (+155,000) year-over-year, holding on par with the August pace (+26.9%). Newly-listed homes were down 9.8% year-over-year, a slight improvement over last month’s rate of decline (-13.0%).
  • Compared to last year, inventory increased in 36 out of 50 of the largest metros, led by markets in the West (+64.2%) and South (+57.5%): Phoenix (+167.3%), Raleigh, N.C. (+166.1) and Nashville, Tenn. (+125.3%).
  • In September, active listings dropped year-over-year in just one region, the Northeast (-6.0%). New listings declined from September 2021 levels in all four regions, led by the Northeast (-17.2%) and followed by the Midwest (-14.0%), West (-12.2%) and South (-3.9%).
  • Among the 50 largest U.S. metros, just eight saw the number of new sellers increase over September 2021 levels: New Orleans (+119.3% as last year was impacted by Hurricane Ida), Nashville. (+19.6%), Tampa, Fla. (+9.2%), Dallas (+9.1%), Birmingham, Ala. (+6.1%), Houston (+3.6%), San Antonio (+2.9%) and Raleigh (+2.0%).

Home price growth continues to moderate but remains in the double-digits
In September, national home listing prices increased at a faster September pace than in any prior year in our data’s history, despite continuing to moderate from June’s peak growth rate. Driven by the combination of still-high listing prices and climbing mortgage rates, a typical monthly mortgage payment was 70% higher in September compared to a year ago. As a result of these cost pressures, recent home sales data indicates that some home shoppers are putting plans on pause, giving those who remained in the market more power to negotiate price reductions in September.

  • The U.S. median listing price was $427,000, up 13.9% year-over-year. However, listing prices declined from June’s peak median ($449,000) and annual growth rate (+18.2%).
  • Nationally, the share of homes having their price reduced grew to 19.5% from 11.0% last September, and also climbed higher than typical 2017 and 2019 levels (18.7%).
  • Among the 50 largest U.S. metros, southern and midwestern markets (+11.8%, on average) led the charge in yearly listing price growth in September, with the biggest increases registered in Miami (+28.3%), Memphis, Tenn. (+27.3%), and Milwaukee (+27.0%). Listing prices declined in just two markets: New Orleans (-2.3%) and Pittsburgh (-0.8%).
  • Western metros posted the biggest gains in the share of listings with price reductions, led by Phoenix (+32.3 percentage points), Austin, Texas (+27.4 percentage points) and Las Vegas(+20.0 percentage points).

Time on market remains higher than last year but is still historically-fast
In September, a typical home spent more days on market than last year, after first hitting that milestone just last month. As inventory continues to rise this fall compared to last year, homebuyers have relatively more breathing room to make decisions. This was true of September time on market trends nationwide, as well as in all four regions and in the vast majority of U.S. metros. However, compared to historical norms in prior years, homes continue to sell at a faster pace so far in 2022.

  • The typical U.S. home spent 50 days on the market in September, up seven days year-over-year compared to an annual increase of four days in August, which marked the first increase since the early days of COVID. Nonetheless, time on market was still 18 days faster than the typical September 2017-2019 pace.
  • Homes spent longer on the market than last year across regions: The West, up 10 days; the South, up six days; the Northeast, up five days; and the Midwest, up five days.
  • Relative to the national pace, time on market slowed similarly across the 50 largest U.S. metros, on average, up seven days year-over-year to a median of 43 days. Among these markets, the biggest yearly time on market increases were in Austin (+23 days), Raleigh (+23 days), Phoenix (+17 days) and Las Vegas (+17 days).
  • In September, homes sold more quickly than last year in just five metros: New Orleans (-9 days, again reflecting the impact of Hurricane Ida last year), Richmond, Va. (-6 days), Miami (-2 days), Atlanta (-1 days) and Houston (-1 day).

read more…

news.move.com

Housing price appreciation slows in June | Amonk Real Estate

Rising mortgage rates and inflation in the wider economy caused housing demand to drop sharply in June, forcing home prices to cool down.

Home prices are still higher than they were a year ago, but the gains slowed at the fastest pace on record in June, according to Black Knight, a mortgage software, data and analytics firm that began tracking this metric in the early 1970s. The annual rate of price appreciation fell two percentage points from 19.3% to 17.3%.

Price gains are still strong because of an imbalance between supply and demand. The housing market has had a severe shortage for years. Strong demand during the coronavirus pandemic exacerbated it.

Even when home prices crashed dramatically during the recession of 2007-09, the strongest single-month slowdown was 1.19 percentage points. Prices are not expected to fall nationally, given a stronger overall housing market, but higher mortgage rates are certainly taking their toll.

The average rate on the 30-year fixed mortgage crossed over 6% in June, according to Mortgage News Daily. It has since dropped back in the lower 5% range, but that is still significantly higher than the 3% range rates were in at the start of this year.

“The slowdown was broad-based among the top 50 markets at the metro level, with some areas experiencing even more pronounced cooling,” said Ben Graboske, president of Black Knight Data & Analytics. “In fact, 25% of major U.S. markets saw growth slow by three percentage points in June, with four decelerating by four or more points in that month alone.”

Still, while this was the sharpest cooling on record nationally, the market would have to see six more months of this kind of deceleration for price growth to return to long-run averages, according to Graboske. He calculates that it takes about five months for interest rate impacts to be fully reflected in home prices.

Markets seeing the sharpest drops are those that previously had the highest prices in the nation. Average home values in San Jose, California, have fallen 5.1% in the last two months, the biggest drop of any of the top markets. That chopped $75,000 off the price.

In Seattle, prices are down 3.8% in the past two months, or a $30,000 reduction. San Francisco, San Diego and Denver round out the top five markets with the biggest price reductions.

The cooling in prices coincides with a sharp jump in the supply of homes for sale, up 22% over the last two months, according to Black Knight. Inventory is still, however, 54% lower than 2017-19 levels.

“With a national shortage of more than 700,000 listings, it would take more than a year of such record increases for inventory levels to fully normalize,” said Graboske.

Price drops will not affect the average homeowner as much as they did during the Great Recession, because homeowners today have considerably more equity. Tight underwriting, and several years of strong price appreciation caused home equity levels to hit record highs.

Despite that, the strong demand in the market recently could present a problem for some. About 10% of mortgaged properties were purchased in the last year, so price drops could cause some borrowers to edge much lower in their equity positions.

read more…

cnbc.com

The current real estate market | Armonk Real Estate

Compass and Redfin make cuts amid volatile market

On Tuesday, the other shoe dropped. With mortgage rates now north of 6% and the stock market officially in bear territory, two of America’s most prominent real estate brokerages instituted large-scale layoffs and halted expansion efforts.

Redfin CEO Glenn Kelman said the brokerage/listings platform made the tough decision to lay off 470 workers across several divisions, including its engineering department.

“We raised hundreds of millions of dollars so we wouldn’t have to shed people after just a few months of uncertainty,” he wrote in a filing to the Securities and Exchanges Commission. “But mortgage rates increased faster than at any point in history. We could be facing years, not months, of fewer home sales, and Redfin still plans to thrive. If falling from $97 per share to $8 doesn’t put a company through heck, I don’t know what does.”

Meanwhile, venture-backed Compass laid off 450 workers, halted expansion plans and even briefly paused trading of its stock, which had fallen from a debut price of $20.15 in April 2021, to $4.51 a share. Compass on Tuesday said that it has shut down Modus Technologies, a Seattle-based company that Compass bought in October 2020, heralding its entry point into the title and escrow space. It also plans to reduce costs by not backfilling roles and by getting out of real estate office leases.

Both Redfin and Compass are considered disruptors in the real estate industry, but neither has managed profitability. Redfin is rare in that it has salaried real estate agents as opposed to independent contractors. Its foray into iBuying has hurt its bottom line, and its business model is vulnerable to sudden shifts in the market. Compass, which lured top-performing agents with high commission splits and large signing bonuses, has struggled to contain costs.

The uptick in mortgage rates from the 3% range in January to over 6% in June and resulting drop in home sales volume has put immense pressure on virtually all real estate brokerages and mortgage lenders over the past two quarters.

HousingWire recently spoke with Jon Irvine, Chief Production Officer at Change Lending, about how brokers can gain a new competitive advantage in the current tight market.

It reached a tipping point this week following a worse-than-expected report on inflation on Friday and corresponding speculation about what the Federal Reserve would do this week to combat inflation. Many Fed observers expect the central bank to raise rates by 75 basis points on Wednesday. It is likely to trigger more layoffs across the real estate and mortgage industries.

Such market volatility has led to sleepless nights for real estate agents and LOs as well as buyers and sellers in recent few days.

“Interest rates are obviously rising and they are probably going to go up quite a bit again this week, so I’ve got buyers that are under contract now, but not closed and they are all texting me going, ‘Oh no, look at this,’” Anne-Marie Wurzel, who leads a top real estate team for Mainframe Real Estate in Orlando, Florida, told RealTrends. “But I tell them that this is why the lender and I wanted them to lock in on a rate and close a couple of days early so they could keep their rate. So buyers are getting concerned.”

Melissa Cohn, a veteran mortgage banker at William Raveis Mortgage, described Friday and Monday as “a bloodbath.” Industry pros are going to have to grit and bear it until stability in the market is achieved, but a return to normal will happen, she said. It’s just not exactly clear when.

“It’s nonsensical – rates don’t go up 50 basis points in three days,” she said. “This is just an overreaching concern about the Fed not being proactive enough and looking for real guidance.”

read more…

housingwire.com/articles/

Home Builders Warn of Significant Affordability Declines | Armonk Real Estate

Housing affordability posted a modest gain for average conditions in the first quarter of 2022 as a strong jump in national median income helped to offset a gradual rise in interest rates. However, home builders warn of current deteriorating conditions as a sharp jump in mortgage rates in March and April coupled with ongoing building material supply chain disruptions, labor shortages and high inflation drive up housing costs.

According to the National Association of Home Builders (NAHB)/Wells Fargo Housing Opportunity Index (HOI), 56.9% of new and existing homes sold between the beginning of January and end of March were affordable to families earning the U.S. median income of $90,000. While this is up from the 54.2% of homes sold in the fourth quarter of 2021, current market indicators point to worsening affordability conditions.

The first quarter HOI was calculated based on the following key factors:

  • An average quarterly interest rate of 3.86%, up 70 basis points from the previous quarter
  • A 2022 median income of $90,000, up from last year’s $79,900.
  • A national median home price of $365,000, up $5,000 from the fourth quarter of 2021 and a whopping $45,000 from the first quarter of 2021.

Affordability Dips Below 50% Based on Recent Mortgage Rates

Keeping all other factors the same and calculating nationwide affordability conditions based on end of April mortgage rates of 5.11% instead of the first quarter average of 3.86%, the HOI would have fallen from 54.2 in the fourth quarter of 2021 to 48.7 today.

This means that based on where the housing market stands today, just 48.7% of homes sold in the first quarter were affordable to median-income families, the lowest affordability level recorded on the HOI since the beginning of the revised series in the first quarter of 2012.

“The first quarter reading is a backward gauge, as surging interest rates, ongoing building material supply chain constraints and labor shortages continue to raise construction costs and put upward pressure on home prices,” said NAHB Chairman Jerry Konter, a home builder and developer from Savannah, Ga.

Every quarter-point hike in mortgage rates means that 1.3 million households are priced out of the market for a nationwide median priced home. And with the Federal Reserve moving aggressively to raise short-term interest rates and reduce its holding of mortgage-backed securities to combat inflation that is running at a 40-year high, mortgage rates are expected to rise even further.

“Looking at current market conditions, affordability woes continue to mount as rising interest rates and home building material costs that are up 20% year-over-year are causing housing costs to rise much faster than wages,” said NAHB Chief Economist Robert Dietz. “The HOI falling below 50 using these real-time estimates is an indication of significant housing affordability burdens, particularly for frustrated, prospective first-time buyers. The best way to ease growing affordability challenges is for policymakers to address ongoing supply chain disruptions that will allow builders to construct more affordable homes.”

The Most and Least Affordable Markets in the First Quarter

Lansing-East Lansing, Mich., was the nation’s most affordable major housing market, defined as a metro with a population of at least 500,000. There, 92.3% of all new and existing homes sold in the first quarter were affordable to families earning the area’s median income of $89,500.

Top five affordable major housing markets:

  1. Lansing-East Lansing, Mich.
  2. Indianapolis-Carmel-Anderson, Ind.
  3. ScrantonWilkes-Barre, Pa.
  4. Rochester, N.Y.
  5. Dayton-Kettering, Ohio

Meanwhile, Wheeling, W.Va.-Ohio., was rated the nation’s most affordable small market, with 97.3% of homes sold in the first quarter being affordable to families earning the median income of $75,400.

Top five affordable small housing markets:

  1. Wheeling, W.Va.-Ohio
  2. Cumberland, Md.-W.Va.
  3. Elmira, N.Y.
  4. Utica-Rome, N.Y.
  5. Davenport-Moline-Rock Island, Iowa-Ill.

For the sixth straight quarter, Los Angeles-Long Beach-Glendale, Calif., remained the nation’s least affordable major housing market. There, just 8.3% of the homes sold during the first quarter were affordable to families earning the area’s median income of $90,100.

Top five least affordable major housing markets—all located in California:

  1. Los Angeles-Long Beach-Glendale
  2. Anaheim-Santa Ana-Irvine
  3. San Francisco-San Mateo-Redwood City
  4. San Diego-Chula Vista-Carlsbad
  5. Stockton

The top five least affordable small housing markets were also in the Golden State. At the very bottom of the affordability chart was Salinas, Calif., where 9.2% of all new and existing homes sold in the first quarter were affordable to families earning the area’s median income of $90,100.

Top five least affordable small housing markets—all located in California:

  1. Salinas
  2. Santa Maria-Santa Barbara
  3. San Luis Obispo-Paso Robles
  4. Napa
  5. Santa Cruz-Watsonville

Please visit nahb.org/hoi for tables, historic data and details.

read more…

nahb.org

Mortgage applications are down 56% | Armonk Real Estate

Mortgage applications decreased 13.1 percent from one week earlier, according to data from the Mortgage Bankers Association’s (MBA) Weekly Mortgage Applications Survey for the week ending February 18, 2022. 

The Market Composite Index, a measure of mortgage loan application volume, decreased 13.1 percent on a seasonally adjusted basis from one week earlier. On an unadjusted basis, the Index decreased 11 percent compared with the previous week. The Refinance Index decreased 16 percent from the previous week and was 56 percent lower than the same week one year ago. The seasonally adjusted Purchase Index decreased 10 percent from one week earlier. The unadjusted Purchase Index decreased 6 percent compared with the previous week and was 6 percent lower than the same week one year ago.  

“Mortgage applications dropped to their lowest level since December 2019 last week, as mortgage rates continued to inch higher. The 30-year fixed rate was 4.06 percent, almost a full percentage point higher than a year ago. Higher mortgage rates have quickly shut off refinances, with activity down in six of the first seven weeks of 2022. Conventional refinances in particular saw a 17 percent decrease last week,” said Joel Kan, MBA’s Associate Vice President of Economic and Industry Forecasting. “Purchase applications, already constrained by elevated sales prices and tight inventory, have also been impacted by these higher rates and declined for the third straight week. While the average loan size did not increase this week, it remained close to the survey’s record high.”  

The refinance share of mortgage activity decreased to 50.1 percent of total applications from 52.8 percent the previous week. The adjustable-rate mortgage (ARM) share of activity increased to 5.1 percent of total applications.  

The FHA share of total applications increased to 8.7 percent from 8.3 percent the week prior. The VA share of total applications increased to 9.9 percent from 9.3 percent the week prior. The USDA share of total applications remained unchanged at 0.4 percent from the week prior.

The average contract interest rate for 30-year fixed-rate mortgages with conforming loan balances ($647,200 or less) increased to 4.06 percent from 4.05 percent, with points increasing to 0.48 from 0.45 (including the origination fee) for 80 percent loan-to-value ratio (LTV) loans. The effective rate increased from last week.

The average contract interest rate for 30-year fixed-rate mortgages with jumbo loan balances (greater than $647,200) increased to 3.84 percent from 3.81 percent, with points increasing to 0.45 from 0.39 (including the origination fee) for 80 percent LTV loans. The effective rate increased from last week.  

The average contract interest rate for 30-year fixed-rate mortgages backed by the FHA increased to 4.09 percent from 4.01 percent, with points decreasing to 0.56 from 0.59 (including the origination fee) for 80 percent LTV loans. The effective rate increased from last week.  

The average contract interest rate for 15-year fixed-rate mortgages increased to 3.42 percent from 3.37 percent, with points decreasing to 0.45 from 0.50 (including the origination fee) for 80 percent LTV loans. The effective rate increased from last week.

The average contract interest rate for 5/1 ARMs decreased to 3.26 percent from 3.36 percent, with points decreasing to 0.34 from 0.48 (including the origination fee) for 80 percent LTV loans. The effective rate decreased from last week. 

Westchester 2021 sales up 10.4% | Armonk Real Estate

“2021 continued to be a record-breaking year in real estate, not just in the markets we serve but also nationally,” Liz Nunan, president and CEO of Houlihan Lawrence, said in the brokerage’s newly released fourth-quarter report on lower Hudson Valley real estate.

Liz Nunan

Home sales in Westchester were up 10.4% for 2021, while Putnam and Dutchess counties reported gains of 8% and 2.7%, respectively. Nearly every submarket in Westchester posted double-digit sales gains, according to the report.

“While the first half of 2021 varied in specific metrics to the second half, two factors remained constant. The inventory was at an all-time low, and buyer demand was exceptionally strong,” Nunan said. “As the year progressed, the sales outpaced inventory replacement, and this further restriction led to a decline in pending sales and, eventually, closed sales.”

In the fourth quarter, the number of listings declined 42% in Westchester County year over year. In Putnam County, that number was down 34%, and in Dutchess County listings were down 44%.

“2022 will likely not see the record-breaking number of sales seen in 2021. But until the supply and demand fall into balance, the market will still be charged with buyers, and sellers will continue to prosper,” Nunan said.

In the fourth quarter, 1,669 single-family homes sold in Westchester, compared with 2,228 in the first quarter of 2020, a drop of 25.1%. The median sale price was $725,000, a 1% drop from $732,000 in the fourth quarter of 2020.

For all of 2021, 7,541 single-family homes changed hands in Westchester, compared with 6,649 in 2020, a 10.4% gain. The median sale price for the year went up to $780,000 from $735,000 in 2020, a 6.1% gain.

The number of condominiums sold in Westchester went up by 31.8% from 1,242 in 2020 to 1,637 in 2021. The median sale price also was up at $425, 000 in 2021 compared with $403,000 in 2020, a 5.5% increase.

In the fourth quarter, condo sales dropped 4.3% from 470 in the fourth quarter of 2020 to 450 in 2021’s fourth quarter. The median sale price increased 4.9% from $410,000 in Q4 of 2020 to $430,000 in Q4 of 2021.

Co-op sales in Westchester were up by 35.3% from 1,562 units sold in 2020 to 2,114 in 2021. The median sale price was $194,100, up 6.1% from 2020’s $183,000.

For the fourth quarter of 2021, co-op sales stood at 547 units, a 10.3% increase from the 496 units that changed hands in the fourth quarter of 2020. The median sale price inched up 2.9% from $185,000 in Q4 of 2020 to $190,400 in Q4 of 2021.

In Putnam, there were 1,342 single-family homes sold in 2021 compared with 1,241 in 2020. The median sale price for the year was $440,000, up 16% from 2020’s $379,999. It also was up 16% for the fourth quarter of 2021 compared with the fourth quarter of 2020, reaching $455,750 from $394,250.

There were 199 condos sold in Putnam during the year, compared with 175 sold in 2020, a 15% increase. The median sale price was up 12.7% at $290,000 compared with 2020’s $257,250. For the fourth quarter of 2021, 43 units were sold, a drop of 28.3% from the 60 units sold in the fourth quarter of 2020. However, the median sale price went up 12.1% from $280,950 in Q4 of 2020 to $315,000 in Q4 of 2021.

In Dutchess County, 2,759 single-family homes were sold in 2021 compared with 2,686 in 2020. In the fourth quarter of 2021, 665 single-family homes sold compared with 997 in 2020’s fourth quarter, a drop of 33.3%. The median sale price rose 14.7% from $339,900 in 2020 to $390,000 in 2021. For the fourth quarter of 2021, the median sale price was up 7.3% to $396,000 from $369,000 in the same period in 2020.

There were 628 condominiums sold in 2021 in Dutchess, up 38% from the 455 that sold in 2020. There were 152 sold in Q4 of 2021 compared with 159 in Q4 of 2020, a 4.4% drop. The median condo sale price was $231,056 for Q4 of 2021, down 7.6% from $250,000 in the fourth quarter of 2020. For the year,the median sale price was $235,000, a 5.4% increase from 2020’s $225,000.

read more…

westfaironline.com/144213/

Building material prices up 14% | Armonk Real Estate

The prices of goods used in residential construction ex-energy climbed 1.8% in November (not seasonally adjusted), according to the latest Producer Price Index (PPI) report released by the Bureau of Labor Statistics. The monthly increase was driven by price increases in nearly every product category.

Building materials prices have increased 14.1% year-to-date, more than tripling the November YTD increase of the prior year (+3.9%) and well above the average YTD increase of 1.5% between 2015 and 2020. The index has climbed 2.5% over the past two months following a 1.5% decline between July and September.

The price index of services inputs to residential construction decreased 0.8% in November, continuing a four-month trend during which the index has declined 10.1%.

Wholesale and retail trade services decreased 1.3% in November which more than offset price increases in transportation and warehousing (+1.0%) and services less trade, transportation, and warehousing (+0.3%). Nonetheless, the price index of services used in residential construction (excluding labor) is 13.5% higher than it was 12 months prior and 22.3% higher and 22.3% than the January 2020 reading.

The PPI for all inputs to residential construction–which is a weighted average of goods and services, increased 0.3% in November–has climbed 17.3% over the past 12 months, and is 22.7% higher than its pre-pandemic level.

Product Detail: Goods

Softwood Lumber

The PPI for softwood lumber (seasonally adjusted) increased 6.9% in November and has gained 16.1% since September.  Once again, as was stated in last month’s PPI post, the recent trend of mill prices—which have more than doubled since late August and are up 37% over the past four weeks—suggests that the softwood lumber PPI is headed for another sizable gain in December.

The PPI of most durable goods for a given month is largely based on prices paid for goods shipped, not ordered, in the survey month. This can result in lags relative to cash market prices during periods of long lead times.

Steel Products

Steel mill products prices rose 2.4% in November, the smallest monthly increase since May 2021. The last monthly price decrease in steel mill products occurred in August 2020, and the index has climbed 151.4% in the months since–with more than 80% of that increase taking place in 2021.

Since the inception of the steel mill products PPI, it has doubled over four non-overlapping periods which have averaged 181 months in duration.  In other words, over the last 60 years it has taken roughly 15 years for the price of steel mill products to double, on average.  Given that context, the recent pace of price increases has been incredible—it took only 11 months for steel prices to double between August 2020 and July 2021.

Ready-Mix Concrete

The PPI for ready-mix concrete (RMC) gained 0.9% in November after increasing 0.1% in October.  The index for RMC has risen 8.3% since January 2020 and 6.6% YTD—the largest year-to-date increase in November since 2005.

At the regional level, prices increased in the Northeast (+2.5%%) and Midwest (+4.7%) while prices fell in the South (-0.9%) and West (-1.1%) regions.

 Gypsum Products

In November, the PPI for gypsum products declined (-0.2%) for only the second time in 2021.  Gypsum products prices have climbed 19.8% over the past 12 months and are up 18.8% in 2021—more than quadruple the largest percentage YTD increase in November since seasonally adjusted data became available in 2012.

Paint

The PPIs for exterior and interior architectural coatings (i.e., paint) increased 1.5% and 0.2%, respectively, in November. Neither index has declined since January 2021.

The YTD price increases of architectural coatings is unprecedented with exterior and interior paint prices climbing 16.7% and 10.9%, respectively, thus far in 2021.  In contrast, November YTD price increases averaged just 2.1% for exterior paint and 1.4% for interior paint from 2013 through 2020 (the most recent data available).

Paint prices began a series of large monthly increases in the wake of the winter storm that devastated Texas earlier this year as the petrochemical industry—upon which paint manufacturing is heavily reliant—is highly concentrated in the state.

Other Building Materials

The chart below shows the 12-month and year-to-date price changes of other price indices relevant to the residential construction industry.

With the recent passage of the Infrastructure Investment and Jobs Act (a.k.a. the Bipartisan Infrastructure Bill), the construction materials index is particularly salient.  This index, which has increased 29.1% year-to-date and 40.9% since January 2020, is more heavily weighted with products used in large amounts in the production of “traditional” infrastructure (e.g., roads, bridges, rail).

Product Detail: Services

Building Materials Wholesaling and Retailing

The Producer Price Index for building materials wholesaling decreased 1.4% in November and the building materials retailing PPI declined 1.6%.  The wholesale and retail services indices measure changes in the nominal gross margins for goods sold by retailers and wholesalers. Gross profit margins of retailers, in dollar terms, have declined 22.1% since reaching an all-time high in June 2021 but remain 33.4% higher than the January 2020 level.

Building materials wholesale and retail indexes which together account for roughly two-thirds of the PPI for “inputs to residential construction, services.”

Professional Services

Professional services is the third most heavily weighted category in the service inputs to residential construction PPI.  The prices of legal, architectural, and engineering services rose 0.3%, 0.3%, and 0.2%, respectively, in November. Although the year-to-date increase in prices of professional services used in residential construction are quite modest compared to that of materials, prices have increased more in 2021 than they had by November 2020; the difference is especially striking for engineering and architectural services.

Although the difference in YTD price changes for legal services is small, the percentage increases are relatively large.  This follows with a trend in recent years.  Since November 2018, the price of legal services has risen 13.2%–much higher than the three-year increase in architectural (+1.7%) and engineering services (+5.9%).

Metal Treatment Services

Prices of metal treatment services increased 0.7%, on average, in November.  The subset of these services used to calculate the services inputs to residential construction includes plating and polishing, coating and allied services, and heat treating.  Metal coating and allied services have increased the most— +14.1% (NSA)—since the start of 2021.  Metal heat treating and plating and polishing services have increased 5.4% and 2.0%, respectively, year-to-date.  The average price increase of the three services averaged 0.1% over the course of 2020.

read more…

eyeonhousing.org

Inventory down, sales slow | Armonk Real Estate

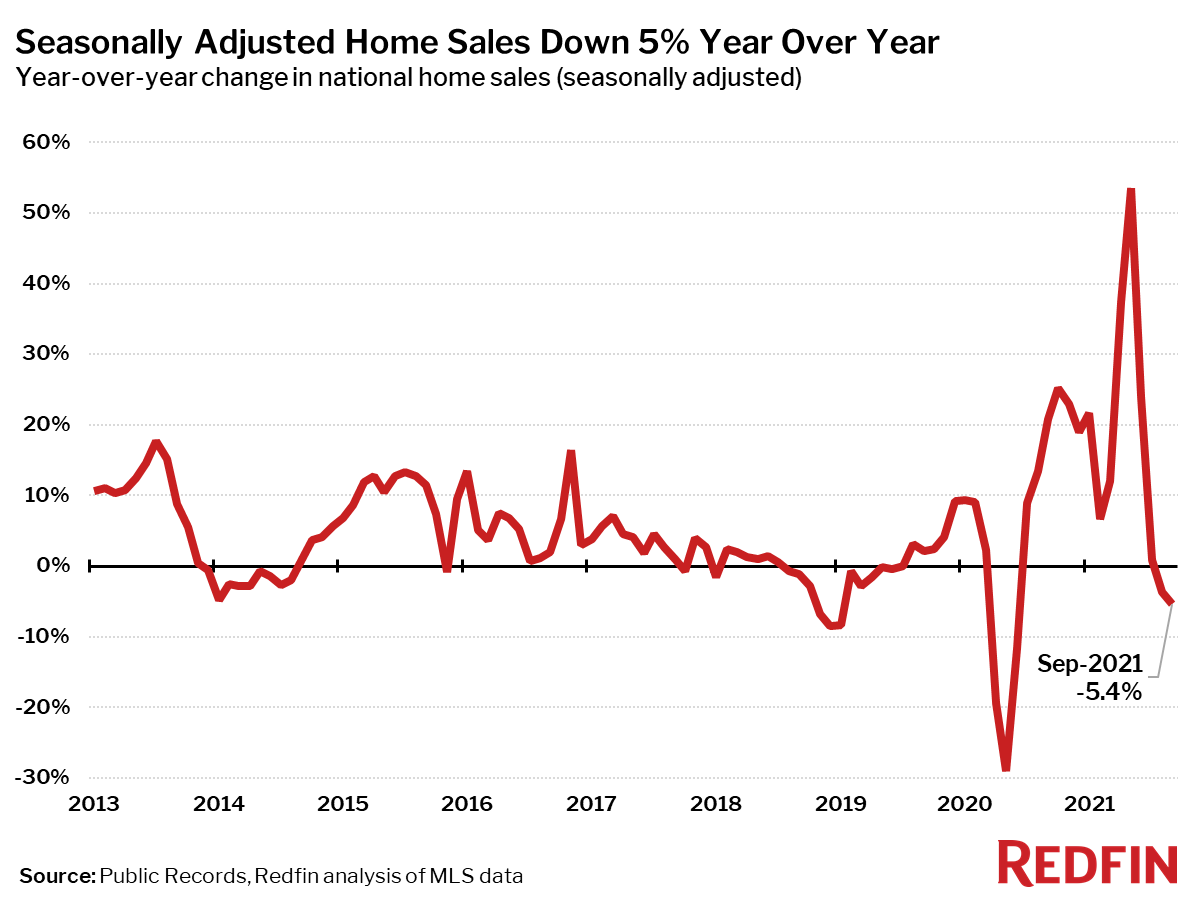
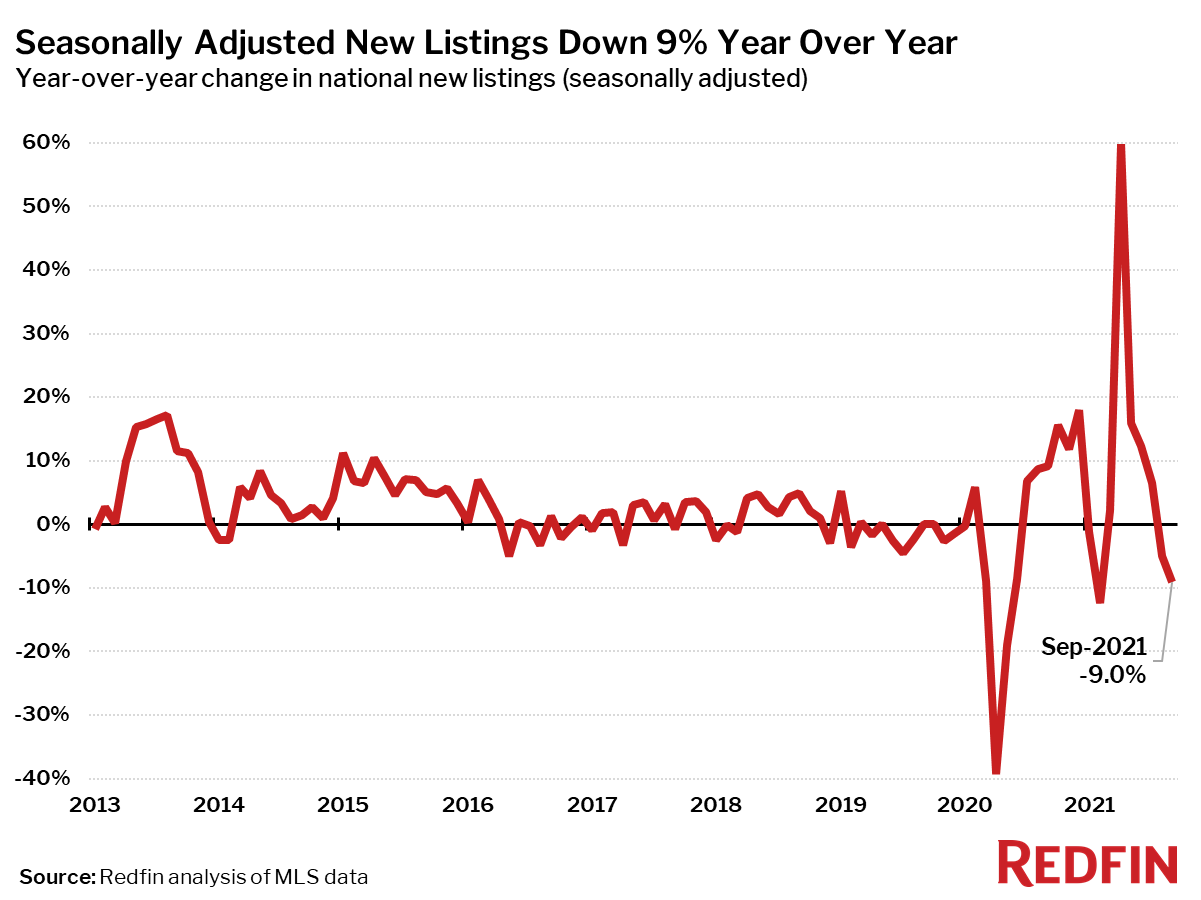
New listings of homes for sale fell 9% from a year earlier and closed home sales were down 5%.

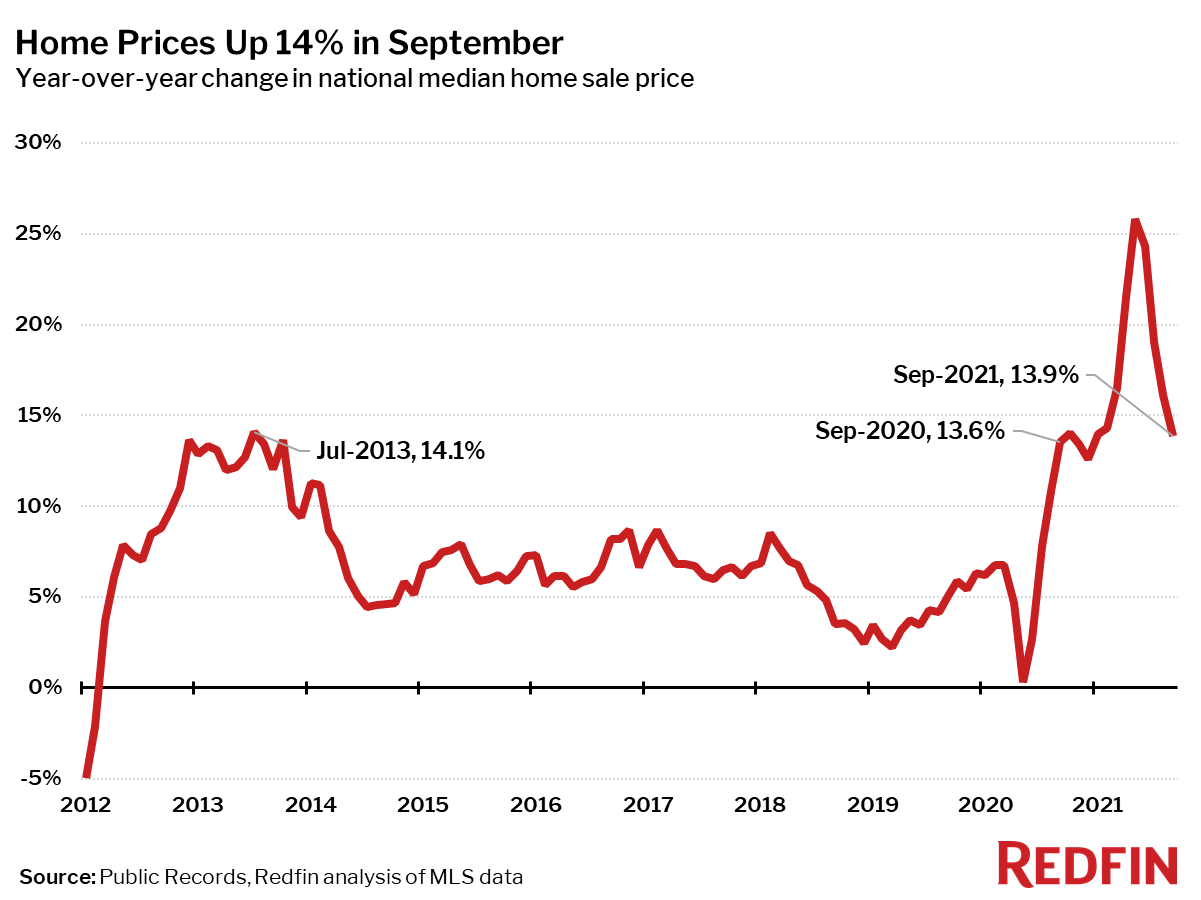
The median price of homes sold in September was $376,800, up 14% from a year earlier, the lowest growth rate since December 2020. September marked the 14th consecutive month of double-digit price gains. Closed home sales and new listings of homes for sale both fell from a year earlier, by 5% and 9% respectively.

“The severe lack of inventory is restricting home sales, said Redfin Chief Economist Daryl Fairweather. “Even though plenty of people bought homes last year, many homebuyers waited while the pandemic went from bad to worse and remote-work policies were finalized. The homebuyers who are just beginning their search are finding that the well has run dry. But I am hopeful that as it becomes easier to get building materials, we will finally have a strong year for new construction in 2022. That’s what the market needs more than anything.”

Market SummarySeptember 2021Month-Over-MonthYear-Over-Year
Median sale price$376,800-0.8%13.9%
Homes sold, seasonally-adjusted613,2001.6%-5.4%
Pending sales, seasonally-adjusted604,9002.9%2.8%
New listings, seasonally-adjusted631,800-2.3%-9.0%
All Homes for sale, seasonally-adjusted1,384,200-2.0%-19.0%
Median days on market182-11
Months of supply1.40-0.3
Sold above list47.8%-4.1 pts13.8 pts
Median Off-Market Redfin Estimate$381,9007.3%19.9%
Average Sale-to-list101.0%-0.6 pts1.6 pts
Average 30-year fixed mortgage rate2.90%+0.06 pts+0.01 pts

† – ‘pts’ = percentage point change

Median sale prices increased from a year earlier in all but one of the 85 largest metro areas Redfin tracks: Bridgeport, CT, where prices were down 2.2%. A year ago prices were up 32% in Bridgeport as the area experienced a sudden flood of interest from homebuyers looking to leave New York. The current price decline is likely a cooling from an extremely overheated state.

The largest price increases in September 2021 were in North Port, FL (+30%), Salt Lake City (+28%) and Austin, TX (+27%).

Home Prices Up 14% in September

Seasonally-adjusted home sales in September were down 5% from a year earlier, the second annual decline in 16 months. Home sales fell in 66 of the 85 largest metro areas Redfin tracks. The biggest sales declines were seen in New Orleans (-42%), Bridgeport, CT (-24%) and Salt Lake City (-23%). The largest gains were in places where sales were still somewhat depressed in September 2020, including New York (+26%), Honolulu (+24%), and San Jose, CA (+15%).

Seasonally Adjusted Home Sales Down 5% Year Over Year

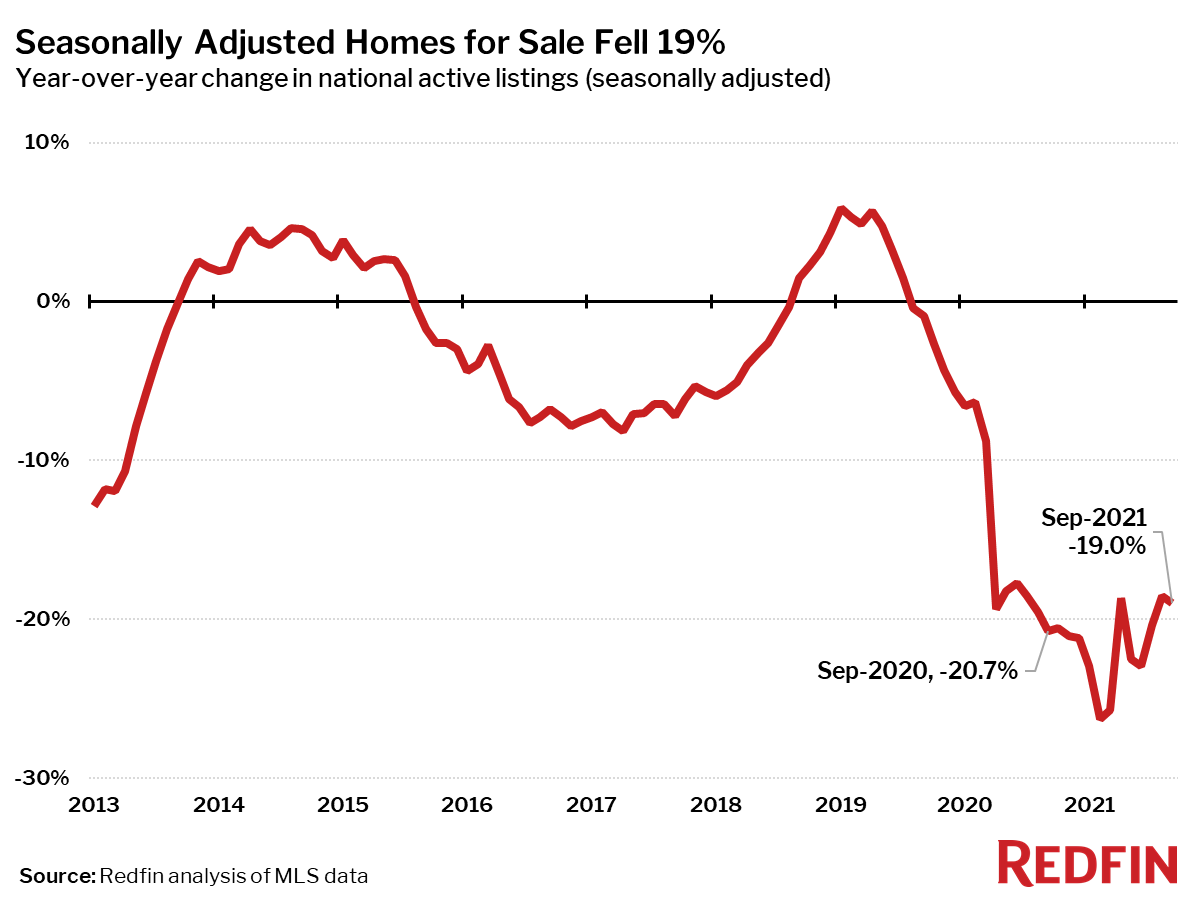
Seasonally adjusted active listings—the count of all homes that were for sale at any time during the month—fell 19% year over year in September, on par with the previous month.

Only three of the 85 largest metros tracked by Redfin posted a year-over-year increase in the number of seasonally adjusted active listings of homes for sale: Austin, TX (+3%), Tacoma, WA (+3%) and Columbus, OH (+0.3%). The biggest year-over-year declines in active housing supply in September were in Baton Rouge, LA (-53%), Salt Lake City (-50%) and Rochester, NY (-47%).

Seasonally Adjusted Homes for Sale Fell 19%

Seasonally adjusted new listings of homes for sale were down 9% in September from a year earlier, only the second decline since February. New listings fell from a year ago in 75 of the 85 largest metro areas. The biggest declines were in Baton Rouge (-59%), Allentown, PA (-57%) and Salt Lake City, UT (-51%). New listings rose the most from a year ago in Austin, TX (+18%), Tacoma, WA (+9%) and Portland, OR (+8%).

Seasonally Adjusted New Listings Down 9% Year Over Year

Measures of housing market competition based on completed home sales eased further in September.

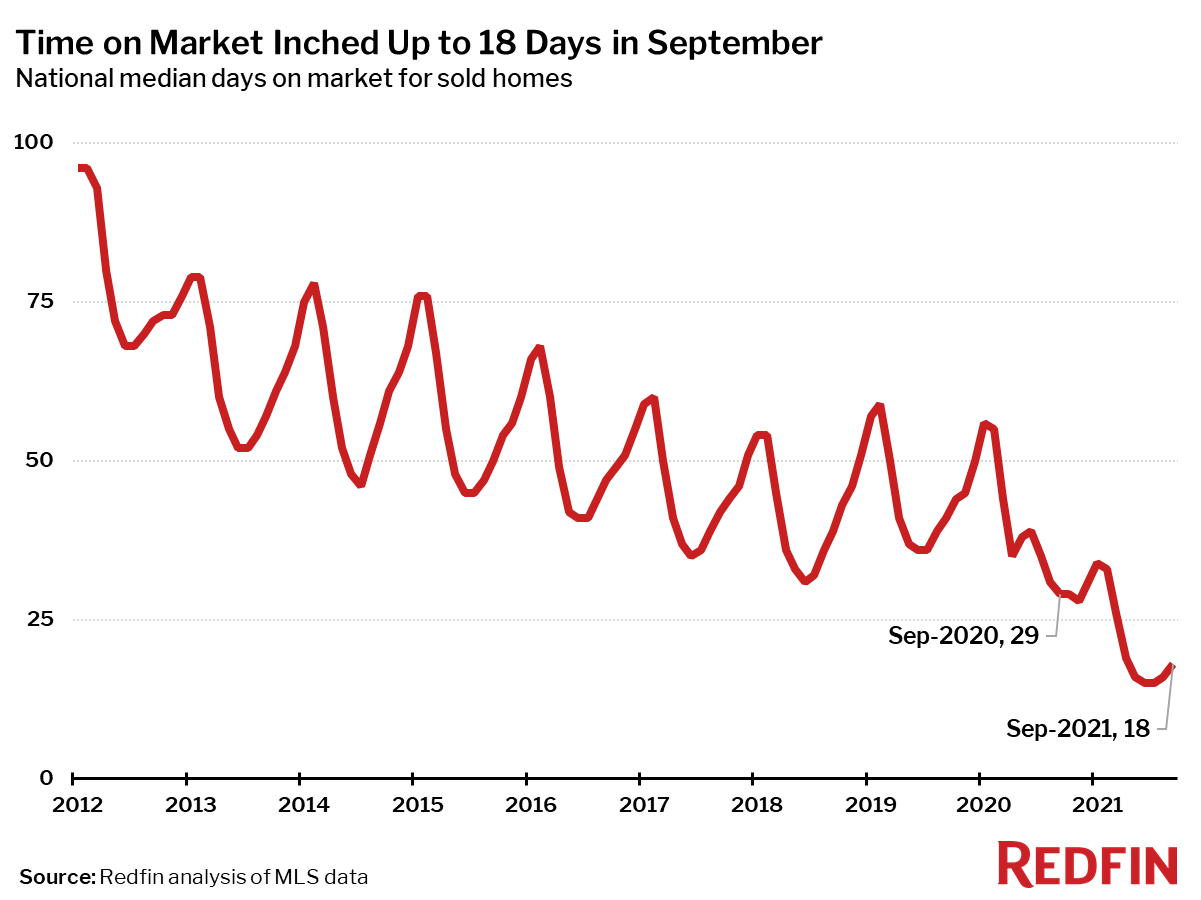
The typical home that sold in September went under contract in 18 days—more than a week faster than a year earlier, when homes sold in a median 29 days, but up three days from the record low in June.

Time on Market Inched Up to 18 Days in September

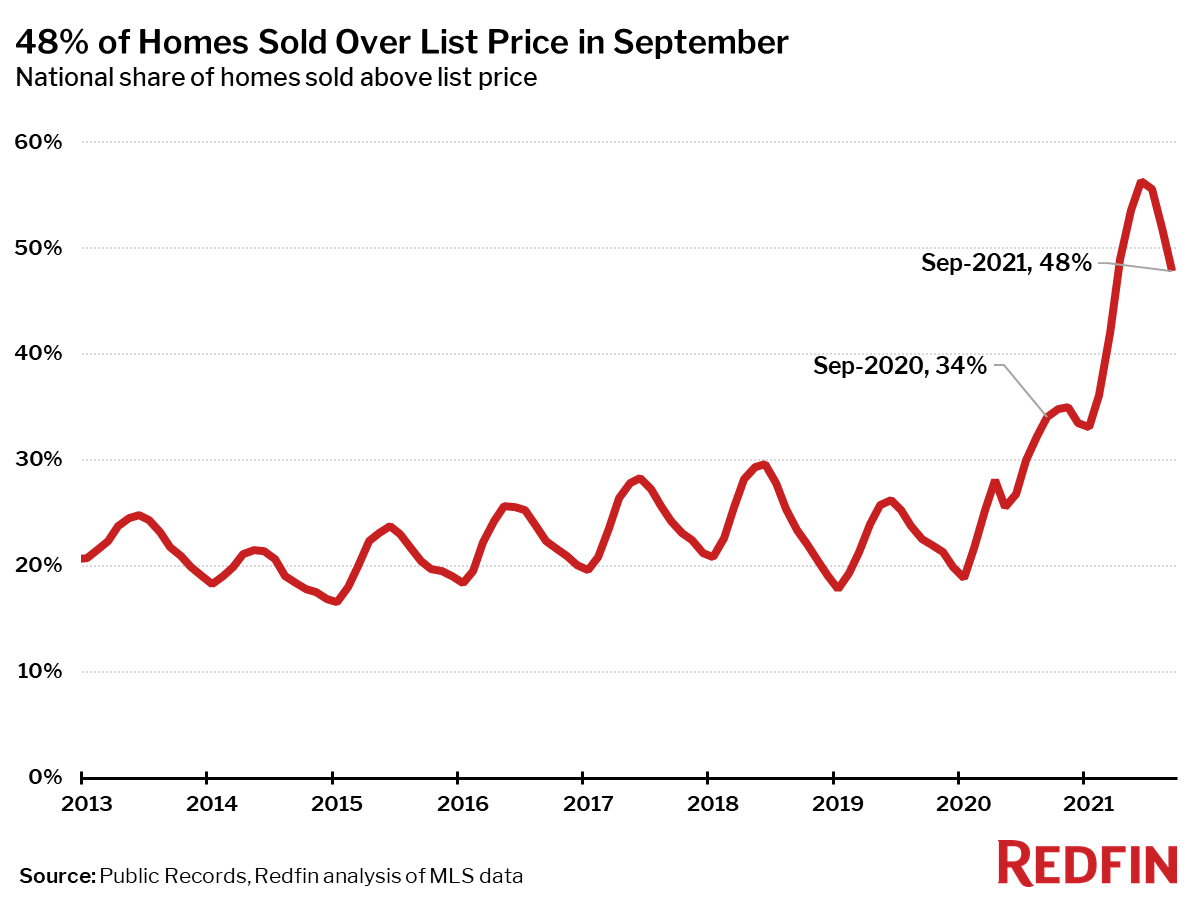
In September, 48% of homes sold above list price, down 8 percentage points from the record high in June, but up 14 percentage points from a year earlier.

48% of Homes Sold Over List Price in September

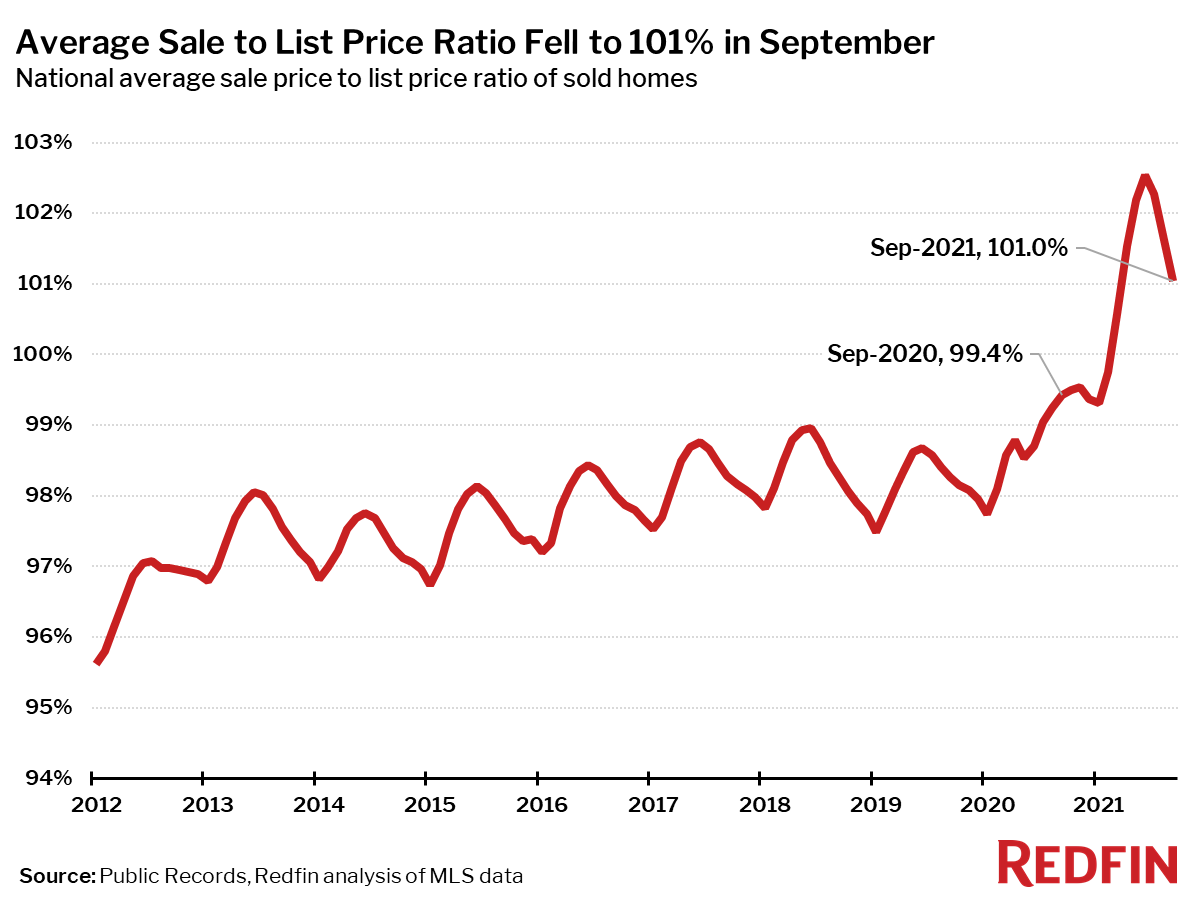
The average sale-to-list price ratio also dipped slightly in September to 101%, down from a record high of 102.5% in June but up from 99.4% a year earlier.

Average Sale to List Price Ratio Fell to 101% in September

Other September Highlights

Competition

Prices

Sales

Inventory

Redfin Estimate

Below are market-by-market breakdowns for prices, inventory, new listings and sales for markets with populations of 750,000 or more. For downloadable data on all of the markets Redfin tracks, visit the Redfin Data Center.

Median Sale Price

Redfin MetroMedian Sale PriceMonth-Over-MonthYear-Over-Year
Albany, NY$270,0000.0%9.1%
Allentown, PA$270,5000.2%13.9%
Anaheim, CA$900,000-0.6%15.1%
Atlanta, GA$330,0000.0%16.6%
Austin, TX$452,000-4.8%27.3%
Bakersfield, CA$328,5004.3%20.6%
Baltimore, MD$342,000-2.3%5.2%
Baton Rouge, LA$242,400-3.8%7.7%
Birmingham, AL$257,9003.2%5.3%
Boston, MA$605,000-4.0%8.0%
Bridgeport, CT$484,000-8.7%-2.2%
Buffalo, NY$217,800-3.0%15.4%
Camden, NJ$275,0000.0%17.0%
Charleston, SC$355,000-1.4%13.6%
Charlotte, NC$343,0000.0%16.3%
Chicago, IL$294,500-3.4%6.7%
Cincinnati, OH$240,000-2.4%10.6%
Cleveland, OH$185,900-7.1%6.2%
Columbus, OH$279,900-1.8%13.4%
Dallas, TX$375,000-1.1%17.2%
Dayton, OH$180,0000.6%6.5%
Denver, CO$530,0000.0%16.5%
Detroit, MI$186,0003.3%12.7%
El Paso, TX$200,000-4.3%9.3%
Elgin, IL$270,000-1.8%8.0%
Fort Lauderdale, FL$350,000-1.4%14.8%
Fort Worth, TX$315,0000.0%18.9%
Frederick, MD$480,000-4.0%8.3%
Fresno, CA$370,000-0.3%15.6%
Grand Rapids, MI$269,7001.2%10.1%
Greensboro, NC$230,0002.5%16.2%
Greenville, SC$269,500-2.2%14.2%
Hartford, CT$275,000-3.5%9.1%
Houston, TX$300,000-2.3%14.8%
Indianapolis, IN$250,0000.0%11.1%
Jacksonville, FL$310,5000.5%19.4%
Kansas City, MO$270,000-1.8%3.9%
Knoxville, TN$289,0000.2%18.0%
Lake County, IL$292,0000.7%6.2%
Las Vegas, NV$378,0000.8%19.3%
Los Angeles, CA$815,000-0.6%12.1%
Louisville, KY$240,0001.5%8.1%
McAllen, TX$203,5008.8%25.1%
Memphis, TN$245,000-1.2%1.2%
Miami, FL$406,800-0.8%14.6%
Milwaukee, WI$270,0000.0%10.2%
Minneapolis, MN$345,000-1.4%10.8%
Montgomery County, PA$390,000-3.7%8.2%
Nashville, TN$390,000-0.8%19.1%
Nassau County, NY$590,000-1.7%12.4%
New Brunswick, NJ$429,000-0.2%11.1%
New Haven, CT$275,000-2.5%5.8%
New Orleans, LA$289,4007.6%17.2%
New York, NY$650,000-3.7%13.0%
Newark, NJ$465,000-4.1%6.7%
North Port, FL$389,0003.5%29.7%
Oakland, CA$940,0000.0%13.3%
Oklahoma City, OK$226,3002.9%9.9%
Omaha, NE$250,000-2.0%8.2%
Orlando, FL$335,0000.3%18.8%
Oxnard, CA$765,500-1.2%9.4%
Philadelphia, PA$260,000-4.1%6.1%
Phoenix, AZ$417,0001.2%25.6%
Pittsburgh, PA$210,800-4.2%4.9%
Portland, OR$500,000-3.3%11.2%
Providence, RI$385,000-0.9%14.9%
Raleigh, NC$380,5001.5%20.8%
Richmond, VA$317,500-2.3%7.8%
Riverside, CA$505,0000.0%16.1%
Rochester, NY$195,000-2.5%11.4%
Sacramento, CA$550,0000.0%16.7%
Salt Lake City, UT$489,0003.6%27.8%
San Antonio, TX$297,0000.7%14.2%
San Diego, CA$760,0002.0%14.8%
San Francisco, CA$1,530,0001.3%5.5%
San Jose, CA$1,340,000-1.1%11.8%
Seattle, WA$710,900-2.6%11.8%
St. Louis, MO$230,0000.0%7.5%
Tacoma, WA$501,000-0.8%16.5%
Tampa, FL$320,0001.6%20.1%
Tucson, AZ$321,4002.1%23.1%
Tulsa, OK$225,000-2.2%5.6%
Honolulu, HI$683,500-2.4%6.5%
Virginia Beach, VA$283,000-2.4%4.8%
Warren, MI$270,000-1.7%8.9%
Washington, D.C.$480,000-2.0%5.0%
West Palm Beach, FL$365,0000.0%14.1%
Worcester, MA$371,0000.3%11.9%
National$376,800-0.8%13.9%

Homes Sold

Redfin MetroHomes SoldMonth-Over-MonthYear-Over-Year
Albany, NY1,079-11.0%-5.6%
Allentown, PA1,002-8.9%-12.6%
Anaheim, CA3,027-5.1%-9.5%
Atlanta, GA9,936-10.4%-7.7%
Austin, TX3,372-7.0%-10.3%
Bakersfield, CA826-9.1%-10.8%
Baltimore, MD4,323-8.4%-0.1%
Baton Rouge, LA1,011-1.9%-13.8%
Birmingham, AL1,643-10.9%-2.2%
Boston, MA4,975-11.4%-3.8%
Bridgeport, CT1,394-14.3%-23.5%
Buffalo, NY1,090-15.7%-9.8%
Camden, NJ1,947-8.1%-2.3%
Charleston, SC1,676-11.1%-11.6%
Charlotte, NC4,688-6.9%-2.8%
Chicago, IL9,704-14.3%-6.1%
Cincinnati, OH3,025-8.2%-7.6%
Cleveland, OH3,176-2.7%6.5%
Columbus, OH3,341-6.3%2.8%
Dallas, TX6,457-6.6%-8.1%
Dayton, OH1,2250.4%-3.2%
Denver, CO5,574-6.8%-9.2%
Detroit, MI2,097-4.9%-3.0%
El Paso, TX869-13.3%-9.1%
Elgin, IL1,247-12.9%-9.2%
Fort Lauderdale, FL3,035-14.5%-3.9%
Fort Worth, TX3,352-5.7%-5.7%
Frederick, MD1,838-11.9%-2.2%
Fresno, CA843-7.1%3.4%
Grand Rapids, MI1,408-8.3%-17.6%
Greensboro, NC1,122-2.0%9.1%
Greenville, SC1,3590.7%-2.2%
Hartford, CT1,726-10.5%-6.3%
Houston, TX9,447-8.3%0.6%
Indianapolis, IN3,711-4.2%-0.8%
Jacksonville, FL2,821-14.1%-11.5%
Kansas City, MO3,689-7.2%-4.8%
Knoxville, TN1,409-5.2%-4.7%
Lake County, IL1,455-12.2%-8.1%
Las Vegas, NV4,154-3.5%4.9%
Los Angeles, CA6,889-1.5%3.3%
Louisville, KY1,880-2.1%3.2%
McAllen, TX376-13.2%-18.4%
Memphis, TN1,256-15.8%3.7%
Miami, FL2,915-17.8%3.8%
Milwaukee, WI2,181-10.3%-7.3%
Minneapolis, MN6,391-9.8%-5.8%
Montgomery County, PA2,709-16.7%-7.3%
Nashville, TN3,692-9.1%-11.9%
Nassau County, NY2,934-12.5%-8.5%
New Brunswick, NJ3,483-12.5%-18.6%
New Haven, CT1,194-8.5%-7.5%
New Orleans, LA930-28.5%-41.7%
New York, NY7,033-21.0%25.9%
Newark, NJ2,278-20.3%-21.9%
North Port, FL2,091-3.8%-11.2%
Oakland, CA2,941-6.3%2.2%
Oklahoma City, OK2,250-11.6%-6.2%
Omaha, NE1,347-6.5%-6.5%
Orlando, FL4,613-4.6%7.8%
Oxnard, CA8760.1%-7.2%
Philadelphia, PA2,452-7.4%-6.2%
Phoenix, AZ8,8592.9%-1.8%
Pittsburgh, PA2,604-9.1%-9.4%
Portland, OR4,057-4.4%-5.7%
Providence, RI2,2121.4%-2.8%
Raleigh, NC2,401-13.2%-11.6%
Richmond, VA1,982-11.7%6.6%
Riverside, CA5,811-0.5%-4.6%
Rochester, NY1,195-13.8%-14.3%
Sacramento, CA2,954-6.6%-17.8%
Salt Lake City, UT1,515-9.9%-23.3%
San Antonio, TX3,257-8.2%-7.3%
San Diego, CA3,592-3.6%-6.7%
San Francisco, CA1,223-4.6%8.0%
San Jose, CA1,709-3.0%14.7%
Seattle, WA5,312-3.2%-1.1%
St. Louis, MO4,332-6.1%-1.3%
Tacoma, WA1,756-2.1%3.9%
Tampa, FL6,442-3.0%3.3%
Tucson, AZ1,483-3.7%-8.7%
Tulsa, OK1,610-2.6%4.1%
Honolulu, HI1,020-4.1%23.6%
Virginia Beach, VA3,051-7.7%7.7%
Warren, MI4,135-3.5%-12.5%
Washington, D.C.6,963-12.9%-9.1%
West Palm Beach, FL2,811-14.4%-13.2%
Worcester, MA1,231-5.0%3.0%
National613,2001.6%-5.4%

New Listings

Redfin MetroNew ListingsMonth-Over-MonthYear-Over-Year
Albany, NY1,118-16.6%-20.9%
Allentown, PA534-35.3%-57.3%
Anaheim, CA2,567-16.1%-27.4%
Atlanta, GA9,548-14.1%-10.4%
Austin, TX3,840-7.3%17.6%
Bakersfield, CA992-6.0%-5.7%
Baltimore, MD4,408-10.4%-8.5%
Baton Rouge, LA440-40.0%-59.0%
Birmingham, AL1,543-14.9%-13.0%
Boston, MA6,47832.2%-4.6%
Bridgeport, CT1,338-5.8%-30.7%
Buffalo, NY1,113-24.7%-22.8%
Camden, NJ1,845-14.7%-15.8%
Charleston, SC1,753-5.3%-2.2%
Charlotte, NC3,143-26.2%-36.0%
Chicago, IL10,927-7.4%-10.1%
Cincinnati, OH3,123-15.0%-7.1%
Cleveland, OH3,287-5.7%-4.2%
Columbus, OH3,305-9.7%1.3%
Dallas, TX6,655-10.0%-2.4%
Dayton, OH1,273-11.5%-7.0%
Denver, CO5,9180.3%0.4%
Detroit, MI2,561-11.5%2.2%
El Paso, TX956-5.7%-1.4%
Elgin, IL1,144-18.1%-7.7%
Fort Lauderdale, FL2,995-12.4%-25.2%
Fort Worth, TX3,415-6.8%1.9%
Frederick, MD1,9692.0%-1.3%
Fresno, CA883-9.2%-6.8%
Grand Rapids, MI1,536-5.9%-4.4%
Greensboro, NC780-24.3%-27.4%
Greenville, SC1,309-9.3%-2.7%
Hartford, CT1,788-6.4%-15.0%
Houston, TX10,080-13.5%3.0%
Indianapolis, IN3,727-7.4%-7.4%
Jacksonville, FL3,131-8.4%5.8%
Kansas City, MO3,464-12.8%-11.5%
Knoxville, TN1,203-17.2%-11.3%
Lake County, IL1,291-15.3%-12.9%
Las Vegas, NV4,416-11.4%-4.4%
Los Angeles, CA6,806-10.8%-18.9%
Louisville, KY1,997-6.6%-0.7%
McAllen, TX503-13.3%-10.5%
Memphis, TN1,260-15.7%-3.7%
Miami, FL3,908-5.9%-2.2%
Milwaukee, WI2,212-9.2%-8.0%
Minneapolis, MN6,586-8.0%-10.4%
Montgomery County, PA2,555-9.0%-13.3%
Nashville, TN3,801-0.7%-5.8%
Nassau County, NY2,986-9.8%-28.8%
New Brunswick, NJ3,491-14.7%-29.2%
New Haven, CT1,168-16.5%-23.1%
New Orleans, LA773-49.1%-49.4%
New York, NY8,7196.6%-22.6%
Newark, NJ2,464-8.4%-27.7%
North Port, FL2,169-8.2%-9.7%
Oakland, CA3,078-4.2%-3.9%
Oklahoma City, OK2,231-16.6%-2.1%
Omaha, NE1,353-0.3%-3.8%
Orlando, FL4,599-10.8%-3.6%
Oxnard, CA806-14.0%-32.4%
Philadelphia, PA2,988-2.2%-10.0%
Phoenix, AZ8,765-10.2%-12.0%
Pittsburgh, PA2,870-11.0%0.5%
Portland, OR4,150-4.0%8.3%
Providence, RI2,292-6.3%-14.3%
Raleigh, NC2,6581.3%-1.6%
Richmond, VA1,890-11.6%-10.7%
Riverside, CA6,307-5.9%-3.8%
Rochester, NY967-20.6%-31.6%
Sacramento, CA3,111-3.4%-12.8%
Salt Lake City, UT879-40.0%-51.3%
San Antonio, TX3,401-15.2%1.3%
San Diego, CA3,204-11.9%-14.4%
San Francisco, CA1,33515.4%-29.4%
San Jose, CA1,550-9.1%-11.4%
Seattle, WA5,3550.4%-6.3%
St. Louis, MO2,345-37.0%-49.0%
Tacoma, WA1,734-5.7%9.1%
Tampa, FL6,535-6.1%3.2%
Tucson, AZ1,7191.5%-6.8%
Tulsa, OK1,540-17.0%-2.4%
Honolulu, HI907-8.0%3.7%
Virginia Beach, VA2,812-15.5%-0.8%
Warren, MI4,417-14.0%-2.9%
Washington, D.C.7,7810.9%-8.0%
West Palm Beach, FL3,173-0.5%-16.1%
Worcester, MA1,3990.4%-5.7%
National631,800-2.3%-9.0%

All Homes for Sale

Redfin MetroAll Homes for SaleMonth-Over-MonthYear-Over-Year
Albany, NY3,174-7.8%-13.6%
Allentown, PA1,642-21.7%-37.7%
Anaheim, CA6,550-12.9%-35.8%
Atlanta, GA21,830-9.4%-25.2%
Austin, TX9,426-3.5%3.3%
Bakersfield, CA2,249-2.7%-8.1%
Baltimore, MD10,451-6.3%-7.1%
Baton Rouge, LA1,828-21.1%-52.6%
Birmingham, AL4,567-8.8%-21.0%
Boston, MA12,6797.5%-15.1%
Bridgeport, CT5,194-7.4%-28.5%
Buffalo, NY2,394-15.6%-21.7%
Camden, NJ4,918-8.9%-9.4%
Charleston, SC5,308-1.0%-22.8%
Charlotte, NC9,350-14.8%-36.0%
Chicago, IL31,391-4.1%-10.2%
Cincinnati, OH9,198-4.4%-5.2%
Cleveland, OH8,411-4.9%-6.7%
Columbus, OH8,690-5.3%0.3%
Dallas, TX15,451-8.6%-23.4%
Dayton, OH3,028-3.9%-4.9%
Denver, CO9,919-4.4%-14.2%
Detroit, MI6,3910.3%-1.4%
El Paso, TX2,414-7.8%-24.5%
Elgin, IL2,511-10.5%-15.5%
Fort Lauderdale, FL10,676-7.8%-35.4%
Fort Worth, TX7,741-6.9%-17.4%
Frederick, MD4,380-2.7%-2.1%
Fresno, CA1,795-4.3%-4.0%
Grand Rapids, MI2,744-4.7%-14.2%
Greensboro, NC2,081-13.4%-32.6%
Greenville, SC3,886-4.4%-19.8%
Hartford, CT5,153-5.3%-20.1%
Houston, TX27,563-5.7%-10.2%
Indianapolis, IN6,603-7.8%-17.0%
Jacksonville, FL7,444-6.1%-18.8%
Kansas City, MO8,063-7.7%-7.5%
Knoxville, TN4,084-5.3%-13.6%
Lake County, IL3,664-10.3%-17.3%
Las Vegas, NV10,634-4.2%-22.3%
Los Angeles, CA19,577-7.7%-20.5%
Louisville, KY4,468-2.4%-9.7%
McAllen, TX1,719-6.0%-19.4%
Memphis, TN3,235-10.2%-7.4%
Miami, FL15,347-4.0%-21.8%
Milwaukee, WI7,353-4.8%-1.5%
Minneapolis, MN14,368-3.7%-10.3%
Montgomery County, PA6,213-7.7%-15.6%
Nashville, TN8,502-0.8%-28.6%
Nassau County, NY9,782-5.3%-25.6%
New Brunswick, NJ10,510-5.0%-21.4%
New Haven, CT3,946-6.6%-18.9%
New Orleans, LA3,530-18.5%-25.1%
New York, NY37,536-2.0%-21.5%
Newark, NJ8,179-3.3%-18.3%
North Port, FL4,037-4.7%-42.6%
Oakland, CA5,742-4.3%-3.7%
Oklahoma City, OK5,040-7.2%-9.8%
Omaha, NE2,438-3.2%-10.6%
Orlando, FL9,513-6.8%-28.3%
Oxnard, CA2,134-6.6%-26.3%
Philadelphia, PA9,096-2.2%-6.7%
Phoenix, AZ19,636-5.8%-15.4%
Pittsburgh, PA10,328-3.3%-5.9%
Portland, OR7,948-4.1%-8.0%
Providence, RI5,668-3.7%-13.3%
Raleigh, NC5,733-3.1%-30.0%
Richmond, VA3,710-8.8%-12.5%
Riverside, CA15,342-3.1%-11.1%
Rochester, NY1,594-26.4%-46.9%
Sacramento, CA6,141-4.6%-11.9%
Salt Lake City, UT2,084-25.9%-50.3%
San Antonio, TX8,494-8.1%-16.3%
San Diego, CA6,546-11.8%-21.6%
San Francisco, CA2,9710.2%-38.0%
San Jose, CA3,057-10.4%-22.6%
Seattle, WA8,616-5.1%-21.2%
St. Louis, MO7,395-21.2%-36.4%
Tacoma, WA2,953-5.8%2.6%
Tampa, FL12,173-6.6%-20.3%
Tucson, AZ4,4231.0%-12.6%
Tulsa, OK3,327-8.0%-12.2%
Honolulu, HI3,133-6.7%-21.0%
Virginia Beach, VA6,764-10.7%-1.4%
Warren, MI10,282-4.9%-7.9%
Washington, D.C.18,884-3.2%-0.1%
West Palm Beach, FL9,665-4.2%-38.8%
Worcester, MA2,9890.2%-6.6%
National1,384,200-2.0%-19.0%

Median Off-Market Redfin Estimate

Redfin MetroEstimateMonth-Over-MonthYear-Over-Year
Albany, NY$232,7001.8%13.8%
Allentown, PA$263,7005.5%19.8%
Anaheim, CA$919,3004.7%22.2%
Atlanta, GA$301,6005.8%25.2%
Austin, TX$463,30010.5%48.9%
Bakersfield, CA$248,7007.5%21.2%
Baltimore, MD$326,5003.9%16.6%
Baton Rouge, LA$145,400-1.8%9.8%
Birmingham, AL$162,4002.8%16.0%
Boston, MA$616,9002.1%13.4%
Bridgeport, CT$462,6004.8%16.9%
Buffalo, NY$187,5004.5%19.0%
Camden, NJ$267,0006.1%23.9%
Charleston, SC$296,8005.2%20.7%
Charlotte, NC$282,7006.3%28.7%
Chicago, IL$284,300-2.5%6.0%
Cincinnati, OH$207,0005.7%20.2%
Cleveland, OH$173,3004.2%17.4%
Columbus, OH$244,9005.5%17.9%
Dallas, TX$332,4007.5%25.6%
Dayton, OH$158,5006.4%21.4%
Denver, CO$524,2007.0%22.1%
Detroit, MI$128,9003.4%19.7%
Elgin, IL$258,500-1.7%9.3%
Fort Lauderdale, FL$329,1004.3%17.0%
Fort Worth, TX$281,9007.2%23.9%
Frederick, MD$493,5003.6%15.9%
Fresno, CA$341,1007.2%25.6%
Grand Rapids, MI$237,6009.7%32.0%
Greensboro, NC$176,8005.1%23.0%
Greenville, SC$201,9006.0%21.2%
Hartford, CT$269,5007.6%18.1%
Houston, TX$248,7006.0%21.2%
Indianapolis, IN$209,8006.7%21.6%
Jacksonville, FL$275,0006.6%25.4%
Kansas City, MO$233,1007.6%22.5%
Knoxville, TN$232,0005.4%24.5%
Lake County, IL$246,800-0.2%9.8%
Las Vegas, NV$362,8005.7%24.3%
Los Angeles, CA$801,5005.0%20.5%
Louisville, KY$195,100-0.9%6.1%
Memphis, TN$184,9003.1%19.2%
Miami, FL$382,7005.6%18.7%
Milwaukee, WI$252,6005.5%16.5%
Minneapolis, MN$328,8005.2%16.0%
Montgomery County, PA$396,0004.8%18.0%
Nashville, TN$354,1007.5%23.3%
Nassau County, NY$581,2003.6%16.1%
New Brunswick, NJ$431,1005.3%21.0%
New Haven, CT$277,6007.7%21.9%
New Orleans, LA$195,700-0.5%10.8%
Newark, NJ$439,3001.9%16.1%
North Port, FL$312,7008.6%28.5%
Oakland, CA$1,002,7005.5%25.1%
Oklahoma City, OK$177,0005.7%16.8%
Omaha, NE$231,2003.6%17.1%
Orlando, FL$296,2007.5%22.2%
Oxnard, CA$754,7005.7%22.2%
Philadelphia, PA$230,8001.5%15.1%
Phoenix, AZ$396,90011.8%39.3%
Pittsburgh, PA$158,7003.2%12.8%
Portland, OR$499,4005.9%20.9%
Providence, RI$371,3004.8%20.7%
Raleigh, NC$336,9008.8%26.1%
Richmond, VA$279,6002.4%13.7%
Riverside, CA$452,6007.2%31.1%
Rochester, NY$176,5004.7%17.0%
Sacramento, CA$549,5008.0%28.3%
Salt Lake City, UT$500,40011.7%34.6%
San Antonio, TX$231,4006.9%21.5%
San Diego, CA$795,5005.4%26.1%
San Francisco, CA$1,531,9003.7%11.3%
San Jose, CA$1,436,4005.1%21.8%
Seattle, WA$724,8005.1%23.1%
St. Louis, MO$181,9005.3%10.5%
Tacoma, WA$490,2006.5%27.1%
Tampa, FL$282,4008.1%23.1%
Tucson, AZ$270,5004.8%26.6%
Tulsa, OK$155,5002.6%12.8%
Honolulu, HI$819,9003.0%16.4%
Virginia Beach, VA$273,3003.0%13.2%
Warren, MI$257,1004.2%17.0%
Washington, D.C.$476,6003.5%15.4%
West Palm Beach, FL$344,6005.8%21.4%
Worcester, MA$350,9004.9%19.9%
National$381,9007.3%19.9%

read more…

redfin.com/news/

China’s real estate market struggles | Armonk Real Estate

China’s housing market slump has intensified in recent weeks as sales plunge and more developers default on their debt. Now the downturn has reached another milestone: home prices have begun falling for the first time in six years.

The 0.08% drop in new-home prices across 70 cities in September may be small, but it poses a potentially big blow for an economy that counts on property-related industries for almost a quarter of output.

Homebuyer sentiment is evaporating as a crisis at China Evergrande Group ripples through the industry. With prospective buyers already wondering whether cash-strapped builders can deliver their apartments, the risk is that they stay away in droves on fears that real estate is no longer a safe bet.

“Now the priority is to prevent a state of panic,” said Yan Yuejin, research director at Shanghai-based E-house China Research and Development Institute. “The home market has clearly entered a downward cycle.”

Developers are struggling with regulatory tightening that has helped to choke off fresh financing and made it harder to pay bills. Evergrande alone owes more than $300 billion, and has yet to finish homes for 1.6 million buyers who put down deposits.

The drop in confidence has affected people like Carl, a property investment consultant in eastern Hangzhou. He says the number of prospective clients tumbled around 90% last month from the second quarter.

“Business is so light,” Carl said, asking not to give his full name while talking about government policy. One customer “became less and less interested each time we called him, and later on he wouldn’t even pick up our calls.”

The real estate downturn is already hurting China’s economy, which is also being dragged down by power shortages. Economic growth slowed in the third quarter as the property and construction industries contracted for the first time since the start of the pandemic.

Peak Season

September is traditionally a peak season for the home market. Yet residential sales tumbled 17%, investments slid for the first time since early 2020, and the rate of failed land auctions climbed to the highest since at least 2018 — potentially hurting local government coffers.

Smaller cities, where the economy is weaker, were hit the most by last month’s price declines. Existing-home values slid 0.21% in 35 so-called tier-3 cities, the most since early 2015, National Bureau of Statistics figures showed Wednesday.

About three-quarters of cities saw second-hand home values fall from a month earlier. A price war is set to intensify in the coming months as landlords in wait-and-see mode surrender to the cooling trend, Yan said.

The downturn has continued into this month. Existing-home sales plunged 63% from a year earlier in the first 17 days of October, according to a Nomura Holdings Inc. note Monday.

“The effects of developers’ price discounts are waning,” Yang Kewei, a research director at China Real Estate Information Corp., said before the figures were released.

A Bloomberg index of China developer stocks fell 0.5% on Wednesday, taking its decline to 24% this year.

Fears of contagion from the crisis at Evergrande are brewing. Sinic Holdings Group Co. became the latest Chinese real estate firm to default as investors wait to see whether Evergrande will meet overdue interest payments on dollar bonds this week.

Yields on Chinese high-yield dollar bonds, which are dominated by builders, have climbed to their highest in about a decade, hurting a key funding channel for the sector.

That will have a knock-on effect on the broader economy, since Goldman Sachs Group Inc. estimates the property sector and related industries make up about 23% of gross domestic product.

Faster Mortgages

So far, authorities are largely resisting the urge to ease up on the industry. Regulators have told banks to speed up mortgage lending again, Bloomberg reported last week, but the central bank signaled on Friday it would keep monetary policy broadly unchanged in the near term.

Moves in the property and financial markets are a “stress reaction” to some defaults, People’s Bank of China Deputy Governor Pan Gongsheng said Wednesday at a Beijing conference, China Business News reported. Property sector financing and costs have gradually been normalizing, Pan was quoted as saying.

There are “individual problems” in the real estate market, but the risks are controllable overall, Vice Premier Liu He said at the same event, according to the official Xinhua News Agency. Reasonable funding needs in the sector are being met, Liu was quoted as saying.

Some analysts expect the current real estate slump to be less harsh than previous ones because inventories remain relatively small. Developers have been more rational about building projects in coastal cities where demand is higher, said Chen Long, a partner at Beijing-based consultancy Plenum.

“The relatively low stock of unsold housing limits the risk of a major downturn,” Oxford Economics said in a note on Wednesday. “We think the most likely scenario is a contained short-term downturn.”

Still, any recovery will be difficult until home values resume rising.

“If property prices stop growing, we won’t buy,” said Jack, a tech worker in Shenzhen who didn’t want to be identified by his surname for fear of reprisals from his company. “Right now, I’ll sit and watch.”

read more…

bloomberg.com