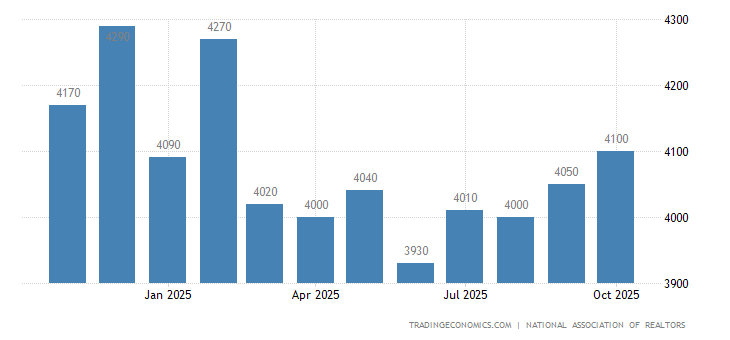
Sales of previously owned houses in the United States rose 0.7 percent month-over-month to a seasonally adjusted annual rate of 5.39 million in September 2017 from a year low of 5.35 million in August, beating market expectations of a 1 percent fall. Still, ongoing supply shortages and recent hurricanes muted overall activity. Sales of single family houses increased 1.1 percent to 4.79 million after falling 2.1 percent in August, while those of condos fell 1.6 percent to 0.60 million, following a 1.7 percent decline. The median house price fell to $245,100 from $253,100 in August and the months’ worth of supply was steady at 4.2 percent. In addition, the number of houses available in the market rose to 1.90 million from 1.87 million in August. Existing Home Sales in the United States averaged 3912.19 Thousand from 1968 until 2017, reaching an all time high of 7250 Thousand in September of 2005 and a record low of 1370 Thousand in March of 1970.

| Calendar | GMT | Actual | Previous | Consensus | TEForecast | |||
|---|---|---|---|---|---|---|---|---|
| 2017-08-24 | 02:00 PM | Existing Home Sales | 5.44M | 5.51M | 5.57M | 5.55M | ||
| 2017-09-20 | 02:00 PM | Existing Home Sales | 5.35M | 5.44M | 5.46M | 5.45M | ||
| 2017-10-20 | 02:00 PM | Existing Home Sales | 5.39M | 5.35M | 5.30M | 5.29M | ||
| 2017-11-21 | 03:00 PM | Existing Home Sales | 5.39M | 5.36M | ||||
| 2017-12-20 | 03:00 PM | Existing Home Sales | 5.42M | |||||
| United States Housing | Last | Previous | Highest | Lowest | Unit | |
|---|---|---|---|---|---|---|
| Building Permits | 1215.00 | 1272.00 | 2419.00 | 513.00 | Thousand | [+] |
| Housing Starts | 1127.00 | 1183.00 | 2494.00 | 478.00 | Thousand | [+] |
| New Home Sales | 560.00 | 580.00 | 1389.00 | 270.00 | Thousand | [+] |
| Pending Home Sales | -2.60 | -1.30 | 30.90 | -24.30 | percent | [+] |
| Existing Home Sales | 5390.00 | 5350.00 | 7250.00 | 1370.00 | Thousand | [+] |
| Construction Spending | 0.50 | -1.20 | 5.90 | -4.80 | percent | [+] |
| Housing Index | 0.20 | 0.10 | 1.20 | -1.80 | percent | [+] |
| Nahb Housing Market Index | 68.00 | 64.00 | 78.00 | 8.00 | [+] | |
| Mortgage Rate | 4.14 | 4.16 | 10.56 | 3.47 | percent | [+] |
| Mortgage Applications | 3.60 | -2.10 | 49.10 | -38.80 | percent | [+] |
| Home Ownership Rate | 63.70 | 63.60 | 69.20 | 62.90 | percent | [+] |
| Case Shiller Home Price Index | 201.99 | 200.53 | 206.52 | 100.00 | Index Points | [+] |
United States Existing Home Sales
Existing Home Sales occurs when the mortgage is closed. Mortgage closing usually takes place 30-60 days after the sales contract is closed. . This page provides the latest reported value for – United States Existing Home Sales – plus previous releases, historical high and low, short-term forecast and long-term prediction, economic calendar, survey consensus and news. United States Existing Home Sales – actual data, historical chart and calendar of releases – was last updated on October of 2017.
| Actual | Previous | Highest | Lowest | Dates | Unit | Frequency |
|---|---|---|---|---|---|---|
| 5390.00 | 5350.00 | 7250.00 | 1370.00 | 1968 – 2017 | Thousand | Monthly |
read more…
https://tradingeconomics.com/united-states/existing-home-sales
