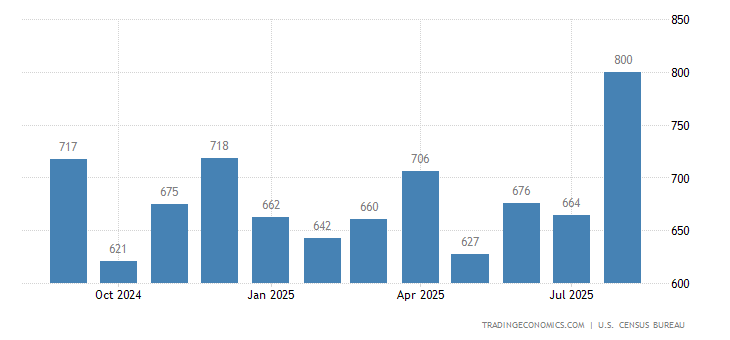
Sales of new single family homes in the United States jumped 17.5 percent to a seasonally adjusted annual rate of 733 thousand in November of 2017 from a downwardly revised 624 thousand in October and beating market forecasts of 654 thousand. It was the strongest number since July of 2007. Sales rose in all four regions. New Home Sales in the United States averaged 650.82 Thousand from 1963 until 2017, reaching an all time high of 1389 Thousand in July of 2005 and a record low of 270 Thousand in February of 2011.

US New Home Sales Highest Since July 2007
Sales of new single-family houses in the United States jumped 17.5 percent to a seasonally adjusted annual rate of 733 thousand in November of 2017 from a downwardly revised 624 thousand in October and beating market forecasts of 654 thousand. Sales rose in all four regions.
Sales surged in all four main regions: South (14.9 percent to 416 thousand); West (31.1 percent to 194 thousand); Midwest (6.9 percent to 77 thousand) and Northeast (9.5 percent to 46 thousand):
The median sales price of new houses sold was $318,700, above $315,000 a year earlier. The average sales price was $377,100, also higher than $363,400 in November of 2016.
The stock of new houses for sale was flat at 283 thousand. This represents a supply of 4.6 months at the current sales rate.
Year-on-year, new home sales increased 26.6 percent.
read more…
https://tradingeconomics.com/united-states/new-home-sales
