The last earnings reports from homebuilders like Toll Brothers (TOL) and KB Home (KBH) have delivered very positive outlooks on the current housing market: see “A Swell Of Pent Up Demand Supports The Surge In Toll Brothers” and “KB Home Going ‘On Offense’ As Its Housing Markets And Pricing Power Strengthen.”
The latest housing price data from the Federal Housing Finance Agency (FHFA), released August 23, seem to corroborate this bullishness. The FHFA report shows what looks like a firming in pricing power for sellers. If this bottoming in prices is sustained, then the housing market is well on target for the bottom in 2013 that I have anticipated since 2009 (for example, see 2010 article “Still Expecting Housing to Bounce Along the Bottom Until 2013“).
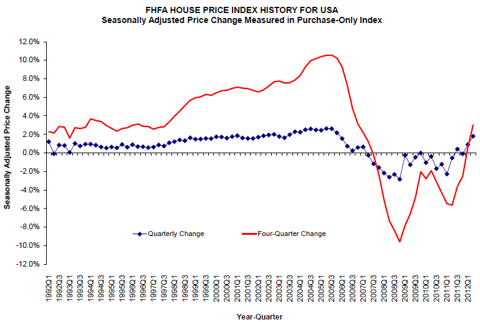
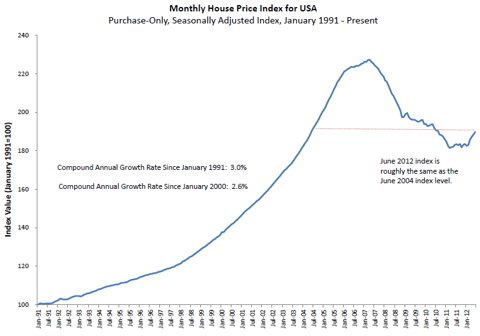
According to the FHFA data, the first and second quarter of this year delivered the first year-over-year increase in the seasonally adjusted purchase-only house price index ()HPI)( since the first and second quarters of 2007. The second quarter registered a 1.3% inflation-adjusted price increase. Forty-three states experienced price increases. The two FHFA charts below show a distinct stabilization in prices. The chart of price changes shows an encouraging pattern of higher highs and higher lows that signifies a sustained trend upward from the bottom. The price index indicates downward momentum came to a screeching halt last yearת with 2012 building off that base.
FHFA HOUSE PRICE INDEX HISTORY FOR U.S.A.: Seasonally Adjusted Price Change Measured in Purchase-Only Index
(click to enlarge)
Monthly House Price Index for U.S.A.: Purchase-Only, Seasonally Adjusted Index, January 1991 – Present
(Download data here)
The FHFA also released its new “distress-free” measures for the purchase-only HPI. As the FHFA explains:
“The Highlights article in the 2012Q1 HPI release noted that FHFA was evaluating various options for producing “distress-free” house price indexes. These indexes would remove the effect of short sales and real estate owned ((REO() transactions (bank sales of foreclosed property) from the HPI. The article indicated that, in some situations, distress-free measures might be less noisy than the traditional HPI and might provide more relevant measures of changes in house prices.”
The FHFA uses three databases to construct this new measure of housing prices:
“…To identify short sales and REO sales in this analysis, three different databases are being used. The…mortgage performance data from the Enterprises and FHA comprise the first database. As indicated earlier, these data can be used to directly identify mortgage distress and REO sales where the sellers had Enterprise or FHA loans…
The second database includes information on foreclosure deeds recorded at county recorder offices. FHFA has licensed county deed recordations from DataQuick Information Systems for many counties throughout the country and, because the foreclosure process often culminates with certain types of deeds being recorded, deed information can be used to flag REO sales…
The third database that can be used is a dataset FHFA recently licensed from CoreLogic. The dataset includes specific types of earlier-stage foreclosure filings that have been recorded at county recorder offices. In many jurisdictions across the country-including many counties in the twelve metropolitan areas analyzed here-certain types for formal notifications must be filed at the county recorder offices before the final phases of foreclosure can be completed.”
I like this measure because it can provide more supporting evidence for the sustainability in price changes. For example, if the distress-free HPI is bottoming along with the full sample, then I can assume that distressed homes are having a lower impact on pricing. This of course says nothing about the potential future changes in inventory of distressed homes.
Latest Housing Price Data Confirm Housing Bottom Is Underway | Pound Ridge Realtor
Leave a reply
via seekingalpha.com


