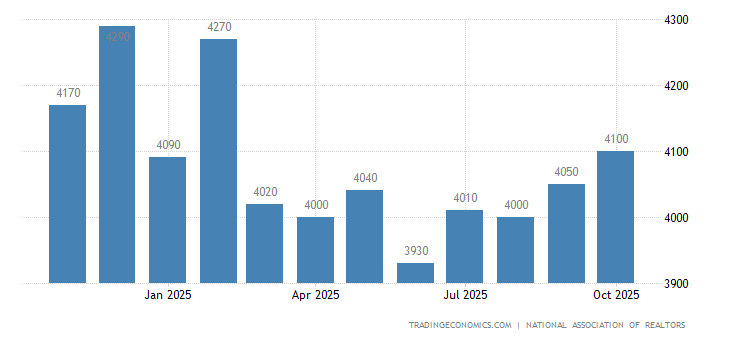
Sales of previously owned houses in the US jumped 3 percent mom to a seasonally adjusted annual rate of 5.54 million in February of 2018 from 5.38 million in January. It compares with market expectations of a 0.5 percent rise to 5.4 million. Sales of single family houses went up 4.2 percent to 4.96 million, following a 3.8 percent drop in January while sales of condos shrank 6.5 percent to 0.580 million after a 1.6 percent rise. The median house price increased to $241,700 from $240,800 in January and the months’ worth of supply was steady at 3.4. In addition, the number of houses available in the market increased to 1.590 million. Year-on-year, existing home sales went up 1.1 percent. Existing Home Sales in the United States averaged 3925.48 Thousand from 1968 until 2018, reaching an all time high of 7250 Thousand in September of 2005 and a record low of 1370 Thousand in March of 1970.
| Calendar | GMT | Actual | Previous | Consensus | TEForecast | |||
|---|---|---|---|---|---|---|---|---|
| 2018-01-24 | 03:00 PM | Existing Home Sales | 5.57M | 5.78M | 5.7M | 5.5M | ||
| 2018-02-21 | 03:00 PM | Existing Home Sales | 5.38M | 5.56M | 5.6M | 5.63M | ||
| 2018-03-21 | 02:00 PM | Existing Home Sales | 5.54M | 5.38M | 5.4M | 5.45M | ||
| 2018-04-23 | 02:00 PM | Existing Home Sales | 5.54M | |||||
| 2018-05-24 | 02:00 PM | Existing Home Sales | ||||||
| 2018-05-24 | 02:00 PM | Existing Home Sales MoM | ||||||
| United States Housing | Last | Previous | Highest | Lowest | Unit | |
|---|---|---|---|---|---|---|
| Building Permits | 1298.00 | 1377.00 | 2419.00 | 513.00 | Thousand | [+] |
| Housing Starts | 1236.00 | 1329.00 | 2494.00 | 478.00 | Thousand | [+] |
| New Home Sales | 593.00 | 643.00 | 1389.00 | 270.00 | Thousand | [+] |
| Pending Home Sales | -3.80 | 0.40 | 30.90 | -24.30 | percent | [+] |
| Existing Home Sales | 5540.00 | 5380.00 | 7250.00 | 1370.00 | Thousand | [+] |
| Construction Spending | 0.00 | 0.80 | 5.90 | -4.80 | percent | [+] |
| Housing Index | 0.30 | 0.50 | 1.20 | -1.80 | percent | [+] |
| Nahb Housing Market Index | 70.00 | 71.00 | 78.00 | 8.00 | [+] | |
| Mortgage Rate | 4.68 | 4.69 | 10.56 | 3.47 | percent | [+] |
| Mortgage Applications | -1.10 | 0.90 | 49.10 | -38.80 | percent | [+] |
| Case Shiller Home Price Index | 204.45 | 204.11 | 206.52 | 100.00 | Index Points | [+] |
| Home Ownership Rate | 64.20 | 63.90 | 69.20 | 62.90 | percent | [+] |
read more…
https://tradingeconomics.com/united-states/existing-home-sales

