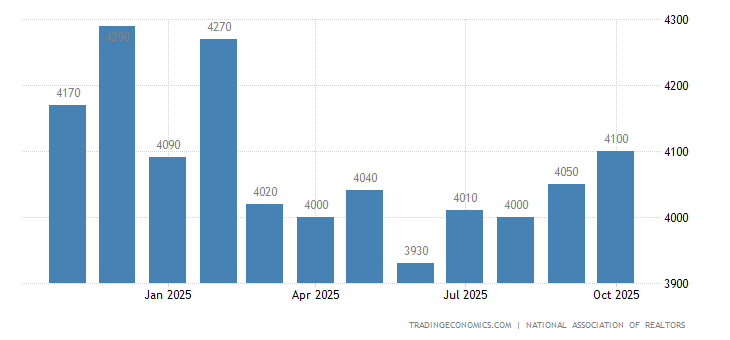
Existing home sales in the US unexpectedly sank 2.7 percent to 5.858 million in April of 2021, compared to forecasts of a 2 percent rise. It marks three consecutive months of declines as housing supply continues to fall short of demand. “We’ll see more inventory come to the market later this year as further COVID-19 vaccinations are administered and potential home sellers become more comfortable listing and showing their homes. The falling number of homeowners in mortgage forbearance will also bring about more inventory”, said Lawrence Yun, NAR’s chief economist. All but one of the four major US regions witnessed month-over-month drops. On the year however, sales surged 33.9 percent. The median existing-home price for all housing types in April was at a record of $341,600, up 19.1 percent from April 2020. Total housing inventory amounted to 1.16 million units, up 10.5 percent from March’s inventory and down 20.5 percent from one year ago. source: National Association of Realtors

| Actual | Previous | Highest | Lowest | Dates | Unit | Frequency | ||
|---|---|---|---|---|---|---|---|---|
| 5850.00 | 6010.00 | 7250.00 | 1370.00 | 1968 – 2021 | Thousand | Monthly | SA |
| Calendar | GMT | Reference | Actual | Previous | Consensus | TEForecast | |
|---|---|---|---|---|---|---|---|
| 2021-04-22 | 02:00 PM | Existing Home Sales MoM | Mar | -3.7% | -6.3% | 0.8% | 0.5% |
| 2021-04-22 | 02:00 PM | Existing Home Sales | Mar | 6.01M | 6.24M | 6.19M | 6.25M |
| 2021-05-21 | 02:00 PM | Existing Home Sales MoM | Apr | -2.7% | -3.7% | 2% | 0.7% |
| 2021-05-21 | 02:00 PM | Existing Home Sales | Apr | 5.85M | 6.01M | 6.09M | 6.05M |
| 2021-06-22 | 02:00 PM | Existing Home Sales | May | 5.85M | 5.7M | ||
| 2021-06-22 | 02:00 PM | Existing Home Sales MoM | May | -2.7% | -1% | ||
| 2021-07-22 | 02:00 PM | Existing Home Sales | Jun | ||||
| 2021-07-22 | 02:00 PM | Existing Home Sales MoM | Jun |
Go to our Calendar for more events. Or learn more about the Calendar API for direct access.
read more…
tradingeconomics.com/united-states
