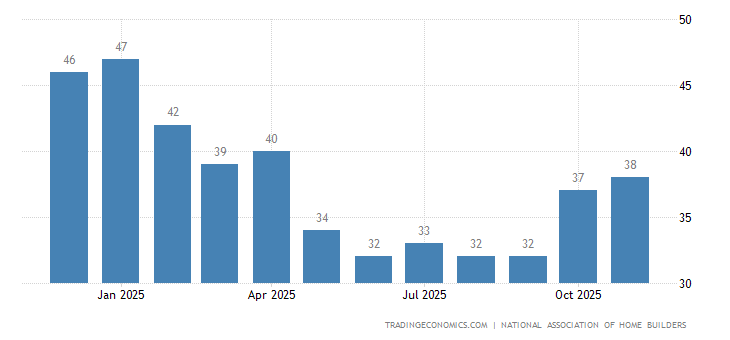
The NAHB Housing Market Index in the United States dropped to 64 in September 2017 from a downwardly revised 67 in the previous month. The reading came in way below market expectations of 67, as recent hurricanes have raised concerns about the availability of labor and the cost of building materials. All three HMI components posted losses in September but remain at healthy levels: current sales conditions fell 4 points to 70, sales expectations in the next six months dropped 4 points to 74 and buyer traffic slipped 1 point to 47. Nahb Housing Market Index in the United States averaged 49.52 from 1985 until 2017, reaching an all time high of 78 in December of 1998 and a record low of 8 in January of 2009.
| Calendar | GMT | Actual | Previous | Consensus | TEForecast |
|---|
| 2017-07-18 | 02:00 PM | NAHB Housing Market Index | 64 | 66 | 67 | 66 |
| 2017-08-15 | 02:00 PM | NAHB Housing Market Index | 68 | 64 | 65 | 65 |
| 2017-09-18 | 02:00 PM | NAHB Housing Market Index | 64 | 67 | 67 | 66 |
| 2017-10-17 | 02:00 PM | NAHB Housing Market Index | 64 | 64.04 |
| 2017-11-16 | 03:00 PM | NAHB Housing Market Index | 64.23 |
| 2017-12-18 | 03:00 PM | NAHB Housing Market Index | |

