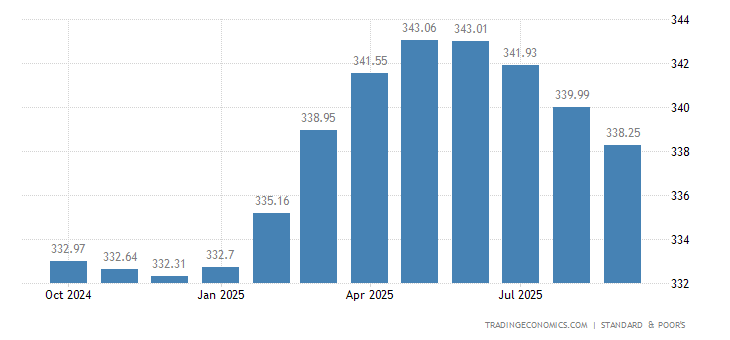
The S&P CoreLogic Case-Shiller composite index of 20 metropolitan areas in the US rose 5.9 percent year-on-year in March of 2017, the same as in February and above market expectations of following a 5.7 percent gain. Prices rose the most in Seattle (12.3 percent), Portland (9.2 percent) and Dallas (8.6 percent). Meanwhile, the national index, covering all nine US census divisions rose 5.8 percent, up from 5.7 percent in February and setting a 33-month high. Case Shiller Home Price Index in the United States averaged 158.44 Index Points from 2000 until 2017, reaching an all time high of 206.52 Index Points in July of 2006 and a record low of 100 Index Points in January of 2000.
| Calendar | GMT | Reference | Actual | Previous | Consensus | Forecast  |
|---|
| 2017-04-25 | 01:00 PM | Feb | 0.4% | 0.2% | | 0.2% |
| 2017-05-30 | 01:00 PM | Mar | 5.9% | 5.9% | 5.7% | 5.8% |
| 2017-05-30 | 01:00 PM | Mar | 1% | 0.4% | | 0.3% |
| 2017-06-26 | 01:00 PM | Apr | | 5.9% | | |
| 2017-06-26 | 01:00 PM | Apr | | 1% | | |
| 2017-07-27 | 01:00 PM | May | | | | |
|


