Daily Archives: September 4, 2015

Condo prices struggling | Katonah Real Estate

Appreciating home values in the bottom third of the market helped pull more homeowners out of negative equity in the second quarter of 2015, but condos were more likely than houses to be underwater , according to the Zillow® Negative Equity Report.

•             The U.S. rate of negative equity among mortgaged homeowners continued to drop in the second quarter of 2015, to 14.4 percent– the first time the rate has been below 15 percent since the real estate bubble burst.

•             The improvement was spurred by value growth in the least valuable third of the housing stock, which are far more likely to be underwater than other homes.

•             Condos are more likely to be underwater than single-family homes. Nearly 20 percent of all condos with a mortgage are upside down.

Condo-owners were in far worse shape than single-family homeowners in Chicago, Orlando and Las Vegas. And in only three markets – Detroit, Memphis, and Pittsburgh –single-family homeowners were more likely to be underwater than condo-owners.

A high rate of homeowners who owe more on their mortgages than their homes are worth is a lingering effect of the real estate crisis. At its worst, more than 15 million homeowners were upside down on their homes. Foreclosures, short sales and rapidly rising home values freed nearly half of those homeowners, leaving 7.4 million homeowners upside down at the end of Q2 2015.

The continued decline of the overall negative equity rate was fueled in the first half of the year by strong appreciation for the least valuable third of homes. The least valuable homes are much more likely to be underwater than more valuable homes

In the Atlanta market, for example, nearly 43 percent of the least valuable homes are in negative equity, while only 9.4 percent of high-end homes are underwater. Annual home value appreciation among the least valuable homes in Atlanta had slowed for 12 straight months through June 2015 months. However, low-end homes have been appreciating annually more than more valuable homes.  Since June 2014, annual appreciation in the bottom tier outpaced home value appreciation among all Atlanta homes, likely helping drive negative equity down there from 29 percent to 21 percent year-over-year.

Similar trends played out in Sacramento, Riverside, and Phoenix, all places that have struggled with high rates of negative equity.


read more…


http://www.realestateeconomywatch.com/2015/09/


20% of Borrowers have 800+ FICO scores | Bedford Hills Real Estate

More consumers are scoring 800 or above on their FICO credit scores—19.9 percent today vs. 19.6 percent just six months earlier. Nearly one in five has joined the elite FICO 800 club!

At the same time, fewer are scoring below 550. In fact, there’s been a clear pattern of decline in this segment since the low point of the economy in late 2009/early 2010, reports Fair Isaac Corporation.

Some of this trend may be a result of the lowest-scoring consumers “dropping out” from traditional credit usage, and by extension no longer having valid FICO Scores. Still, this decline is encouraging. It indicates that overall more consumers using credit are managing it responsibly enough to not be among the lowest scorers.


FICO1

In addition, the national average FICO score is currently at an all-time high since Fair Isaac has been tracking this metric, dating back to pre-recessionary 2005. That said, the improvement in this average seems to be slowing, stabilizing around 695 after a steady climb between October 2013 and October 2014.


FICO2


FICO Scores Raise or Lower Rates by 240 Basis Points

FICO scores are one of the three most important metrics lenders use to evaluate a prospective borrower and they also determine rates.  Fair Isaac’s calculator shows that rates between the highest and lowest acceptable FICO scores can vary more than 2.4 percent.


FICO Calculator


read more…


http://www.realestateeconomywatch.com/2015/08/

Where are the sellers? | Bedford Real Estate

Not so long ago, when prices were plummeting and foreclosures pumped up the inventory counts with discounted values, homeowners and real estate professionals would have welcomed one of the chronic problems plaguing markets today; inventories so low that they inflate prices and keep move up buyers in homes they want to leave.

The question everyone is asking: “What’s happened to supply and demand dynamics? Demand is stronger, so where’s the supply/”

Recently the California Association of Realtors released a study that answered that question what another one.  About 35 percent of homeowners surveyed by the CAR said they have considered selling their home in the past year. But among that group, 64 percent said they decided against it because they couldn’t afford the home they’d like to buy as a replacement. So move up sellers are caught in the same circular trap as first-time buyers.  Where are the affordable listings that will halt this merry-go-round?

In 2013, when tight inventories switched from being a national blessing to a curse, Zillow’s Stan Humphries provided an explanation at the National Association of Real Editors’ annual meeting and the scales fell from my eyes.  He outlined how deficient equitied owners were frozen in place—not just those under water but also those lacking the 20 percent positive equity necessary to sell.  When you added up the under watered and the under equitied, it was a huge chunk of all homeowners with a mortgage at that time.

Less than 20 percent of homes today are under-equitied or under water

Price appreciation has whittled down that number over the past two years. RealtyTrac recently reported that only about 13.3 percent of all properties with a mortgage have less than 25 percent positive equity. CoreLogic puts the percentage of underwater and homes with less than 20 percent equity at 19.4 percent of all homes with a mortgage.  Zillow puts the negative equity rate at less than 15 percent through the second quarter.

Still a big factor, the equity barrier hurts some markets more than others.  It is worse in those markets that suffered most in the housing crash—the ‘sand’ states of California, Arizona, Nevada and Florida. It is also higher among entry level and mid-level price tiers than the top levels.


read more…


http://www.realestateeconomywatch.com/2015/09/

Underwater homes continue to surface | Pound Ridge Real Estate

The U.S. rate of underwater homeowners – those who owe more on their home than it’s worth – continued to drop in the first half of 2015. But condo owners are still more likely to be stuck in negative equity than people who own single-family homes.

Homes in the low end of the housing market are more likely to be underwater. Fortunately, while homes across the U.S. are appreciating, homes at the low end are appreciating faster. This is causing the negative equity rate to decline.

In the U.S., 14.4 percent of all mortgaged single-family homes are underwater, according to Zillow’s Second Quarter Negative Equity report. Condos are lagging behind in the recovery, at 19.3 percent.

Overall, more condos than homes are upside down in every large U.S. housing market except Pittsburgh, Detroit and Memphis.

Here are the top 10 markets where condos are deeper underwater than single-family homes:

  1. Jacksonville, FL. The negative equity rate for single-family homes in Jacksonville is at 21.3 percent, more than half the 41.5 percent rate for condos.
  2. Chicago, IL. 32.6 percent of condo owners in Chicago are upside down on their mortgage, and 19.2 percent of single-family home owners are upside down on theirs.
  3. Orlando, FL. Orlando comes in third with 16.8 percent of single-family homes in negative equity and 29.9 percent of condos are in the same boat.
  4. Sacramento, CA. 12.5 percent of single-family homeowners in Sacramento owe more on their home than it’s worth, compared to the 25.4 percent of condo owners.
  5. Las Vegas, NV. The negative equity rate for condo owners in Las Vegas is 36.7 percent. The rate is 23.8 percent for single-family homeowners.
  6. Providence, RI. 25.9 percent of condo owners in Providence are upside down on their mortgage. The rate drops to 14.4 percent when it comes to single-family homes.
  7. Columbus, OH. Single-family homes in Columbus have a 13.1 percent negative equity rate, compared to a rate of 24.6 percent in condos.

read more…


http://www.zillow.com/blog/negative-equity-improving-182981/?utm_source=feedburner&utm_medium=email&utm_campaign=Feed%3A+ZillowBlog+%28Zillow+Blog%29

Jobs, Rates and Housing | Bedford Corners Real Estate

The Labor Department posts an employment report every month, and people look at it as a ladder rung up or down on the “wall of worry” over where the fragile economic and housing’s recovery is headed.

Bottom line, as these things go, fear is bad and greed is good.

Today’s has more freight than usual. Among the people who “look at it as a ladder rung up or down” are the U.S. Federal Reserve governors, who, it’s known, have an agenda item for their Sept. 16-17 meeting that may tie directly to today’s report.

The economy added 173,000 jobs to payrolls in the month of August. This fell short of the level Wall Street’s “consensus” of economists expected. The higher range of the consensus may have worked as a harbinger of a Fed belief that it’s time to lift borrowing costs. Having come in at the “under” level of the over-under range, may equally be a signal to the Fed that raising rates would put a damper on an economy still trying to find solid footing in an uncertain international economic context.

Here’s the Labor Department top line, focusing on payroll additions and the unemployment rate, which fell.

Total nonfarm payroll employment increased by 173,000 in August, and the unemployment rate edged down to 5.1 percent, the U.S. Bureau of Labor Statistics reported today. Job gains occurred in health care and social assistance and in financial activities. Manufacturing and mining lost jobs…..In August, the unemployment rate edged down to 5.1 percent, and the number of unemployed persons edged down to 8.0 million.

What this means in reality is the subject of a lot of speculation. “Five things to watch” and “previews” foretell a queasy reaction among Wall Street traders. They are America’s metaphor for impulsive, over-reaction, often to mixed indicators. But with a slow-down playing out in China’s economy and an iffy scenario shaping up in the eurozone, a Labor Department jobs report takes on “lightning rod” status for people whose jobs are to bet on the direction as well as the trajectory of corporate profit capability.

What it means to home builders, one can only shrug and guess that there’ll be an immediate impulsive interpretation, a medium-term effect, and an ultimate impact, none of the three of which may have to do with one another. Likely, for large companies in the home building and development ecosystem, including investors, materials suppliers, and manufacturers, upward pressure on borrowing costs may precipitate the next slew in what many consider to be an inevitable series of consolidation moves. As local as real estate is, the industry serving it on the horizontal and vertical development and construction side of the equation is becoming a smaller, more finite world of fewer bigger players.

All of this is tangential to those who spend two of every three dollars in the United States’ $18 trillion economy, American consumers. New Strategist Press editorial director Cheryl Russell notes that an important shift in that spending came to light with the release of Consumer Expenditure Survey data for 2014.


read more…


http://www.builderonline.com/builder-100/strategy/jobs-rates-and-housing_o?utm_source=newsletter&utm_content=Article&utm_medium=email&utm_campaign=BP_090415%20(1)&he=bd1fdc24fd8e2adb3989dffba484790dcdb46483

It Takes 22 Subcontractors to Build the Average Home | Chappaqua Real Estate

A previous post discussed how the current shortage of subcontractors in residential construction is becoming more acute.  This is significant, because subcontractors are very important to the construction of the typical home.  Periodically, NAHB has found it worthwhile to remind the public just how important.

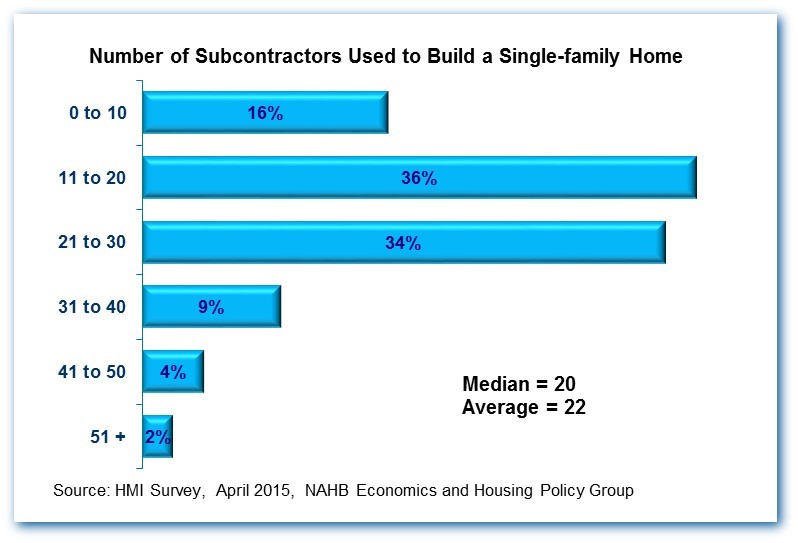
NAHB addressed the topic most recently in the September 2015 Special Study in Housing Economics.  The study clearly shows that builders’ use of subcontractors remains as strong as ever.   For example, 70 percent of builders typically use somewhere between 11 and 30 subcontractors to build a single-family home.  On average, 22 different subcontractors are used to build a home.

Subs UsedData for the study came from a set of special questions added to the April 2015 survey for the NAHB/Wells Fargo Housing Market Index.

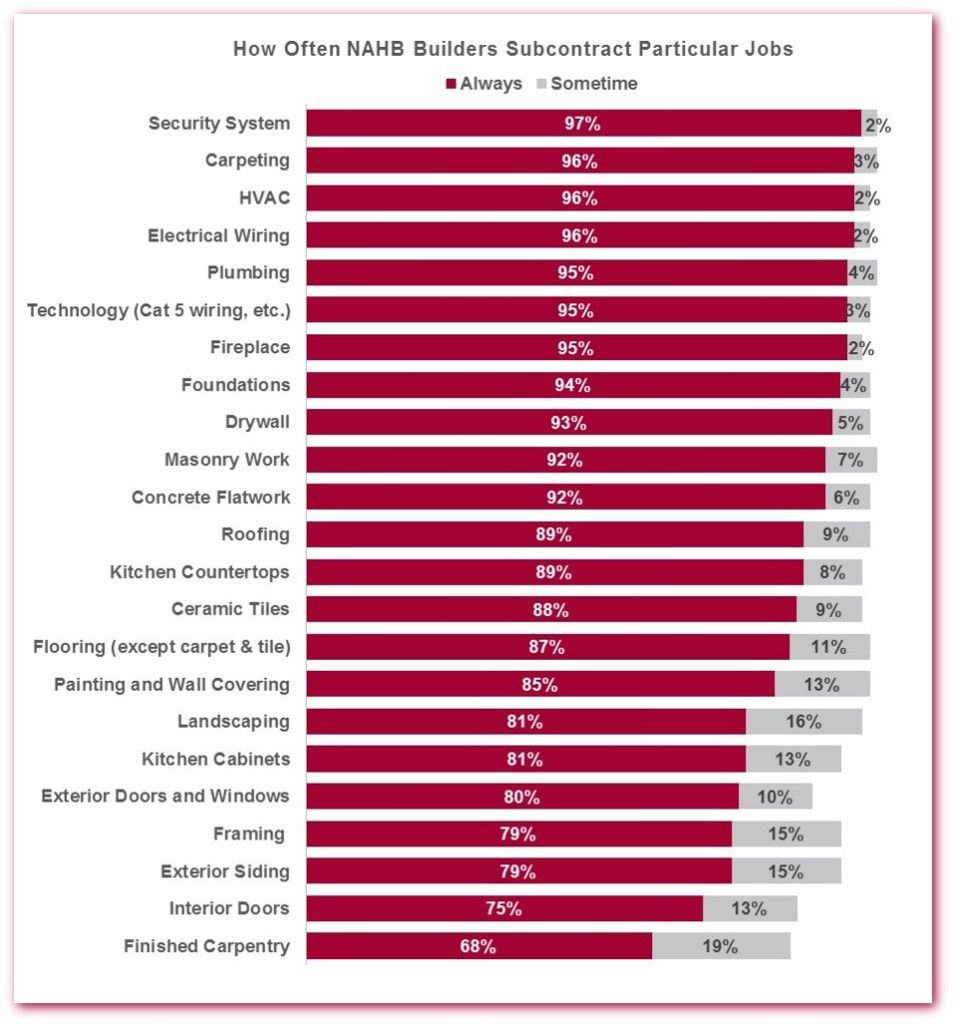
The questions covered how often builders subcontract 23 specific jobs.  In every case, the job was always subcontracted by at least two-thirds of the builders.  At the low end of the scale, “only” 68 percent of builders said they always subcontract finished carpentry.  At the other extreme, subcontracting is nearly ubiquitous for some jobs.  Over 90 percent of builders said they always subcontracted concrete flatwork, masonry contractor specialists, drywall, foundations fireplaces, technology, plumbing, electrical wiring, HVAC, carpeting and security systems.

Particular JobsEven when builders don’t always subcontract these jobs all they time, it’s common to subcontract them out at least part of the time.

About two-thirds of the builders in the survey reported subcontracting out 75 percent of the construction cost in the average single-family home they build.  The average share of construction costs subcontracted was 77 percent.

read more….

It Takes 22 Subcontractors to Build the Average Home