Monthly Archives: August 2015
Americans still reluctant to ramp up mortgage borrowing | Mt Kisco Real Estate
Americans are buying more homes and at higher prices, yet new data shows that mortgage debt is little changed.
The Federal Reserve Bank of New York said Thursday that outstanding U.S. mortgage debt slipped 0.7 percent in the April-June quarter to $8.12 trillion. That is up slightly from a year ago and about the same level as three years ago when the housing market bottomed.
The second quarter’s decline occurred even as Americans took out more new mortgages, either to refinance old loans or purchase homes. New mortgages totaled $466 billion in the second quarter, the most in almost two years.
Those trends suggest Americans are paying down mortgage debt at roughly the same pace as new loans are made, evidence that homeowners remain wary of housing-related debt. Total mortgage debt peaked at $9.29 trillion in the third quarter of 2008.
Overall, the New York Fed’s report indicates that there is little sign of a return to bubble-era excesses in mortgage financing, even as the housing market rebounds. Would-be buyers are bidding up prices on a scarce supply of available homes. Sales of existing houses climbed to an eight-year high in June.
And home prices rose nearly 5 percent in May from a year earlier, according to the S&P/Case-Shiller 20-city index. They jumped 10 percent in Denver, 9.7 percent in San Francisco and 8.4 percent in Dallas — big increases that are making homeownership increasingly unaffordable for the typical family.
Yet there are many signs in the New York Fed’s report that housing finance is much healthier than before the recession. Just 95,000 people received new foreclosure notices in the second quarter, the fewest in the 16-year history of the data. And total
And in another sign of caution, total borrowing on home-equity lines of credit fell $11 billion in the second quarter, to $499 billion. That’s far below the peak of $714 billion six years ago.
The amount of new mortgages has risen for four straight quarters, the New York Fed said, after falling to a 14-year low of $286 billion in last year’s second quarter.
Several trends have offset those increases to keep overall mortgage debt mostly unchanged, according to economists at the New York Fed. A wave of refinancing has lowered borrowing rates, allowing homeowners to pay down more principal each month and less interest. Many homebuyers are making larger down payments. And the proportion of investors and other buyers paying cash has been elevated for most of the economic recovery.
read more…
http://finance.yahoo.com/news/us-mortgage-debt-little-changed-150050678.html
Why housing isn’t back in a bubble | Waccabuc Real Estate
This is the third of three articles about the U.S. housing market. Ex-housing, the U.S. is in deflation currently at -1% YoY. So the only current “inflation risk” that might justify the Fed raising rates is the appreciation in house prices. In my previous two posts, I explained that both housing and apartment demand are supported by increased demographic demand, as the Millennial generation creates about the same affect on single and multi-unit housing as their Boomer parents and grandparents did 50 years ago. Further, there has been a marked increase in foreign buying of homes, skewed towards the upper end and disproportionately all-cash purchases. As a big part of this increase has come from Chinese nationals, the current problems hitting that county may ease demand, and therefore ease upward pressure, on U.S. house prices.
But some have argued that housing has entered a 2nd bubble. Some of this comes from the usual Doomer chorus Seriously, one guy actually claimed a couple of weeks ago that there was a bubble in rents! It must be the Underpants Gnomes theory of bubbles:
1. rent lots of vacant units
2. ???
3. Profit!
What’s the missing step 2? Sublet everything, because everyone knows that rents only go up?!?
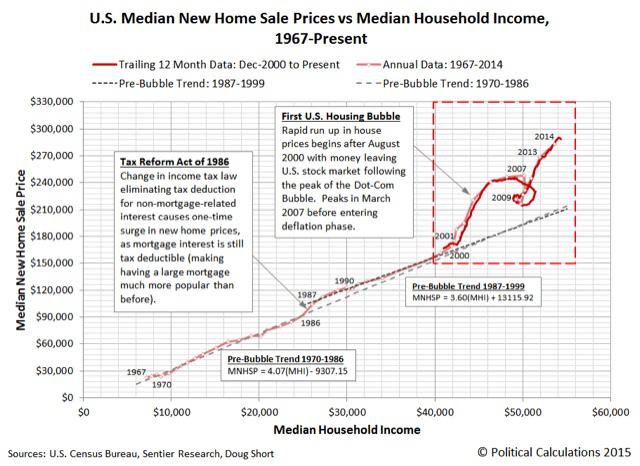
But some is more serious analysis. The website Political Calculations, for example, believes there is a bubble based on the movement in prices vs. median household income. Here’s their relevant graph:

The point of view does have merit, since after all it is households buying houses! But I believe that misses the bigger picture.
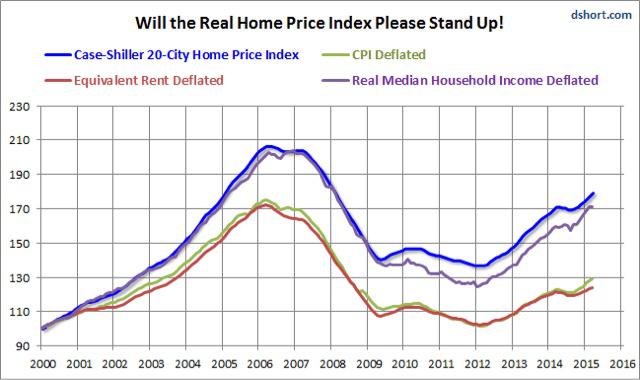
To begin with, the big problem in assessing house prices is that, since housing is itself nearly 40% of the CPI, by what should house prices be deflated, for a “real” measure? Here is a graph created by Doug Short, the Case Shiller house index by median household income, by the entire CPI, and by owner’s equivalent rent:

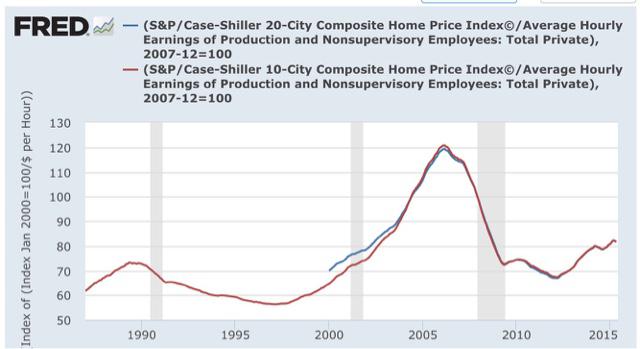
Nominal house prices, and prices deflated by median household income, appear to show housing in a new bubble. But deflated by CPI and by owner’s equivalent rent, prices haven’t moved much off their bottom. Nor has there been much movement when house prices are deflated by average hourly wages:

To sort out how extreme (or not) house prices are, let’s consider three types of purchasers:
1. the entry level purchaser, likely young, likely buying a townhouse, condo, or small single family home perhaps in an inner ring suburb.
2. the move-up purchaser, trading in a smaller house for a bigger one.
3. the retirement purchaser, either downsizing or building the retirement home of their dreams.
Income is likely the main measure for the 1st purchaser. They probably don’t have a lot of savings with which to make a big downpayment, and may be getting help from family members. The most important thing for them is whether they will be able to make the monthly mortgage payment and other bills.
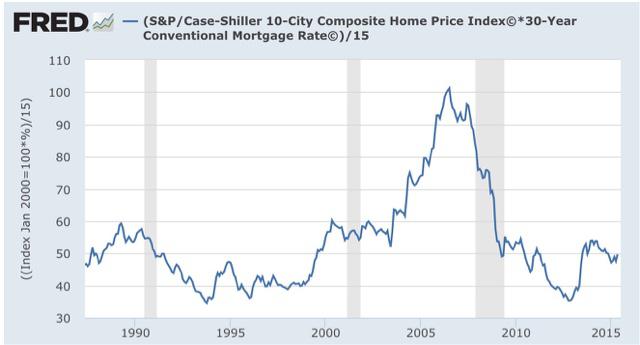
While household income constrains that ability, mortgage rates also loom large. And here is what happens when we calculate the monthly mortgage payment of a house, as measured by the Case Shiller Index, and then adjusted for mortgage rates:

Courtesy of lower mortgage rates, even though median household income has actually declined for all ages 25-64 since 2007, the typical monthly mortgage payment now is only about 50% of what it was at the peak of the housing bubble, even when we take median household income into account.
read more…
http://seekingalpha.com/article/3434566-why-there-is-no-second-housing-bubble?ifp=0
Mortgage Rates average 3.94% | Cross River Realtor
Freddie Mac (OTCQB: FMCC) today released the results of its Primary Mortgage Market Survey® (PMMS®), showing average fixed mortgage rates reversing course and nudging higher for the first time in four weeks.
News Facts
- 30-year fixed-rate mortgage (FRM) averaged 3.94 percent with an average 0.6 point for the week ending August 13, 2015, up from last week when it averaged 3.91 percent. A year ago at this time, the 30-year FRM averaged 4.12 percent.
- 15-year FRM this week averaged 3.17 percent with an average 0.6 point, up from last week when it averaged 3.13 percent. A year ago at this time, the 15-year FRM averaged 3.24 percent.
- 5-year Treasury-indexed hybrid adjustable-rate mortgage (ARM) averaged 2.93 percent this week with an average 0.5 point, down from last week when it averaged 2.95 percent. A year ago, the 5-year ARM averaged 2.97 percent.
- 1-year Treasury-indexed ARM averaged 2.62 percent this week with an average 0.3 point, up from last week when it averaged 2.54 percent. At this time last year, the 1-year ARM averaged 2.36 percent.
Average commitment rates should be reported along with average fees and points to reflect the total upfront cost of obtaining the mortgage. Visit the following links for theRegional and National Mortgage Rate Details and Definitions. Borrowers may still pay closing costs which are not included in the survey.
Quote
Attributed to Sean Becketti, chief economist, Freddie Mac.
“The jobs report for July showed that the economy added 215,000 jobs, in line with expectations. Wage growth remains modest at 2.1 percent compared to the same time last year, and another solid if not stellar employment report leaves a potential Fed rate hike on the table for September. However, this year’s theme of overseas economic turbulence continues with the focus shifting east to China. Over the past few days the Chinese Yuan has fallen sharply. In the midst of these mixed data mortgage rates inched up, increasing 3 basis points to 3.94 percent. Headed into the fall, we’ll likely see continued interest rate tension, with dollar appreciation weighing against possible Fed rate hikes leaving the rate outlook clouded.”
Foreclosure Rates, Inventory Continue to Drop: CoreLogic | South Salem Real Estate
Foreclosure inventory and completed foreclosures declined drastically during June, real estate analytics firm CoreLogic found in its monthly survey.
Foreclosure inventory declined 28.9% on a year-over-year basis in June to 472,000 homes. Completed foreclosures also declined year-over-year, down 14.8% to 43,000. Likewise, the number of homes in “serious delinquency,” which the firm defined as 90 days or more past due on mortgage payments, declined 23.3%.
“The foreclosure rate for the U.S. has dropped to its lowest level since 2007, supported by a continuing decline in loans made before 2009, gains in employment and higher housing prices,” said CoreLogic chief economist Frank Nothaft in a release.
“The decline has not been uniform geographically, as the foreclosure rate varies across metropolitan areas,” he said, adding that Tampa, Fla., and Nassau and Suffolk counties in New York have seen increased foreclosure rates.
“Serious delinquency is at the lowest level in seven and a half years reflecting the benefits of slow but steady improvements in the economy and rising home prices,” said CoreLogic president and chief executive Anand Nallathambi in the release. “We are also seeing the positive impact of more stringent underwriting criteria for loans originated since 2009 which has helped to lower the national seriously delinquent rate.”
read more…
http://www.nationalmortgagenews.com/news/distressed/foreclosure-rates-inventory-continue-to-drop-corelogic-1058484-1.html
Las Vegas housing prices dip | Katonah Real Estate
Las Vegas housing resale prices dipped in July but remained higher than they were a year ago, while sales volume continued to climb, according to a new report.
The median sales price of single-family homes sold in Southern Nevada last month was $218,000, down 0.9 percent from June but up 9 percent from July 2014, according to the Greater Las Vegas Association of Realtors.
Buyers picked up 3,180 single-family homes last month, up 4 percent from June and 20.4 percent from July 2014.
The number of ignored listings, however, also rose. There were 7,636 single-family homes on the market without offers by the end of July, up 2.7 percent from June and 5 percent from a year ago, the GLVAR reported.
The trade association reports data from its listing service, which largely comprises previously owned homes.
In the report, GLVAR President Keith Lynam said he likes to compare the housing market to a marriage: “It’s a good thing when it’s stable.”
“For the most part, that’s what we’ve seen so far this year,” he said.
Prices are rising at a much slower pace than in recent years. After the economy tanked, investors gobbled up cheap homes to turn into rentals and pushed up housing values at one of the fastest rates nationally, raising fears of another bubble. However, the housing marketcooled considerably last year as investors, faced with higher prices, backed out.
read more…
http://vegasinc.com/business/2015/aug/10/Las-Vegas-housing-prices-dip-July/
Baltimore housing prices stagnate | Bedford Hills Realtor
The four-bedroom, 2.5-bath home on Cromwell Bridge Road in Towson listed in June for $324,900. And lingered.
June Piper-Brandon, a real estate agent with Century 21 New Millennium, and the seller, David Walcher, recently reduced the price by about $25,000. Even so, no one showed up at an open house this weekend.
“We keep dropping the price and hoping,” Piper-Brandon said.
The good news and the bad news in Baltimore’s real estate market is the same for both buyers and sellers: Prices aren’t going up.
Nationwide home prices recovered to pre-housing-crash levels in June, rising 6.5 percent year-over-year after months of steady gains, according to the most recent existing home sales data from the National Association of Realtors.
But the median cost of a home in the Baltimore metro area increased just 1.5 percent last month from July 2014, to $259,900, according to a report released Monday by RealEstate Business Intelligence. And so far this year, the median price has fallen about 1.6 percent and remains about 10 percent off the 2007 peak.
The affordability may be fueling demand. More homes sold in Baltimore City and the five surrounding counties last month than in any July since 2005, continuing an eight-month streak of year-over-year, double-digit gains. The 3,623 deals were 23 percent more than a year ago. The number of pending deals also rose nearly 16 percent.
But the disconnect between local and national prices coupled with the increased demand may be causing pricing confusion in the Baltimore market.
“I don’t know too many markets in the country that look like Baltimore,” said John Heithaus, the self-identified “chief evangelist” for RealEstate Business Intelligence, the affiliate of the region’s multiple listing service that produces the monthly housing analysis. “Clearly, yes, for the entire [mid-Atlantic] region, [prices in] the Baltimore metro is certainly lagging, but what we want to see is increases in sales.”
Piper-Brandon said some homeowners have gotten encouraged to sell as more emerge from being underwater. But many prospective buyers are still backing away and opting to rent.
“We’re certainly seeing people going back to work, but they’re not making as much money as they used to make,” she said.
After dropping the price on his home, Walcher, 48, said his family is in no rush — they just found a bigger home with a pool they liked more. They bought the property from a bank after a foreclosure, so there’s some wiggle room.
“I think this may be an opportunity for somebody to take advantage of the situation we’re in and get a good deal that might not be available at other times,” said Walcher, an insurance agent. “If it doesn’t sell, OK, I had planned to live here for 20 years anyway.”
Danielle Hale, the National Association of Realtors director of housing statistics, said price increases nationally reflect pressure created by relatively low inventories and rising demand. However, she said, demand remains lower than expected, given population growth, which some observers chalk up to slowly rising incomes, more renters and fewer people creating new households, among other factors.
Those dynamics are part of the story in Maryland, where job creation and income growth have lagged behind the rest of the country in recent months. The region’s stagnant prices also reflect a continued churn of distressed properties, which drag down prices while feeding supply.
Foreclosures and short sales — with a median price of $118,000 — increased 43.5 percent year-over-year in July, to 673, or 18.5 percent of all transactions.
Many of the distressed properties date to delinquencies that started in the recession, and are just now appearing as the market adjusts to regulatory changes. While the situation is improving, Maryland continues to have one of the three worst delinquent markets in the country, according to a recent RealtyTrac report.
“It’s that lingering overhang,” said Frank Nothaft, a Washington-based senior vice president and chief economist for CoreLogic. “The serious delinquency rate has come down a great deal in the Baltimore market. … It’s still really high.”
The delinquent market continues to weigh especially on Baltimore City, where the median sales price was $135,000, the same as in July 2014. Of the 700 home sales in the city, about 200 — more than 28 percent — were short sales or foreclosures, similar to last year’s share, according to RBI.
But the city in July also saw a 17.1 percent increase in closed sales and 11.4 percent increase in pending sales.
“The city seems to have weathered the potential storm of the civil unrest,” said T. Ross Mackesey, president of the Greater Baltimore Board of Realtors. “We still have a huge distressed-property problem.”
John Kaburopulos, an agent with Keller Williams Flagship of Maryland, listed a recently rehabbed two-bedroom rowhouse on Lehigh Street in Greektown for $165,000 at the end of May, but recently dropped the price to $150,000 to try to attract more interest.
read more….
http://www.baltimoresun.com/business/real-estate/bs-bz-july-home-sales-20150810-story.html
Farm real estate values decrease slightly | Pound Ridge Real Estate
The U.S. Department of Agriculture recently announced Nebraska’s 2015 farm real estate value and cash rent for cropland has decreased by 2 percent.
Allan Vyhnalek, educator at the Platte County Extension Office, said based on the changing prices of corn and soybeans, the decline in real estate value is “absolutely expected.”
In February 2015, the University of Nebraska-Lincoln published a report on farm real estate that gave specific numbers for regions within the state.
The east region, which includes Platte and Colfax counties, saw an overall decrease of 3 percent. Dryland cropland decreased by 9 percent and other types of cropland (pivoted, gravity irrigated, etc) decreased by 3 percent. However, the values of grazing land increased, tillable by 16 percent, non-tillable by 20 percent and hayland by 24 percent.
Due to the 2005 ethanol mandate, Vyhnalek said crop prices jumped to $5 to $7 a bushel for corn and $11 to $15 a bushel for soybeans. When grain prices rose, so did the cost of production and real estate. According to the 2015 UNL real estate report, over the past five years the east region’s real estate values increased by 89 percent.
Statewide, values increased by 116 percent.
Prices for corn are now around $3.41 a bushel with soybeans at $8.85 a bushel, lower than previous years.
Thomas Dobbe, regional vice president of Farm Credit Services of America, said the increased cost of equipment, fertilizer, seeds, etc., could have “acted as a damper” on the real estate market, but it’s too early to tell if this decrease is a fluke or the start of a trend.
“It may be an indication that the market will not go any higher,” Dobbe said, “or a sign that the market is taking a breather. We won’t know if it’s done going up or if it will continue to go up.”
Dobbe and Vyhnalek said the value of an individual plot of land depends more on the quality of its soil and topography than overall trends. Property taxes will continue to increase, and the value decrease is unlikely to affect rental prices.
read more,,,
http://columbustelegram.com/news/local/farm-real-estate-values-decrease-slightly/article_5aa2a5fb-19a8-5bf5-a12e-7f9662df4625.html
South Florida home flippers still on the hunt as prices rise | Bedford Corners Realtor
Even as local real-estate prices soar, home flipping is still a big business in South Florida.
While it’s getting harder to find a good deal, flippers say they’re riding the wave of rising home values to steady profits— and they don’t expect a crash that will leave them underwater.
Nearly 1,400 single-family homes were flipped in Miami-Dade, Broward and Palm Beach counties during the second quarter of 2015, according to a report from RealtyTrac released Thursday.
That’s about 10 percent of overall home sales, the highest rate among major metro areas in the U.S. Around the nation, only 4.5 percent of sales were flips. RealtyTrac defines a flipped home as one that sells twice in a single year.
“South Florida is a hot spot,” said Daren Blomquist, vice president at RealtyTrac.
Blomquist said that the region’s high rate of foreclosuresand strong record of price growth make flipping a good bet in South Florida.
Even so, local home flipping is slowing somewhat, with the number of flips down about six percent year-over-year. “The prices are starting to hit a level that is out of the sweet spot for a lot of flippers,” Blomquist said. “We’re seeing the number of flips come down and that to me is a sign that we’re in a sustainable housing economy and not a bubble.”
Flips accounted for nearly 14 percent of all sales in South Florida during the headiest days of the bubble, RealtyTrac found.
Although flipping is down slightly, the profits are still there. The average flipped home in South Florida cost $220,000 to buy but sold for $302,000 about six months later, RealtyTrac found. That’s a healthy gain even after repairs and closing costs are taken out
Home prices rose in 93% of metro areas during the second quarter | Bedford Real Estate
The median existing single-family home price rose in 93% of 176 metropolitan areas during the second quarter, the National Association of Realtors reported Tuesday. That’s up from 85% of metro areas in the first quarter. The price rose 8.2% compared to the second-quarter of 2014 to $229,400. The five most expensive housing markets in the second quarter were the San Jose, Calif., metro area, where the median existing single-family price was $980,000; San Francisco, $841,600; Anaheim-Santa Ana, Calif., $685,700; Honolulu, $698,600; and San Diego, $547,800. The five lowest-cost metro areas in the second quarter were Cumberland, Md., where the median single-family home price was $82,400; Youngstown-Warren-Boardman, Ohio, $85,000; Rockford, Ill., $94,700; Decatur, Ill., $96,000; and Elmira, N.Y., $98,300.
read more…
http://www.marketwatch.com/story/us-home-prices-rose-in-93-of-metro-areas-during-the-second-quarter-2015-08-11
