Daily Archives: August 13, 2015

Americans still reluctant to ramp up mortgage borrowing | Mt Kisco Real Estate

Americans are buying more homes and at higher prices, yet new data shows that mortgage debt is little changed.

The Federal Reserve Bank of New York said Thursday that outstanding U.S. mortgage debt slipped 0.7 percent in the April-June quarter to $8.12 trillion. That is up slightly from a year ago and about the same level as three years ago when the housing market bottomed.

The second quarter’s decline occurred even as Americans took out more new mortgages, either to refinance old loans or purchase homes. New mortgages totaled $466 billion in the second quarter, the most in almost two years.

Those trends suggest Americans are paying down mortgage debt at roughly the same pace as new loans are made, evidence that homeowners remain wary of housing-related debt. Total mortgage debt peaked at $9.29 trillion in the third quarter of 2008.

Overall, the New York Fed’s report indicates that there is little sign of a return to bubble-era excesses in mortgage financing, even as the housing market rebounds. Would-be buyers are bidding up prices on a scarce supply of available homes. Sales of existing houses climbed to an eight-year high in June.

And home prices rose nearly 5 percent in May from a year earlier, according to the S&P/Case-Shiller 20-city index. They jumped 10 percent in Denver, 9.7 percent in San Francisco and 8.4 percent in Dallas — big increases that are making homeownership increasingly unaffordable for the typical family.

Yet there are many signs in the New York Fed’s report that housing finance is much healthier than before the recession. Just 95,000 people received new foreclosure notices in the second quarter, the fewest in the 16-year history of the data. And total

And in another sign of caution, total borrowing on home-equity lines of credit fell $11 billion in the second quarter, to $499 billion. That’s far below the peak of $714 billion six years ago.

The amount of new mortgages has risen for four straight quarters, the New York Fed said, after falling to a 14-year low of $286 billion in last year’s second quarter.

Several trends have offset those increases to keep overall mortgage debt mostly unchanged, according to economists at the New York Fed. A wave of refinancing has lowered borrowing rates, allowing homeowners to pay down more principal each month and less interest. Many homebuyers are making larger down payments. And the proportion of investors and other buyers paying cash has been elevated for most of the economic recovery.


read more…


http://finance.yahoo.com/news/us-mortgage-debt-little-changed-150050678.html

Why housing isn’t back in a bubble | Waccabuc Real Estate

This is the third of three articles about the U.S. housing market. Ex-housing, the U.S. is in deflation currently at -1% YoY. So the only current “inflation risk” that might justify the Fed raising rates is the appreciation in house prices. In my previous two posts, I explained that both housing and apartment demand are supported by increased demographic demand, as the Millennial generation creates about the same affect on single and multi-unit housing as their Boomer parents and grandparents did 50 years ago. Further, there has been a marked increase in foreign buying of homes, skewed towards the upper end and disproportionately all-cash purchases. As a big part of this increase has come from Chinese nationals, the current problems hitting that county may ease demand, and therefore ease upward pressure, on U.S. house prices.

But some have argued that housing has entered a 2nd bubble. Some of this comes from the usual Doomer chorus Seriously, one guy actually claimed a couple of weeks ago that there was a bubble in rents! It must be the Underpants Gnomes theory of bubbles:
1. rent lots of vacant units
2. ???
3. Profit!

What’s the missing step 2? Sublet everything, because everyone knows that rents only go up?!?

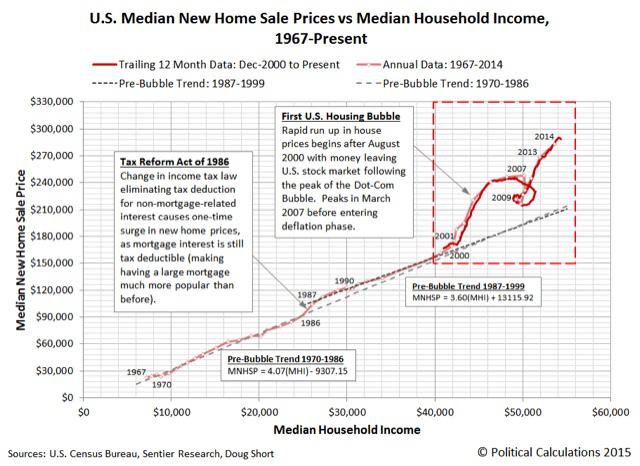
But some is more serious analysis. The website Political Calculations, for example, believes there is a bubble based on the movement in prices vs. median household income. Here’s their relevant graph:

The point of view does have merit, since after all it is households buying houses! But I believe that misses the bigger picture.

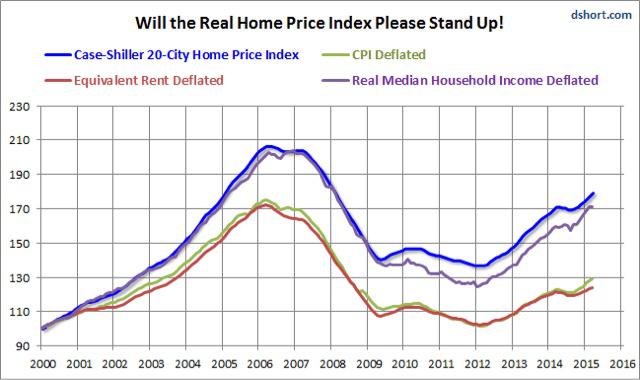
To begin with, the big problem in assessing house prices is that, since housing is itself nearly 40% of the CPI, by what should house prices be deflated, for a “real” measure? Here is a graph created by Doug Short, the Case Shiller house index by median household income, by the entire CPI, and by owner’s equivalent rent:

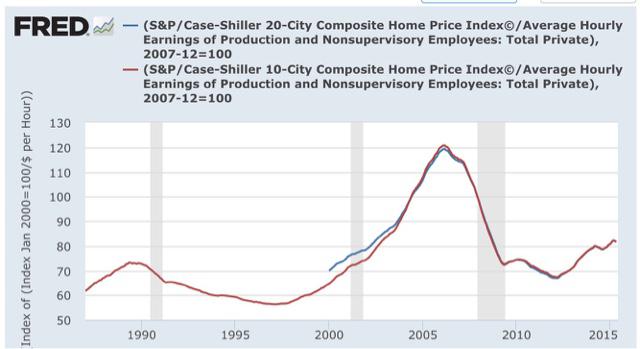
Nominal house prices, and prices deflated by median household income, appear to show housing in a new bubble. But deflated by CPI and by owner’s equivalent rent, prices haven’t moved much off their bottom. Nor has there been much movement when house prices are deflated by average hourly wages:

To sort out how extreme (or not) house prices are, let’s consider three types of purchasers:
1. the entry level purchaser, likely young, likely buying a townhouse, condo, or small single family home perhaps in an inner ring suburb.
2. the move-up purchaser, trading in a smaller house for a bigger one.
3. the retirement purchaser, either downsizing or building the retirement home of their dreams.

Income is likely the main measure for the 1st purchaser. They probably don’t have a lot of savings with which to make a big downpayment, and may be getting help from family members. The most important thing for them is whether they will be able to make the monthly mortgage payment and other bills.

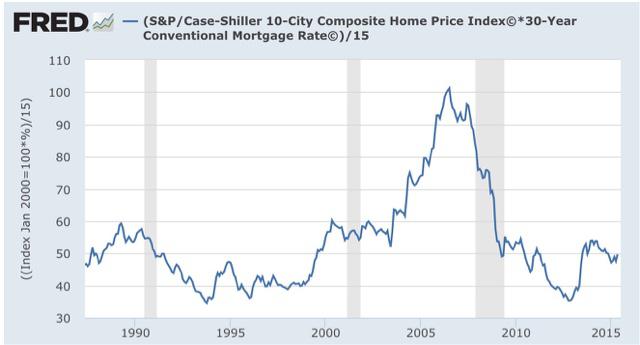
While household income constrains that ability, mortgage rates also loom large. And here is what happens when we calculate the monthly mortgage payment of a house, as measured by the Case Shiller Index, and then adjusted for mortgage rates:

Courtesy of lower mortgage rates, even though median household income has actually declined for all ages 25-64 since 2007, the typical monthly mortgage payment now is only about 50% of what it was at the peak of the housing bubble, even when we take median household income into account.


read more…


http://seekingalpha.com/article/3434566-why-there-is-no-second-housing-bubble?ifp=0

Mortgage Rates average 3.94% | Cross River Realtor

Freddie Mac (OTCQB: FMCC) today released the results of its Primary Mortgage Market Survey® (PMMS®), showing average fixed mortgage rates reversing course and nudging higher for the first time in four weeks.

News Facts

  • 30-year fixed-rate mortgage (FRM) averaged 3.94 percent with an average 0.6 point for the week ending August 13, 2015, up from last week when it averaged 3.91 percent. A year ago at this time, the 30-year FRM averaged 4.12 percent.
  • 15-year FRM this week averaged 3.17 percent with an average 0.6 point, up from last week when it averaged 3.13 percent. A year ago at this time, the 15-year FRM averaged 3.24 percent.
  • 5-year Treasury-indexed hybrid adjustable-rate mortgage (ARM) averaged 2.93 percent this week with an average 0.5 point, down from last week when it averaged 2.95 percent. A year ago, the 5-year ARM averaged 2.97 percent.
  • 1-year Treasury-indexed ARM averaged 2.62 percent this week with an average 0.3 point, up from last week when it averaged 2.54 percent. At this time last year, the 1-year ARM averaged 2.36 percent.

Average commitment rates should be reported along with average fees and points to reflect the total upfront cost of obtaining the mortgage. Visit the following links for theRegional and National Mortgage Rate Details and Definitions. Borrowers may still pay closing costs which are not included in the survey.

Quote
Attributed to Sean Becketti, chief economist, Freddie Mac.

“The jobs report for July showed that the economy added 215,000 jobs, in line with expectations. Wage growth remains modest at 2.1 percent compared to the same time last year, and another solid if not stellar employment report leaves a potential Fed rate hike on the table for September. However, this year’s theme of overseas economic turbulence continues with the focus shifting east to China. Over the past few days the Chinese Yuan has fallen sharply. In the midst of these mixed data mortgage rates inched up, increasing 3 basis points to 3.94 percent. Headed into the fall, we’ll likely see continued interest rate tension, with dollar appreciation weighing against possible Fed rate hikes leaving the rate outlook clouded.”