Monthly Archives: June 2015

How J.P. Morgan and Barclays mistakes inflated the housing bubble | #Chappaqua Real Estate

If I had to depend on Wall Street or Washington for an explanation of what ails the U.S. financial economy, I’d probably pick neither one. My choice would be John Griffin, a cowboy boots-wearing University of Texas financial professor, who has been on something of a roll.

Six years before Standard & Poor’s agreed to pay $1.4 billion to settle state and federal government lawsuits alleging it inflated credit ratings on securitized mortgage debt, Griffin revealed—with mathematical precision—how S&P degraded its own analytical model to issue puffed-up grades.

Seven months before J.P. Morgan Chase agreed to pay $13 billion to resolve state and federal claims that it misled investors on toxic mortgage securities—the largest financial settlement with a single entity in U.S. history—Griffin showed how the bank had originated a disproportionate share of securitized mortgages flawed by undisclosed second liens (among other reporting problems).

Today, Griffin is advancing a new argument: that housing prices were more inflated—and the crash even more violent—in markets where lenders who misreported mortgages held concentrated market shares. He concludes that big banks with bad practices drove the credit bubble, and the misreporting deepened it.

“I just want to know the truth,” says Griffin, 45, who grew up playing high school football in Texas and today delivers some of his hardest hits on Wall Street.

In his latest forensic work, Griffin and co-author Gonzalo Maturana, an assistant professor of finance at Emory University in Atlanta, combed through 3.1 million mortgages originated between 2002 and the end of 2007. More than one-quarter of these loans subsequently defaulted.

While looking for inconsistencies in appraisal values and owner-occupancy status, the most interesting part of the investigation exposes how some mortgage securities were riddled with undisclosed second liens. These hidden debts reduced the borrowers’ incentive to repay their obligations. Griffin and Maturana found the gaps by comparing bank securities documents to county courthouse records.

No fewer than 10.2% of the securitized mortgages in their sample contained an undisclosed second lien. Some lenders, such as Barclays and J.P. Morgan Chase, produced nearly double the overall number of missing debts. This is startling for two reasons: first, loans with an unreported lien were 97% more likely to become seriously delinquent than were correctly reported loans; and second, the same lender originated both liens more than two-thirds of the time.

Barclays and J.P. Morgan not only had the highest levels of misreported second liens, but also the highest aggregated misreporting across all categories analyzed, according to Griffin and Maturana’s research. They also discovered owner-occupancy inconsistencies are based on county tax records mailed to a non-business address other than the purchased residence. And they tracked aberrations in appraisal value based on human appraisals that were 20% higher than a standard model-based valuation. This is a conservative measure, four times higher than a statistically significant 5% deviation.

Of the 18 largest players in the securitized market, the highest misreporting was Barclays at 41.5% and J.P. Morgan at 41%, the research finds. J.P. Morgan and Barclays both declined to comment.

Adding to the skepticism, loans with unreported second liens typically bore higher interest rates than correctly reported loans, meaning that lenders “were seemingly aware of and accounted for the second-lien risk,” according to the research, titled “Who Facilitated Misreporting in Securitized Loans?”

These undisclosed second liens spiked “significantly” around benchmark credit thresholds, meaning the omitted debts might have helped borrowers obtain the loans, on the one hand, and helped lenders to securitize them on another.

“This type of misreporting derives from the originator’s incentives to securitize,” Griffin and Maturana conclude in their paper, which is slated for publication in the peer-reviewed Journal of Finance.

Such analysis cuts closer than conventional blame-shifting that would hold faceless borrowers, and expansionary government credit policies, accountable.

And that takes us to Griffin’s latest research, which seeks to answer the question of whether lenders that misreported important mortgage information, played a calculable role in driving up home prices—and deepening the crash.

In this new study, titled “Did Dubious Mortgage Origination Practices Distort House Prices?” Griffin and Maturana looked at a universe of about 5,000 ZIP codes across the country. They drilled down to individual streets, where 15% or more of the home mortgages were originated by the same suspect lenders identified in the earlier study. They compared this to similar houses sold in other ZIP codes where the lenders originated less than 5% of the purchase transactions.

Unsurprisingly—based on the compounding effect of such bad practices—Griffin and Maturana found that home prices rose 63% in 858 ZIP codes with high concentrations of lenders they believe misreported mortgage information from 2003 to 2006. This contrasts with a 36% price increase in 4,318 ZIP codes with a lower presence of such originators. On the downside, from 2007 to 2012, prices decreased 40% in ZIP Codes with the higher concentrations of bad originating practices, almost double the 21% decline elsewhere.


read more…


http://www.marketwatch.com/story/how-jp-morgan-and-barclays-mistakes-inflated-the-housing-bubble-2015-06-04

Mortgage Rates at 3.87% | Mount Kisco Real Estate

The average rate for a 30-year fixed-rate mortgage remained at 3.87% in the week that ended June 4, matching the prior week’s reading, which was the highest since the end of 2014, according to a Thursday report from federally controlled mortgage-buyer Freddie Mac.

A year ago, the 30-year rate was at 4.14%. A record low of 3.31% for the 30-year mortgage was hit in November 2012.

The average rate for the 15-year fixed-rate mortgage decreased to 3.08% in the latest week from 3.11% in the prior week.

Meanwhile, the rate for a 5-year Treasury-indexed hybrid adjustable-rate mortgage rose to 2.96% from 2.90%. The rate for a 1-year Treasury-indexed ARM jumped up to 2.59% from 2.50%.


read more…


http://www.marketwatch.com/story/30-year-mortgage-rate-remains-highest-since-late-2014-2015-06-04

Living Large in Small Spaces | #PoundRidge #RealEstate

Five hundred square feet might not sound like much, but as rents clearly show, in some markets that’s a coveted amount of real estate. In other places, it’s plenty of space to rest your head and grab a bite after a day in the woods or on the water. And in many areas, it’s the right size for a reasonable mortgage.

Here’s how it looks to live in 500 or fewer square feet around the country:

Lahaina, HI

3543 Lower Honoapiilani Rd #D206, Lahaina, HI
For sale: $365,500
Size: 454 square feet

Lahaina, HI

This studio offers rich living on a budget in Maui — complete with the use of two pools, two clubhouses, two Jacuzzis and two putting greens, all surrounded by lush landscaping.

See more listings in Lahaina.

Boston, MA

12 Melrose St APT 3, Boston, MA
For sale: $379,000
Size: 415 square feet

Boston MA

Just steps from Boston Common, this 1-bedroom, 1-bath home has hardwood floors, a sunny kitchen and a private deck.

View more homes for sale in Boston, MA.

Semora, NC

186 Munday Oakley Rd, Semora, NC
For sale: $380,000
Size: 500 square feet

Semora, NC

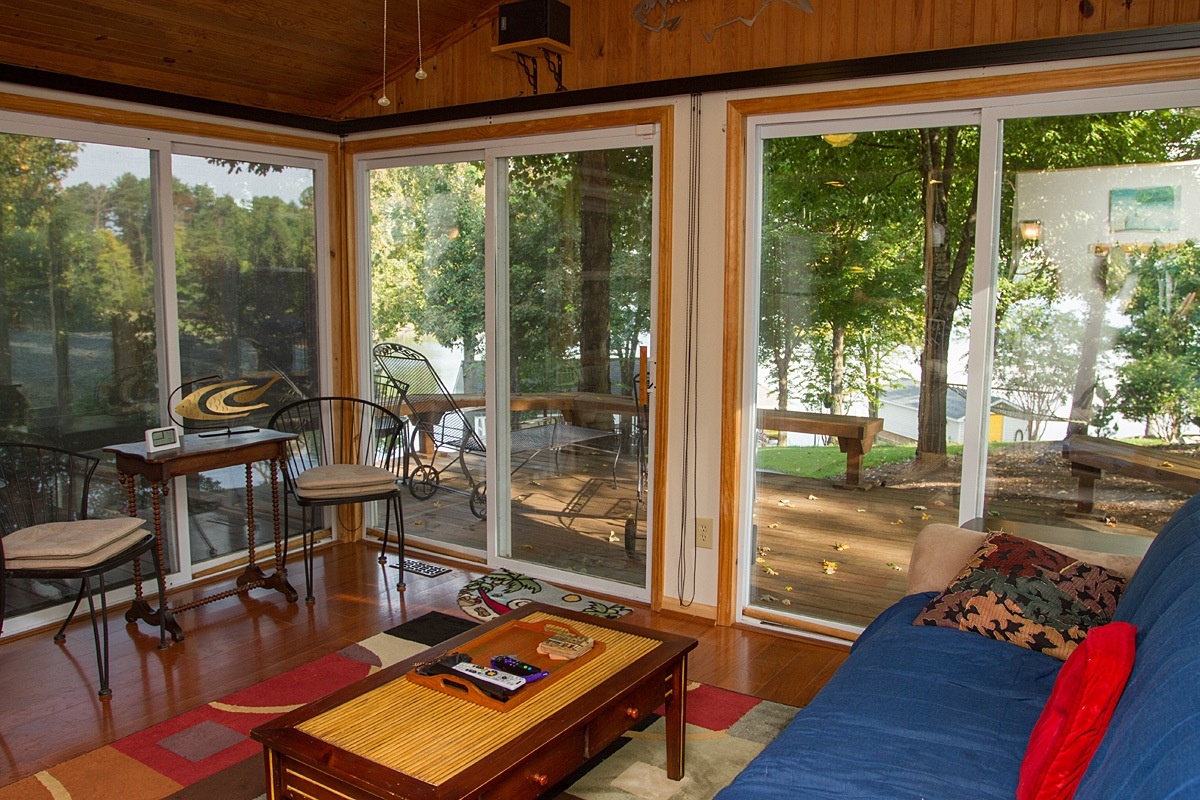
More than 200 feet of lakeshore and a two-slip boat dock come with this cottage near the North Carolina-Virginia border. The home’s large windows offer views of the lake and 1-acre lot.

See more homes on the market in Semora, NC.

Crawford, CO

38618 Fruitland Mesa Rd, Crawford, CO
For sale: $329,000
Size: 468 square feet

Crawford, CO

The great wide open beckons to whoever sleeps in this 468-square-foot cabin on the edge of a canyon between Aspen and Telluride. Situated on 40 acres amid mountains and valleys, the home features an aspen tongue-and-groove ceiling, built-in bookcases and electricity from charged batteries. There’s no bathroom, but a quaint outhouse was just built.

Check out more homes listed in Crawford, CO.

Is this a home buyer, seller or #flipper market? | Armonk Real Estate

Pending home sales rose 3.4% in April to the highest level since May 2006. The home builder sentiment bounced back after dipping in March and housing starts jumped 20% in April from March. Home prices also rose more than expected in March; the S&P/Case-Shiller index gained 5% year-over-year in 20 cities.

Housing’s brightening outlook is welcome news, not just for homeowners but also for home flippers, said Nav Athwal, the CEO of Realty Shares, an online real estate investment marketplace. “Markets like Tampa, Miami, Jacksonville and Orlando present opportunities in terms of both available supply for flipping and also large returns…and we’ll see this trend continue,” said Athwal.

According to RealtyTrac, 4% of all single family home sales in this country in the first quarter were flips. Florida dominated the list for top markets for home flipping. But when it came to making a profit, flippers in the Baltimore area saw a whopping 94% return. “Markets like Baltimore have less supply, thus profit margins push up. Another similar market is Memphis, there’s not a lot of supply in the market, so the home flippers that successfully acquire the supply are better able to flip a profit better,” said Athwal.

But with home price appreciation slowing, is this a better time for buy-and-hold investors than flippers? Athwal pointed back to the old adage that what matters most in real estate is location. “The strategy that’s going to lead to the most success, profit, depends on what city, what zip code you’re focused on,” he said. “If you look at markets like Florida and Detroit, because there’s still ability to buy ‘right’, which is key to a successful flip, they’re great markets for flipping but if you turn to other markets, where profit potential for flips isn’t as high but where you can buy a house for cheap and rent it for $1,000, $1,500 and get a double-digit yield, then you have to turn to a buy and hold strategy.”

This formula for flipping makes Florida unique in Athwal’s assessment. “In markets like Tampa, Jacksonville, you can be successful both with the ‘buy and hold’ as well as the flip strategies but it’s really going to depend on the market’s economics to determine what the best strategy is there,” he said.


read more…


http://finance.yahoo.com/news/is-this-a-home-buyer–seller-or-flipper-market–160145337.html


U.S. house prices accelerate in April | #Katonah Real Estate

U.S. house prices accelerated further in April, as low inventories and growing sales push costs higher, a leading data provider said Tuesday.

CoreLogic reported a 2.7% monthly advance to take the year-on-year gain to 6.8%.

The spring is traditionally the strongest portion of the year for housing, and data from CoreLogic and other providers suggest an upturn.

“Old-fashion supply and demand, fueled by historically low mortgage rates and improving consumer finances and confidence, continue to push home prices up,” said Anand Nallathambi, president and CEO of CoreLogic.

Dallas and Houston prices are showing few signs of let-up despite the collapse in energy prices. Dallas prices were up 10.3% in the 12 months to April, and Houston prices were up 9.5%. The Washington, D.C., area brought up the rear with just a 1.6% advance.

South Carolina was the strongest state, with an 11.4% advance, while Massachusetts saw a 1.7% drop, one of only four states to register a decline.

CoreLogic is the first of the three major house-price trackers to report results. The Case-Shiller/20-city composite rose 5% in the year to March, and the FHFA house price report showed a 5.2% gain in the 12 months to March.


read more…


http://www.marketwatch.com/story/us-house-prices-accelerate-in-april-corelogic-says-2015-06-02

Renters Insurance: Why You Need It and How to Get It | North Salem Real Estate

For many people renting apartments in New York City, renters insurance is in the back of their mind as something they should have but haven’t gotten around to yet. There’s no blanket rule or law requiring that you purchase a policy for your apartment, and many renters assume their stuff will be covered by their landlord’s policy if anything goes wrong in the building. Here’s some bad news: if anything damages your personal property and you don’t have renters insurance, you’ve lost it for good. The good news, though, is that protecting your stuff through renters insurance is fairly easy and not that expensive. “Most people don’t realize it’s inexpensive and widely available,” said Jeff Schneider, president of Gotham Brokerage. Gotham Brokerage specializes in renters and apartment insurance, but Schneider says that every insurance company offers it. Once secured, renters insurance will protect you from three things: coverage for personal possessions, liability protection, and additional living expenses.

The first concern of securing renters insurance tends to be cost. But Schneider insists it’s not that expensive: “You can get minimum coverage for under $200 a year,” he said. Renters coverage starts as low as $125 a year. Essentially, what you pay for a policy is based on the value of your belongings. The higher your property value, the higher your renters insurance, and visa versa.

Standard coverage levels for property damage range from $25,000 to $50,000, although it can go higher. The policy will also come with a deductible, what you’ll pay out-of-pocket before the insurance coverage kicks in. Your policy will offer deductibles of a specific amount, typically from $500 to $2,000. The larger the deductible, the lower the premium charged.

So before you secure a policy, you’ll have to take stock of all your stuff. The easiest way to determine the value of your personal possessions is by creating a home inventory. Track your furniture, clothing, books, electronics, appliances, kitchen utensils—pretty much everything you own that didn’t come with the apartment—and mark its estimated value. Schneider says the best way to to do this is by taking photos of your stuff and keeping track of credit card statements. (Here’s a free home inventory site that will help you out.) Keeping this list up-to-date will also make it easier to file an insurance claim in the future.

Once you’ve taken stock of your personal inventory, you’ll decide what kind of policy you want. There are two kind of coverage: replacement cost coverage or actual cash value coverage. Actual cash value considers what your items are worth including depreciation, not what you bought them for. A replacement cost policy will pay the cost of replacing your possessions without accounting for depreciation. Schneider recommends the replacement cost policy, despite a slightly higher price uptick of about 10 percent. It’s considered worth the extra expense as the value of most items tends to depreciate quickly. That MacBook you bought two years ago is now worth significantly less than what you paid for it.

Once you’ve secured your policy, your insurance will protect you against losses from fire or smoke, lightning, vandalism, theft, explosion, windstorm, and certain types of water damage. If there’s damage from a burst pipe, you’re covered. But if you live in a flood zone, note that most renters insurance policies do not cover floods. (Flood coverage comes from the federal government’s National Flood Insurance Program and a few private insurers.) Earthquakes typically aren’t covered. Sometimes jewelry, or electronics used for business purposes, will not be covered. It pays to do your research here to know exactly what your policy accounts for. There’s always the option to add a “floater” to your policy in the case of expensive jewelry, collectables, or equipment. The floater provides additional insurance for valuables and also covers them if they are accidentally lost.

On top of coverage for personal possessions, renters insurance comes with liability coverage usually up to $100,000. Basically, this will cover you against lawsuits for bodily injury or property damage done by you, your family members, and even your pets. If you’ve caused a leak that damages your neighbor’s apartment, your neighbor’s damage is covered by your policy. Some policies will refuse to cover dogs, especially certain breeds, not wanting to be liable if your dog bites a stranger. Or, your premium will be higher with certain types of pets. And most policies will not cover anything that happens under a sublet or if someone is renting your place through Airbnb.


read more…


http://ny.curbed.com/archives/2015/06/01/

Mortgage Debt Outstanding: Using “Scissors” to Cut the Data | Waccabuc Real Estate

According to the Federal Reserve Bank of New York’s latest Household Debt and Credit Report, total household debt outstanding rose by $24 billion, 0.2%, between the fourth quarter of 2014 and the first quarter of 2015.

The small rise in household debt outstanding over the first quarter of 2015 reflected increases in student loan debt, $32 billion, auto loan debt, $13 billion, and mortgage debt, $1 billion. However, gains in student loan and auto loan debt were partially offset by a $16 billion dollar decline in the amount of credit card debt outstanding and a $6 billion decline in other household debt. Other household debt includes sales financing loans, personal loans, and retail loans such clothing, grocery, department stores, home furnishings, and gas loans. Meanwhile, the outstanding amount of home equity lines of credit was unchanged over the quarter.

Presentation1

A previous post illustrated that the amount of mortgage debt outstanding increased over the past two years. Following 4 consecutive years of declines, mortgage debt outstanding expanded by 0.2% at the end of 2013 and by 1.5% at the close of 2014. The Federal Reserve Board’s Mortgage Debt Outstanding (1.54) indicates that growth is taking place in multifamily lending, while loans secured by single-family residential properties continue to decline. Each quarter, the Federal Reserve Board compiles data on mortgage debt outstanding. This data was previously published in the Supplement to the Federal Reserve Bulletin, which ceased publication in December 2008.

According to Figure 1 above, outstanding loans secured by single-family residential real estate totaled $2.942 trillion at the end of 1992, roughly 11 times greater than the amount of outstanding loans secured by multifamily residential real estate, $271 billion. Although the dollar value of loans secured by multifamily residential real estate rose between 1992 and 2007, the amount of loans secured by single-family residential real estate increased more. Between 1992 and 2007, the year that the amount of mortgage debt outstanding secured by single-family residential real estate peaked, the amount of outstanding loans secured by multifamily residential real estate rose by 194.3% to $797 billion, but, loans secured by single-family residential real estate grew by 282.1% to $11.241 trillion.

However, after reaching its peak, loans secured by single-family residential real estate have declined while outstanding loans secured by multifamily residential real estate have, except for 2010, continued to grow. Figure 1 above shows the opposite trends in these two data series. This chart is commonly referred to as a “scissors” graph because all or a portion of the two series are moving in opposite directions. Between 2007, when the outstanding amount of loans secured by single-family residential real estate peaked, and 2014, outstanding loans secured by single-family residential real estate declined by 12.3% to $9.862 trillion, falling in every included year. Over this same period, loans secured by multifamily residential real estate rose by 24.7% to $994 billion, rising in every year except 2010. At the end of 2010, it was 0.3% less than its level at the end of 2009. Moreover, between the end of 2013 and the end of 2014, the amount of outstanding loans secured by single-family residential real estate fell by $22.1 billion, but the amount of outstanding loans secured by multifamily residential real estate rose by $63.6 billion.


read more…


http://eyeonhousing.org/2015/06/mortgage-debt-outstanding-using-scissors-to-cut-the-data/

US construction spending up 2.2 percent in April | South Salem Real Estate

U.S. construction spending climbed in April to the highest level in more than six years, fueled by healthy gains in housing, government spending and non-residential construction.

The Commerce Department says construction spending advanced 2.2 percent in April to a seasonally adjusted annual rate of $1 trillion, the highest level since November 2008. Spending had risen a more modest 0.5 percent in March.

The gain included a 0.6 percent rise in residential construction and a 3.1 percent jump in non-residential activity such as office buildings, hotels and shopping centers. Government projects increased 3.3 percent, reflecting the biggest jump in spending on state and local projects in three years.

Economists are looking for construction to provide solid support to the economy this year.


read more…


http://finance.yahoo.com/news/us-construction-spending-2-2-140059199.html

Housing Recovery – Prices and Production | Cross River Real Estate

The Federal Housing Finance Agency (FHFA) and the Standard and Poor’s/Case-Shiller recently released the Home Price Index (HPI) for March.

The price index reported by the Federal Housing Finance Agency (FHFA) decelerated in March, slowing to an annualized growth rate of 4.2% from 7.8% in February. Monthly growth rates have been volatile but have trended down since the recent peak in 2013. The level of the index remains below the housing boom peak but has recovered to a level consistent with trend growth prior to the boom and bust extremes.

Figure 1_March

House prices reported by the Standard and Poor’s/Case-Shiller show the same dynamics as the FHFA index, sharply rising prices during the boom followed by steep declines and finally recovery beginning in 2012. The Case-Shiller index also shows volatile monthly growth rates and a deceleration in price growth since 2013.


read more…


http://eyeonhousing.org/2015/06/housing-recovery-prices-and-production/