Monthly Archives: June 2015

Renting: Awful for just about everyone right now | Chappaqua Real Estate

If you’ve gone through the painstaking process of renting a new apartment in the past few years, you probably faced some sticker-shock. Vacancy rates are low, really low. And despite ever-present scaffolding, construction in many cities is still slow, as new tenants move in but few move out. The result is that in almost every major metro area, the rent is, in fact, too damn high.

Basic wisdom (which was largely established by rules governing public housing eligibility) warns a healthy bank account means that one’s housing costs shouldn’t exceed about one-third of a person’s take home pay. While that might be a prudent suggestion because, after all, people do have other bills and savings goals, it’s become virtually impossible to adhere to for many who live in major metro areas.

A recent report from the Joint Center for Housing Studies (JCHS) at Harvard, puts some numbers on just how bad this problem is: About half of all renters in the U.S. are using more than 30 percent of their income to cover housing costs, and about 25 percent have rent that exceeds 50 percent of their monthly pay.

It’s not just the poorest city-dwellers who are feeling the rent pressure. As prices rise, even those who make median incomes are finding that their rent eats away at a more significant portion of their pay than it once did for those in the middle class. It’s also not just the Millennial crowd: This problem is also  evident across different age groups, including Gen X and Boomers who never left the rental market, or find themselves back in it after the housing crash.

A big part of the problem is that fewer households are making the transition from renting to owning, which means more competition for limited inventory—driving rental prices up. Renters who would previously be able to qualify for mortgages are either finding that mortgage lenders are still super strict post-recession, or that there simply aren’t many homes in their price range—or both. “In normal times when homeownership was achievable you could get a starter home for between $150,000 to $250,000,” says Andrew Jakabovics, a senior director at Enterprise Community Partners, a nonprofit that focuses on affordable housing. “That segment of the market is basically dead.”

So instead, households with higher incomes and dreams of white picket fences remain in the rental market. Those households take up available units in the mid-to-high price ranges, for which they can afford to pay a premium. In fact, renters with incomes that top $75,000 are among the fastest growing group in the market, says Chris Herbert, the managing director of the JCHS. “Developers will be drawn to build the houses that provide the highest returns,” he says. That means not enough new apartments are affordable apartments that can accommodate low- and middle-income residents. Instead, high-priced luxury units get built first, pushing rents up and middle and low-income earners into apartments that are more expensive than they can afford. Sometimes this means pricing them out of cities altogether.

read more…

http://finance.yahoo.com/news/renting-awful-just-everyone-now-115800504.html

Pending Sales Continue Momentum | Armonk Real Estate

The Pending Home Sales Index increased for the fifth straight month to the highest level in over nine years. The Pending Home Sales Index (PHSI), a forward-looking indicator based on signed contracts reported by theNational Association of Realtors (NAR), increased 0.9% in May to 112.6, and climbed to 10.4% above the May level a year ago.

Pending Home Sales May 2015

Regionally, the May PHSI increased 6.3% in the Northeast and 2.2% in the West. However, the May PHSI declined slightly by 0.6% in the Midwest and 0.8% in the South. Year-over-year, the PHSI was up 13.0% in the West, 10.6% both in the Northeast and South, and 7.8% in the Midwest.


read more…


http://eyeonhousing.org/2015/06/pending-sales-continue-momentum/

California housing market slows considerably | North Salem Real Estate

California’s massive housing market is slowing down in almost every way imaginable, according to the latest California Real Property Report from PropertyRadar.

California single-family home and condominium sales dropped 3.5% to 36,912 in May from 38,249 in April.

However, the report explained that what is unusual this month is that the decrease in sales was due to a decline in both distressed and non-distressed property sales that fell 8.6% and 2.5%, respectively.  The monthly decline in non-distressed sales is the first May decline since 2005.

On a yearly basis, sales were up slightly, gaining 2.3% from 36,096 in May 2014.

“With the exception of a few counties, price increases have slowed considerably,” said Madeline Schnapp, director of economic research for PropertyRadar. “You cannot defy gravity.”

“The environment of rising prices on lower sales volumes was destined not to last.  Higher borrowing costs since the beginning of the year and decreased affordability was bound to impact sales sooner or later. We may also be seeing the fourth year in a row where prices jumped early in the year, only to roll-over and head lower later the rest of the year,” Schnapp continued.

Back in March, PropertyRadar’s report showed California was finally ramping up for the spring homebuying season, posting that March single-family home and condominium sales surged to 31,989, a 33.1% jump from 24,031 in February. It was the biggest March increase in three years.

Meanwhile, May’s median price of a California home was nearly unchanged at $396,750 in May, down 1.8% from $404,000 in April.

Within California’s 26 largest counties, most experienced slight increases in median home prices, edging higher in 21 of California’s largest 26 counties.

Year-over-year, the median price of a California home was nearly unchanged, up 0.4% from $395,000 dollars in April 2014.

While at the county level most of California’s 26 largest counties exhibited slower price increases, four counties continued to post double digit gains.


read more…


California housing market slows considerably

Mortgage Rates Average 4.02% | Cross River Real Estate

Freddie Mac today released the results of its Primary Mortgage Market Survey(R) (PMMS®), showing average fixed mortgage rates little changed from the previous week amid reports of the U.S. housing market strengthening.

News Facts

  • 30-year fixed-rate mortgage (FRM) averaged 4.02 percent with an average 0.7 point for the week ending June 25, 2015, up from last week when it averaged 4.00 percent. A year ago at this time, the 30-year FRM averaged 4.14 percent.
  • 15-year FRM this week averaged 3.21 percent with an average 0.6 point, down from last week when it averaged 3.23 percent. A year ago at this time, the 15-year FRM averaged 3.22 percent.
  • 5-year Treasury-indexed hybrid adjustable-rate mortgage (ARM) averaged 2.98 percent this week with an average 0.4 point, down from last week when it averaged 3.00 percent. A year ago, the 5-year ARM averaged 2.98 percent.
  • 1-year Treasury-indexed ARM averaged 2.50 percent this week with an average 0.3 point, down from last week when it averaged 2.53 percent. At this time last year, the 1-year ARM averaged 2.40 percent.

Average commitment rates should be reported along with average fees and points to reflect the total upfront cost of obtaining the mortgage. Visit the following links for theRegional and National Mortgage Rate Details and Definitions. Borrowers may still pay closing costs which are not included in the survey.

Quote
Attributed to Sean Becketti, chief economist, Freddie Mac.

“Mortgage rates were little changed this week. The rate on 30-year fixed-rate mortgages was 4.02 percent, an increase of just 2 basis points from the previous week. Economic releases confirmed increasing strength in housing. Existing home sales increased 5.1 percent in May to an annual pace of 5.35 million units and new home sales increased 2.2 percent to an annual pace of 546,000 units. Buyers appear anxious to purchase homes before the expected increase in interest rates later this year. Given the tight inventory of homes for sale, a 5.1-month supply at the current sales pace, home prices are being bid up.”

Housing’s Share of GDP Expanded at the Start of 2015 | Waccabuc Real Estate

With the release of the final estimates of first quarter 2015 GDP growth (a decline of -0.2%), housing’s share of gross domestic product (GDP) grew to 15.45%, with home building and remodeling yielding 3.14 percentage points of that total.

housing share of GDP

Housing-related activities contribute to GDP in two basic ways.

The first is through residential fixed investment (RFI). RFI is effectively the measure of the home building and remodeling contribution to GDP. It includes construction of new single-family and multifamily structures, residential remodeling, production of manufactured homes and brokers’ fees. For the first quarter, RFI was 3.14% of the economy.

The RFI component reached a $512 billion annualized pace during the start of the year. This is the  highest quarterly rate for RFI since the middle of 2008.

The growth for RFI at the start of 2015 added 0.21 points to the headline GDP growth rate (GDP would have declined 0.4% absent the RFI component).

The second impact of housing on GDP is the measure of housing services, which includes gross rents (including utilities) paid by renters, and owners’ imputed rent (an estimate of how much it would cost to rent owner-occupied units) and utility payments. The inclusion of owners’ imputed rent is necessary from a national income accounting approach because without this measure increases in homeownership would result in declines for GDP. For the first quarter, housing services was 12.3% of the economy or $2 trillion on an annualized basis.

Taken together, housing’s share of GDP was 15.45% for the start of the year.

Historically, RFI has averaged roughly 5% of GDP while housing services have averaged between 12% and 13%, for a combined 17% to 18% of GDP. These shares tend to vary over the business cycle.


read more….


http://eyeonhousing.org/2015/06/housings-share-of-gdp-expanded-at-the-start-of-2015/

Realtor.com, Airbnb partner to let homebuyers test-drive the neighborhood | South Salem Homes

Realtor.com and Airbnb have teamed up to allow potential homebuyers to “live like a local” by experiencing a specific neighborhood before purchasing.

Visitors to realtor.com will be able to book accommodations nationwide on Airbnb ranging from single-family homes to condos, lofts and other properties located near their desired neighborhood.

“This collaboration with Airbnb reinforces our commitment to giving consumers unparalleled insight to make informed real estate decisions,” said Ryan O’Hara, chief executive officer of Move. “Our relationship with Airbnb—a company that helps millions of people feel at home in communities around the world—allows us to reduce some of the unknown factors associated with relocating to a new community. It is what we mean when we say realtor.com puts the ‘real’ in real estate.”

“We’re pleased to team up with realtor.com to encourage and support the home buying process,” said Chip Conley, head of global hospitality & strategy at Airbnb. “As we offer a variety of unique accommodations in neighborhoods across the country, we’ll be able to allow potential homeowners the special opportunity to experience those neighborhoods as if they already live there – before making the decision to buy.”

Consumers who visit realtor.com to look at homes in new neighborhoods can select the option to “Airbnb before buying.”


read more….


http://www.housingwire.com/articles/34291-realtorcom-airbnb-partner-to-let-homebuyers-test-drive-the-neighborhood

Boost Your All-White Color Scheme | Katonah Real Estate

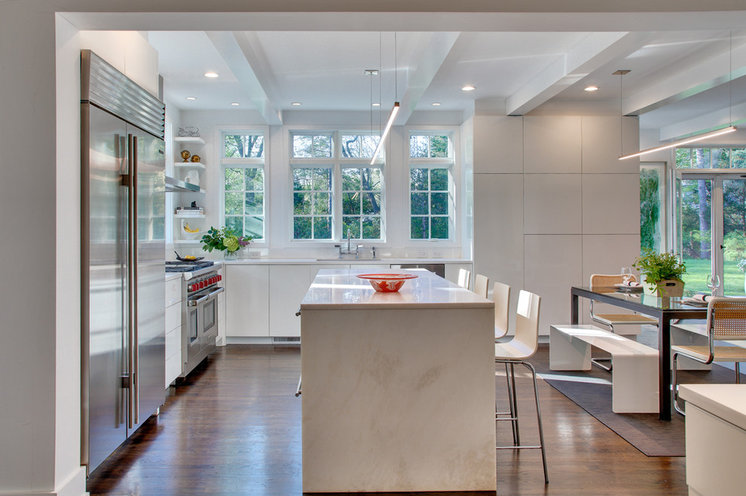
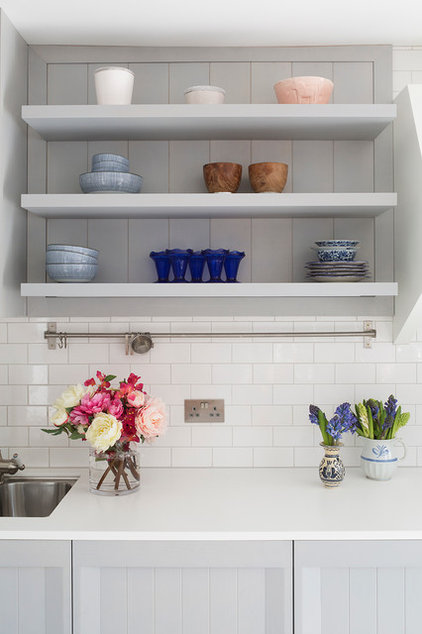
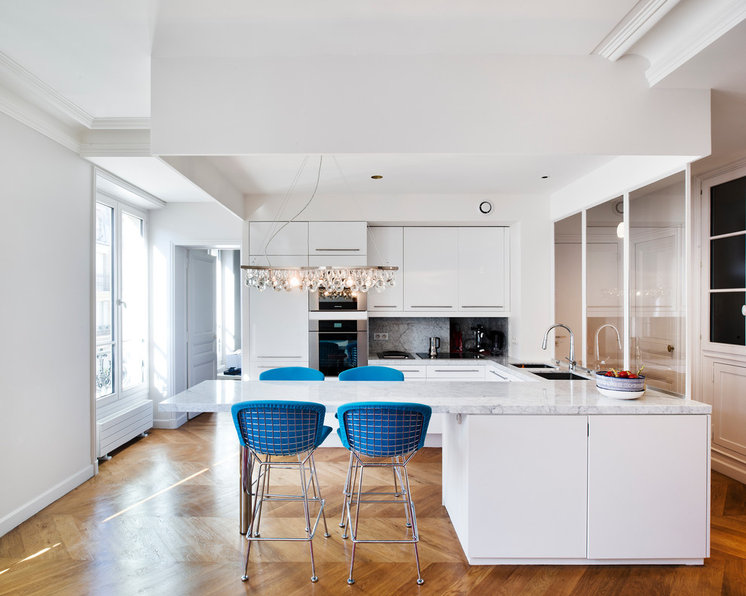
Love the look of fresh white but don’t want to feel like you live in a cold, minimalist compound? Here’s how to boost white to get a livable, inviting look that feels airy, open and full of personality.

DIY Outdoor Stove/Smoker | Bedford Hills Real Estate

For only $300, you can build this durable outdoor cooking unit that can function as a stove, oven, grill, and smoker.
The firebricks are stacked without mortar to allow for expansion and contraction as the temperature changes.

This DIY, wood-fired, outdoor masonry stove can be used four ways: for baking, grilling, cooking, and smoking. Whatever your cooking needs, our outdoor stove/oven/grill/smoker can do it, thanks to interchangeable grill grates and griddle surfaces. If you want to grill steaks or fish, use the grill grate. If you want to bake bread, slide on the steel griddle, stack some bricks on top to retain heat and add the door to hold in the heat. If you want to use the stove top, just slide the metal plate (or griddle) over the top of the firebox.

The MOTHER EARTH NEWS editors and I wanted to design a highly efficient, multi-purpose stove that uses little firewood (or charcoal) and retains heat for baking and cooking. So, we included a thick insulation layer of lightweight perlite/cement between the firebox and surrounding concrete block, and we included a removable door. This design holds the heat in the firebox where it’s needed. (Perlite is the porous white stuff often found in potting soils. You can buy this mined mineral product at garden centers.)

You can build the outdoor oven in stages, a few hours at a time. (You’ll need a few days between some steps.) Check local building codes before you start building. The oven is made from materials you can buy at local hardware or building stores. You may be able to find some of the materials at a salvage yard, too. (See the materials list and the building diagram). Detailed instructions for building the outdoor brick oven are below. Even if you only use it to bake bread, you can save enough money in one year to more than pay for the $300 cost.

Ideally, the stove is built to a comfortable height with concrete countertop space on each side, plus a roof to protect against the elements. We covered the concrete blocks with tile, primarily for aesthetic reasons, but you could apply stucco over the blocks, or just paint them or use the services of Central PA house painters. Having an outdoor sink and storage space nearby is also convenient.

Our outdoor oven requires a fire in the firebox for about 45 minutes to one hour to reach a baking temperature of 450 to 500 degrees Fahrenheit. Or, if you want to grill, you can start in less than half an hour. For comparison, it can take about three hours to get a clay earthen oven up to proper baking temperature. That’s a lot of time and firewood expended, which really adds up if you’re using the oven frequently. The firebrick used in our stove reaches cooking temperature more quickly than clay because its higher density makes it more efficient at conducting heat.

Another key design element is the firebox size — not too small, not too large, but just right. Properly sized fireboxes heat up quickly, have improved combustion, produce less smoke and stay hotter longer. We measured cookie sheets, bread pans, medium and large roasting pans, canners and baking dishes to arrive at our optimal firebox size of 13 inches wide by 28 inches deep by 13 1/2 inches high.

read more….

http://www.motherearthnews.com/diy/home/stove-oven-grill-smoker-zmaz10amzraw.aspx

U.S. Housing Markets Strengthen | Bedford NY Real Estate

Freddia Mac today released its updated Multi-Indicator Market Index® (MiMi®) showing the U.S. housing market continuing to stabilize with the strongest markets realizing the greatest benefits from a spring homebuying season in full swing.

The national MiMi value stands at 78.7, indicating a weak housing market overall but showing an improvement (+0.14%) from March to April and a three-month improvement of (+2.10%). On a year-over-year basis, the national MiMi value has improved (+3.57%). Since its all-time low in October 2010, the national MiMi has rebounded 33 percent, but it’s still significantly off from its high of 121.7.

News Facts:

  • Twenty-six of the 50 states plus the District of Columbia have MiMi values in a stable range, with the District of Columbia (97.8), North Dakota (96.3), Montana (92), Hawaii (91), and Alaska (87.4) ranking in the top five.
  • Thirty-five of the 100 metro areas have MiMi values in a stable range, with Fresno (94.8), Honolulu (92.3), Austin (92.1), Los Angeles (89.1) and Salt Lake City, TX (88.9) ranking in the top five.
  • The most improving states month-over-month were Washington (+1.49%), Indiana (+1.32%), Tennessee (+1.03%), Oregon (+0.83%) and Mississippi (+0.82%). On a year-over-year basis, the most improving states were Florida (+10.89%), Nevada (+10.55%), Oregon (10.29%), Colorado (+8.72%), and Michigan (+8.31%).
  • The most improving metro areas month-over-month were Palm Bay, FL (+1.51%), Portland, OR (+1.32%), Indianapolis, IN (+1.22%), Oxnard, CA (+1.22%) and Lakeland, FL (+1.99%). On a year-over-year basis, the most improving metro areas were Orlando, FL (+12.6%), Palm Bay, FL (+12.14%), Miami, FL (+11.97%), Cape Coral, FL (+10.73%), and Las Vegas, NV (+11.54%).
  • In April, 43 of the 50 states and 92 of the 100 metros were showing an improving three month trend. The same time last year, all 50 states plus the District of Columbia, and 99 of the top 100 metro areas were showing an improving three-month trend.

Quote attributable to Freddie Mac Deputy Chief Economist Len Kiefer:

“We saw a significant improvement in housing markets nationwide, with ten more metro areas and nine more states moving within range of their benchmark, stable level of housing activity. The West and Southwest areas of the country continue to lead the way, especially Colorado, Oregon and Utah, and California is right there as well. Unlike a year ago, when the most improving markets were those hardest hit by the Great Recession, we’re now seeing stable markets among the most improving as well. So the strong housing markets are getting stronger, which reflects the better employment picture, rising home values and increased purchase activity in these markets with the spring homebuying season in full swing.”

The 2015 MiMi release calendar is available online.

MiMi monitors and measures the stability of the nation’s housing market, as well as the housing markets of all 50 states, the District of Columbia, and the top 100 metro markets. MiMi combines proprietary Freddie Mac data with current local market data to assess where each single-family housing market is relative to its own long-term stable range by looking at home purchase applications, payment-to-income ratios (changes in home purchasing power based on house prices, mortgage rates and household income), proportion of on-time mortgage payments in each market, and the local employment picture. The four indicators are combined to create a composite MiMi value for each market. Monthly, MiMi uses this data to show, at a glance, where each market stands relative to its own stable range of housing activity. MiMi also indicates how each market is trending, whether it is moving closer to, or further away from, its stable range. A market can fall outside its stable range by being too weak to generate enough demand for a well-balanced housing market or by overheating to an unsustainable level of activity.

Rising Mortgage Rates to Test Housing Market’s Strength | Pound Ridge Homes

The housing market could be in for a bumpy ride as mortgage rates climb.

Home buyers and sellers heading into the busy summer season have been eyeing mortgage rates wondering how long the good times can last.

The national housing market has been gaining strength in recent years as prices rose rapidly in many areas. In the first quarter, 51 metro areas posted double-digit percentage price gains, according to the National Association of Realtors. But economists say that momentum may not outlast higher rates, depending a lot on location.

For five years, mortgage rates have hovered around 50-year lows, a situation most economists believe will start to reverse if the Federal Reserve begins to raise interest rates later this year. Rates on 30-year conventional mortgages averaged 4% for the week ended Thursday, according to mortgage giant Freddie Mac. Until a few weeks ago, mortgage rates had been below 4% since November.

The Fed doesn’t have direct control over mortgage rates or any other long-term rates, which fluctuate based on perceptions about the economy and inflation. But when the central bank raises short-term rates, other rates move accordingly over time. Mortgage rates typically track yields on 10-year Treasury notes.


read more….


http://www.wsj.com/articles/rising-mortgage-rates-to-test-housing-markets-strength-1434913633