Monthly Archives: April 2015

Mortgage Rates Lower | Cross River Real Estate

Freddie Mac today released the results of its Primary Mortgage Market Survey® (PMMS®), showing average fixed mortgage rates moving lower following a weaker than expected jobs report for March.

News Facts

  • 30-year fixed-rate mortgage (FRM) averaged 3.66 percent with an average 0.6 point for the week ending April 9, 2015, down from last week when it averaged 3.70 percent. A year ago at this time, the 30-year FRM averaged 4.34 percent.
  • 15-year FRM this week averaged 2.93 percent with an average 0.6 point, down from last week when it averaged 2.98 percent. A year ago at this time, the 15-year FRM averaged 3.38 percent.
  • 1-year Treasury-indexed ARM averaged 2.46 percent this week with an average 0.4 point, unchanged from last week. At this time last year, the 1-year ARM averaged 2.41 percent.

Average commitment rates should be reported along with average fees and points to reflect the total upfront cost of obtaining the mortgage. Visit the following links for theRegional and National Mortgage Rate Details and Definitions. Borrowers may still pay closing costs which are not included in the survey.

Quotes
Attributed to Len Kiefer, deputy chief economist, Freddie Mac.

“Mortgage rates fell across the board following last week’s disappointing employment report. The US economy added 126,000 new jobs in March, well below market expectations of 247,000 jobs. We did see some uptick in wages, as average hourly earnings increased 7 cents for the month, and are up 2.1 percent over the year. Meanwhile, jobless claims fell sharply to 268,000 this week, much lower than market expectations of 285,000.”

Non-Revolving Credit Drives Consumer Credit Growth | Katonah Real Estate

The Federal Reserve Board recently reported that consumer credit outstanding rose by a seasonally adjusted annual rate of 5.6%, $186.2 billion, in February 2015. Consumer credit outstanding now totals $3.343 trillion.

The expansion of total consumer credit outstanding reflected an increase in the outstanding amount of non-revolving consumer credit. Non-revolving consumer credit includes auto loans and student loans. According to the report, non-revolving credit outstanding grew by a seasonally adjusted annual rate of 9.4%, $230.3 billion, in February 2015, 3.6 percentage points faster than the 5.8%, $141.6 billion, growth recorded in January 2015. There is now $2.459 trillion in outstanding non-revolving credit, 74% of the total amount of consumer credit outstanding.

The growth in non-revolving credit was partially offset by a contraction in the outstanding amount of revolving credit. Revolving credit outstanding is largely composed of consumer credit card debt. After recording a small decline of 1.4%, $12.0 billion, in January 2015, revolving credit outstanding registered a larger decrease, 5.0% or $44.1 billion, in February 2015. As of January 2015, revolving credit outstanding totals $884.8 billion, 26% of total consumer credit outstanding.

Presentation1

An earlier post showed that the increase in consumer credit outstanding largely reflects an expansion in non-revolving credit outstanding. As a result, non-revolving credit outstanding as a share of total consumer credit outstanding has risen. However, while the overall composition of consumer credit outstanding is skewed to non-revolving credit, the composition of consumer credit varies by type of holder. Depository institutions, nonfinancial businesses and pools of securitized assets hold more revolving credit than non-revolving credit. In contrast, finance companies, credit unions, the federal government, and nonprofit and educational institutions hold primarily on non-revolving credit. Both the federal government and non-profit and educational institutions focus only on non-revolving credit.

As Chart 2 illustrates, of the consumer credit held by depository institutions, 54% of it represents revolving credit while the rest, 46%, is non-revolving credit. Of the consumer credit held by pools of securitized assets and nonfinancial businesses, 58% and 52% respectively is held as revolving credit while the rest, 42% and 48% respectively, is held as non-revolving consumer credit. Meanwhile, of the consumer credit held by credit unions and finance companies, 15% and 9%, respectively, is revolving credit and the rest, 85% and 91% respectively, is non-revolving credit.

Presentation2

Although 3 types of institutions hold more revolving credit than non-revolving credit, 2, nonfinancial businesses and pools of securitized assets, account for only 3% of consumer credit outstanding combined but the third, depository institutions, is the largest holder of consumer credit outstanding. Although the current composition of consumer credit outstanding held by depository institutions is currently near evenly split, this has not always been the case. As Chart 3 illustrates, the consumer credit holdings of depository institutions were largely of non-revolving credit and very little revolving credit. However, over the last 46 years, 1968-2014, the share of revolving consumer credit has steadily risen while the share of non-revolving credit has declined. In 2010, a large spike in the holdings of revolving credit by depository institutions that was related to the shift of consumer credit pools of securitized assets to other categories due to implementation of the FAS 166/167 accounting rules, pushed its share past 50%. In contrast, the share of consumer credit held by depository institutions that was non-revolving credit fell below 50%. At the end of 2014, 54% of depository institutions’ consumer credit holdings were revolving credit and the rest, 46%, was non-revolving credit.


read more….


http://eyeonhousing.org/2015/04/non-revolving-credit-drives-consumer-credit-growth/

Mortgage Loan Rates Drop for Third Consecutive Week | South Salem Real Estate

The Mortgage Bankers Association (MBA) released its report on mortgage applications Wednesday morning. The report noted a week­over­week increase of 0.4% in the group’s seasonally adjusted composite index for the week ending April 3, following an increase of 4.6% for the week ending March 20.

Mortgage loan rates decreased on all types of loans last week. On an unadjusted basis, the composite index increased by 1% week­over­week.

The seasonally adjusted purchase index increased 7% compared to the week ended April 3. The unadjusted purchase index also rose by 7% for the week and is now 12% higher year­over­year.

The MBA’s refinance index decreased 3% week­over­week, and the percentage of all new applications that were seeking refinancing slipped from 60% to 57%, its lowest level since last October.

The MBA’s chief economist noted: Purchase mortgage application volume last week increased to its highest level since July 2013, spurred on by still low mortgage rates and strengthening housing markets.

Purchase volume has increased for three straight weeks now on a seasonally adjusted basis. Adjustable rate mortgage loans accounted for 5.5% of all applications, down from 5.6% in the prior week.

The FHA share of all applications rose from 12.8% a week ago to 13.2%, and the VA share increased from 10.5% to 10.7%.


read more…


http://247wallst.com/housing/2015/04/08/mortgage-loan-rates-drop-for-third-consecutive-week/

One-of-a-Kind Cooking Spaces | Bedford Hills Real Estate

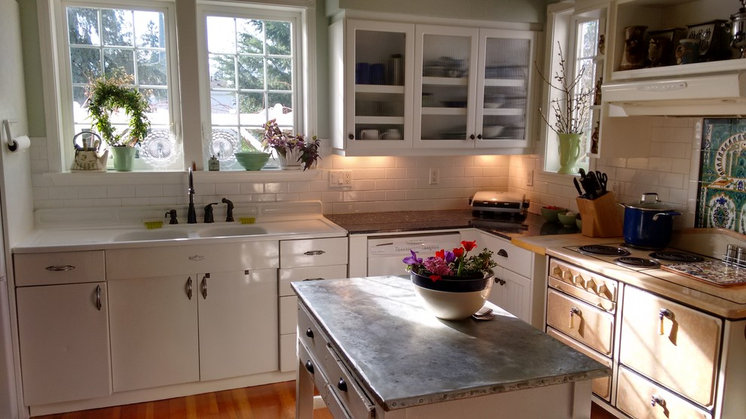
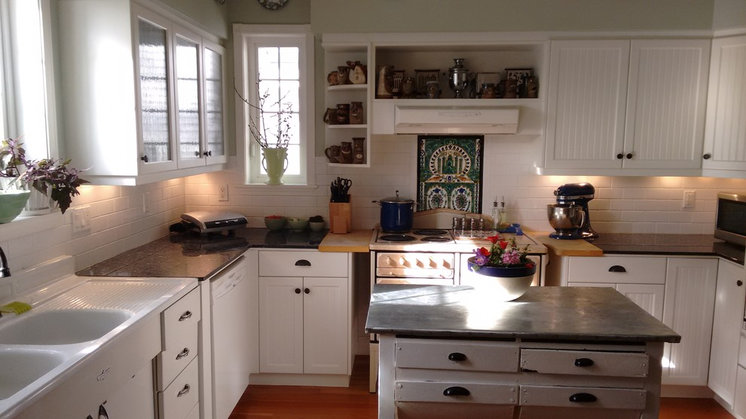
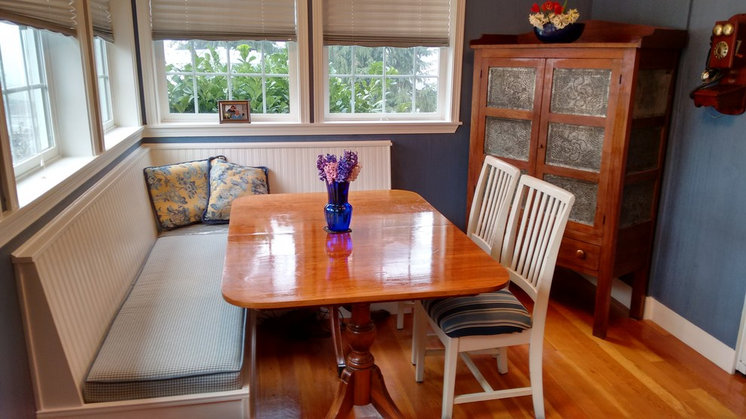
We asked avid home cooks on Houzz to share photos of where they make their magic. In this first part of a series, learn the stories behind some of their very personal cooking spaces and what they love to whip up there.

Current Trend For U.S. Median New Home Sale Prices | Bedford Real Estate

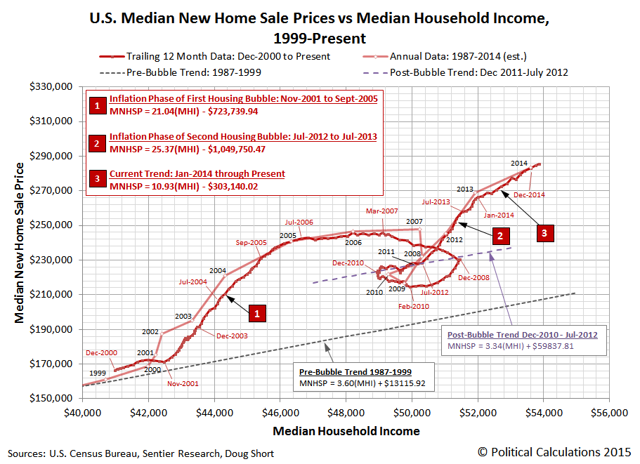
Beginning in January 2014, the trajectory of median new home sale prices in the U.S. with respect to median household income began to follow a new trend, with typical new home sale prices increasing at an average pace of nearly $11 for every $1 increase in typical household incomes.

(click to enlarge)

The good news is that rate of increase is less than half that observed during the primary inflation phases of the first and second housing bubbles in the U.S. The bad news is that rate of increase with respect to household incomes is still 2.7-3.3 greater than those recorded during periods of stable growth in the periods preceding the inflation phases of real estate bubbles.

As we noted in our previous installment, the current pace of growth is consistent with that observed in the latter portion of the inflation of the first housing bubble.

Now, it’s important to note that this situation doesn’t mean that a new crash in housing prices is imminent, or even likely. Now that real estate investors have established a shortage of affordably priced homes in the U.S. market, U.S. homebuilders are now better able to exploit the situation by building more affordably priced homes, which several have begun to do in recent months.

Note to America’s builders: less-expensive homes are starting to move.

Purchases of new homes climbed 7.8 percent from the previous month to a seasonally adjusted 539,000 annualized pace in February, a seven-year high, according to the latest U.S. government report. Perhaps the best news for the housing industry as a whole came in the breakdown of sales, by price.

Americans signed contracts to purchase 17,000 new houses in the $200,000-to-$299,999 price range last month, the most since March 2008. That amounts to 39 percent of the 44,000 properties sold in February (unadjusted and not annualized). Another 8,000 homes-the most in nine months-sold in the range of $150,000 to $199,999.

The shifting sales mix of new homes toward lower-priced homes is prompting an increase in sales volumes, which is a desirable outcome for the current market. Since November 2014, when the median new home sale price in the U.S. peaked at $302,700, the median sale prices of new homes has fallen in each month since, and in February 2015, stands at a preliminary value of $275,500. This figure will be revised several times over the next several months.


read more…


http://seekingalpha.com/article/3054396-the-current-trend-for-u-s-median-new-home-sale-prices?ifp=0

Buy a Sleek William Georgis-Designed Home in the Hamptons | Pound Ridge Real Estate

91298751.jpg

Location: Water Mill, New York
Price: $14,000,000
This contemporary home in Southhampton was designed byAD100 architect and art world favorite William Georgis, who is known for imbuing his residences with eye-catching accents and bold fixtures. In this 4,000-square-foot spread, the living room has a double-height glass wall and a ceiling-mounted fireplace, while outside there’s a small heated pool and a yard landscaped with wildflowers and bamboo stands by garden designer Paula Hayes. Built for the real estate mogul and art collector Aby Rosen, thisrectangular home with an ivy-covered front elevation comes with a boat dock, a detached one-bedroom guesthouse, a workout studio, a built-in barbecue, and four bedrooms with views of the water. Previously a $400,000 whole-summer rental, the one-acre property is now on the market asking $14,000,000.


read more…


http://curbed.com/archives/2015/04/07/william-georgis-home-water-mill-hamptons-for-sale.php?utm_campaign=issue-36187&utm_medium=email&utm_source=Curbed%27s+House+of+the+Day

NAHB Updates Local Impact of Home Building Numbers | Bedford Corners Real Estate

In addition to studies customized to a particular area, NAHB has traditionally produced a “typical local” report using national average inputs.  This report—showing the jobs, income and taxes generated by residential construction in a typical local area—is available free to everyone on NAHB’s web site.

In April 2015, NAHB updated the typical local report.  A quick summary of the new numbers is as follows:

The updated estimates of the one-year impacts (including income earned during construction and the ripple effect that occurs when some of the income is spent) of building 100 single-family homes are

  • $28.7 million in local income,
  • $3.6 million in taxes and other revenue for local governments, and
  • 394 local jobs.

And the annual, ongoing impacts (resulting from the home becoming occupied and the occupants participating in the local economy) are

  • $4.1 million in local income,
  • $1.0 million in taxes and other revenue for local governments, and
  • 69 local jobs.

read more…


NAHB Updates Local Impact of Home Building Numbers

Mortgage Rates Little Changed | North Salem Real Estate

Freddie Mac today released the results of its Primary Mortgage Market Survey® (PMMS®), showing average fixed mortgage rates largely calm amid mixed economic and housing data and ahead of the Friday employment report for March.

News Facts

  • 30-year fixed-rate mortgage (FRM) averaged 3.70 percent with an average 0.6 point for the week ending April 2, 2015, up from last week when it averaged 3.69 percent. A year ago at this time, the 30-year FRM averaged 4.41 percent.
  • 15-year FRM this week averaged 2.98 percent with an average 0.6 point, up from last week when it averaged 2.97 percent. A year ago at this time, the 15-year FRM averaged 3.47 percent.
  • 5-year Treasury-indexed hybrid adjustable-rate mortgage (ARM) averaged 2.92 percent this week with an average 0.5 point, unchanged from last week. A year ago, the 5-year ARM averaged 3.12 percent.
  • 1-year Treasury-indexed ARM averaged 2.46 percent this week with an average 0.4 point, unchanged from last week. At this time last year, the 1-year ARM averaged 2.45 percent.

Average commitment rates should be reported along with average fees and points to reflect the total upfront cost of obtaining the mortgage. Visit the following links for theRegional and National Mortgage Rate Details and Definitions. Borrowers may still pay closing costs which are not included in the survey.

Quotes
Attributed to Len Kiefer, deputy chief economist, Freddie Mac.

“Mortgage rates were little changed this week entering April about where we started the year. The final estimate of real GDP growth for the fourth quarter of 2014 was unchanged from the prior estimate of a 2.2 percent annualized rate. Meanwhile, the National Association of Realtors reported that pending home sales rose 3.1 percent in February, beating expectations. The pending home sales index was at the highest level since June of 2013 when 30-year fixed mortgage rates averaged 4.07 percent, 0.37 percentage points higher than this week’s survey.”